
Specific detection and deletion of the sigma-1 receptor widely expressed in neurons and glial cells in vivo
By Qing Liu, Qilin Guo, Li-Pao Fang, Honghong Yao, Anja Scheller, Frank Kirchhoff, and Wenhui Huang
Excerpt from the article published in Journal of Neurochemistry, 00, 1– 22, 09 September 2022, DOI: https://doi.org/10.1111/jnc.15693
Editor’s Highlights
- The chaperon protein sigma-1 receptors (S1Rs) are mainly localized in the ER-like structure of CNS cells. Notably, in the olfactory bulb, cerebral cortex, hippocampus, and thalamus.
- S1R expression in astrocytes is not colocalized with the astrocytic cytoskeleton protein GFAP.
- Activation or inactivation of S1Rs by exogenous ligands both showed therapeutic effects for numerous neurological and psychological disorders.
- Unlike the pharmacological effects of the exogenous ligands, S1R KO mice showed mild phenotypes in ageing-related memory loss, cognitive impairments, motor defects, etc.
- Can be a certain genetic compensatory machinery established during embryonic development that rescues the loss of S1R functions.
Abstract
The chaperon protein sigma-1 receptor (S1R) has been discovered over 40 years ago. Recent pharmacological studies using S1R exogenous ligands demonstrated a promising therapeutical potential of targeting the S1R in several neurological disorders. Although intensive in vitro studies have revealed S1Rs are mainly residing at the membrane of the endoplasmic reticulum (ER), the cell-specific in vivo expression pattern of S1Rs is still unclear, mainly because of the lack of a reliable detection method which also prevented a comprehensive functional analysis. Here, first, we identified a highly specific antibody using S1R knockout (KO) mice and established an immunohistochemical protocol involving a 1% sodium dodecyl sulphate (SDS) antigen retrieval step. Second, we characterized the S1R expression in the mouse brain and can demonstrate that the S1R is widely expressed: in principal neurons, interneurons and all glial cell types. In addition, unlike reported in previous studies, we showed that the S1R expression in astrocytes is not colocalized with the astrocytic cytoskeleton protein GFAP. Thus, our results raise concerns over previously reported S1R properties. Finally, we generated a Cre-dependent S1R conditional KO mouse (S1R flox) to study cell-type-specific functions of the S1R. As a proof of concept, we successfully ablated S1R expressions in neurons or microglia employing neuronal and microglial Cre-expressing mice, respectively. In summary, we provide powerful tools to cell-specifically detect, delete and functionally characterize S1R in vivo.
1 INTRODUCTION
The sigma-1 receptor (S1R) is a chaperon protein primarily residing at mitochondria-associated membranes (MAM) of the endoplasmic reticulum (ER) with a single membrane-spanning domain, which is considered as a pluripotent modulator involved in many aspects of cellular functions (Lee et al., 2020; Su, Su, Nakamura, & Tsai, 2016; Zhemkov et al., 2021). Previous studies by immunohistochemistry (IHC) and mRNA expression profiling experiments suggested that S1Rs are highly expressed in the central nervous system (CNS) and can also be detected in other organs such as liver, kidney and muscles (Couly et al., 2022; Su et al., 2016; Zhang et al., 2014). However, it is still hard to conclude the cellular expressin patterns of S1R in the CNS because of seemingly paradoxical results obtained by IHC. For instance, using a custom-made antibody Alonso et al. detected S1Rs only in neurons in the brain and spinal cord, while Palacios et al., using an independently custom-made antibody could observe S1R expression also in oligodendrocytes (OLs) (Alonso et al., 2000; Palacios et al., 2003), and Ruscher et al., using a commercial antibody observed S1R immunoreactivity co-localized with the cytoskeleton indicated by glial fibrillary acidic protein (GFAP) as well as with the galactocerebroside-enriched membrane microdomains of reactive astrocytes in the peri-infarct area of rat brains after cerebral stroke (Ruscher et al., 2011). Of note, it is not clear whether the specificity of the antibodies used in the aforementioned studies was tested by S1R KO mice/cell lines as rigorous controls. To date, only one custom-made antibody against S1R (termed AbRuoho) generated by Arnold Ruoho’s group was validated by S1R KO mice, showing high specificity for IHC in the brain and spinal cord (though it did not work well for immunoblot) (Mavlyutov et al., 2016; Mavlyutov, Epstein, Andersen, Ziskind-Conhaim, & Ruoho, 2010; Nakamura et al., 2019). However, in these studies, the fine structures of AbRuoho stained cells in brain slices were not displayed with high magnification, neither were co-immunostainings combined for different cell type markers with AbRuoho performed. Therefore, it is hard to verify the detailed expression pattern of S1Rs in neurons and glial cells in vivo.
Neurons and glial cells interact with each other to orchestrate diverse CNS functions. Previous studies using constitutive S1R KO mice suggest S1Rs are involved in the maintenance of cognitive, psychiatric and motor functions, particularly with ageing (Couly et al., 2022). Moreover, the S1R is considered as an enigmatic therapeutic target for various neurological disorders (e.g. Alzheimer’s disease, Parkinson’s disease, amyotrophic lateral sclerosis, multiple sclerosis, etc.) upon activation by its exogenous ligands including agonists and antagonists (Sałaciak & Pytka, 2022; Schmidt & Kruse, 2019). However, the contribution of cell-type-specific S1Rs to modulate the neural network activity under physiological and pathological conditions as well as upon activation is still not well understood, which could be addressed by inducing S1R deletion or overexpression in targeted cells in vivo.
In the current work, we prepared tissue lysates of brains and spinal cords from WT and S1R KO mice to screen six commercial antibodies against the S1R for their immunospecificity by immunoblot. We obtained one rabbit monoclonal antibody (#61994, Cell Signaling) displaying very high specificity for S1R by Western blot analysis. We further revealed that after the antigen retrieval (AR) using 1% sodium dodecyl sulphate (SDS), this antibody demonstrated highly specific immunolabelling of S1Rs in situ in the CNS. Combining immunostaining for different cell type markers, we identified that S1Rs were widely expressed in the CNS, that is, in principal neurons, interneurons, astrocytes, oligodendrocyte precursor cells (OPCs), OLs and microglia. In addition, we found that unlike previous reports (Francardo et al., 2014; Ruscher et al., 2011), S1R expression in astrocytes was not correlated with the GFAP-labelled cytoskeleton, neither in healthy brain slices nor after acute brain injuries. Second, we generated a S1R flox mouse with exons 1–3 of Sigmar1 (gene name of S1R, also called Oprs1) flanked by two loxP sites. By cross-breeding this S1R flox mouse with two Cre-driver mouse lines targeting neurons and microglia, respectively, we were able to show the specific deletion of S1Rs in targeted cells in vivo. Taken together, we introduce a reliable protocol to detect S1Rs, which are broadly expressed in the CNS, by immunoblotting and IHC. We also provide a newly generated S1R flox mouse for cell-type-specific ablation of S1Rs in vivo. In the future, these tools will facilitate the functional analysis of S1Rs in vivo.
…
3 RESULTS
3.1 Specific detection of the S1R by immunoblot
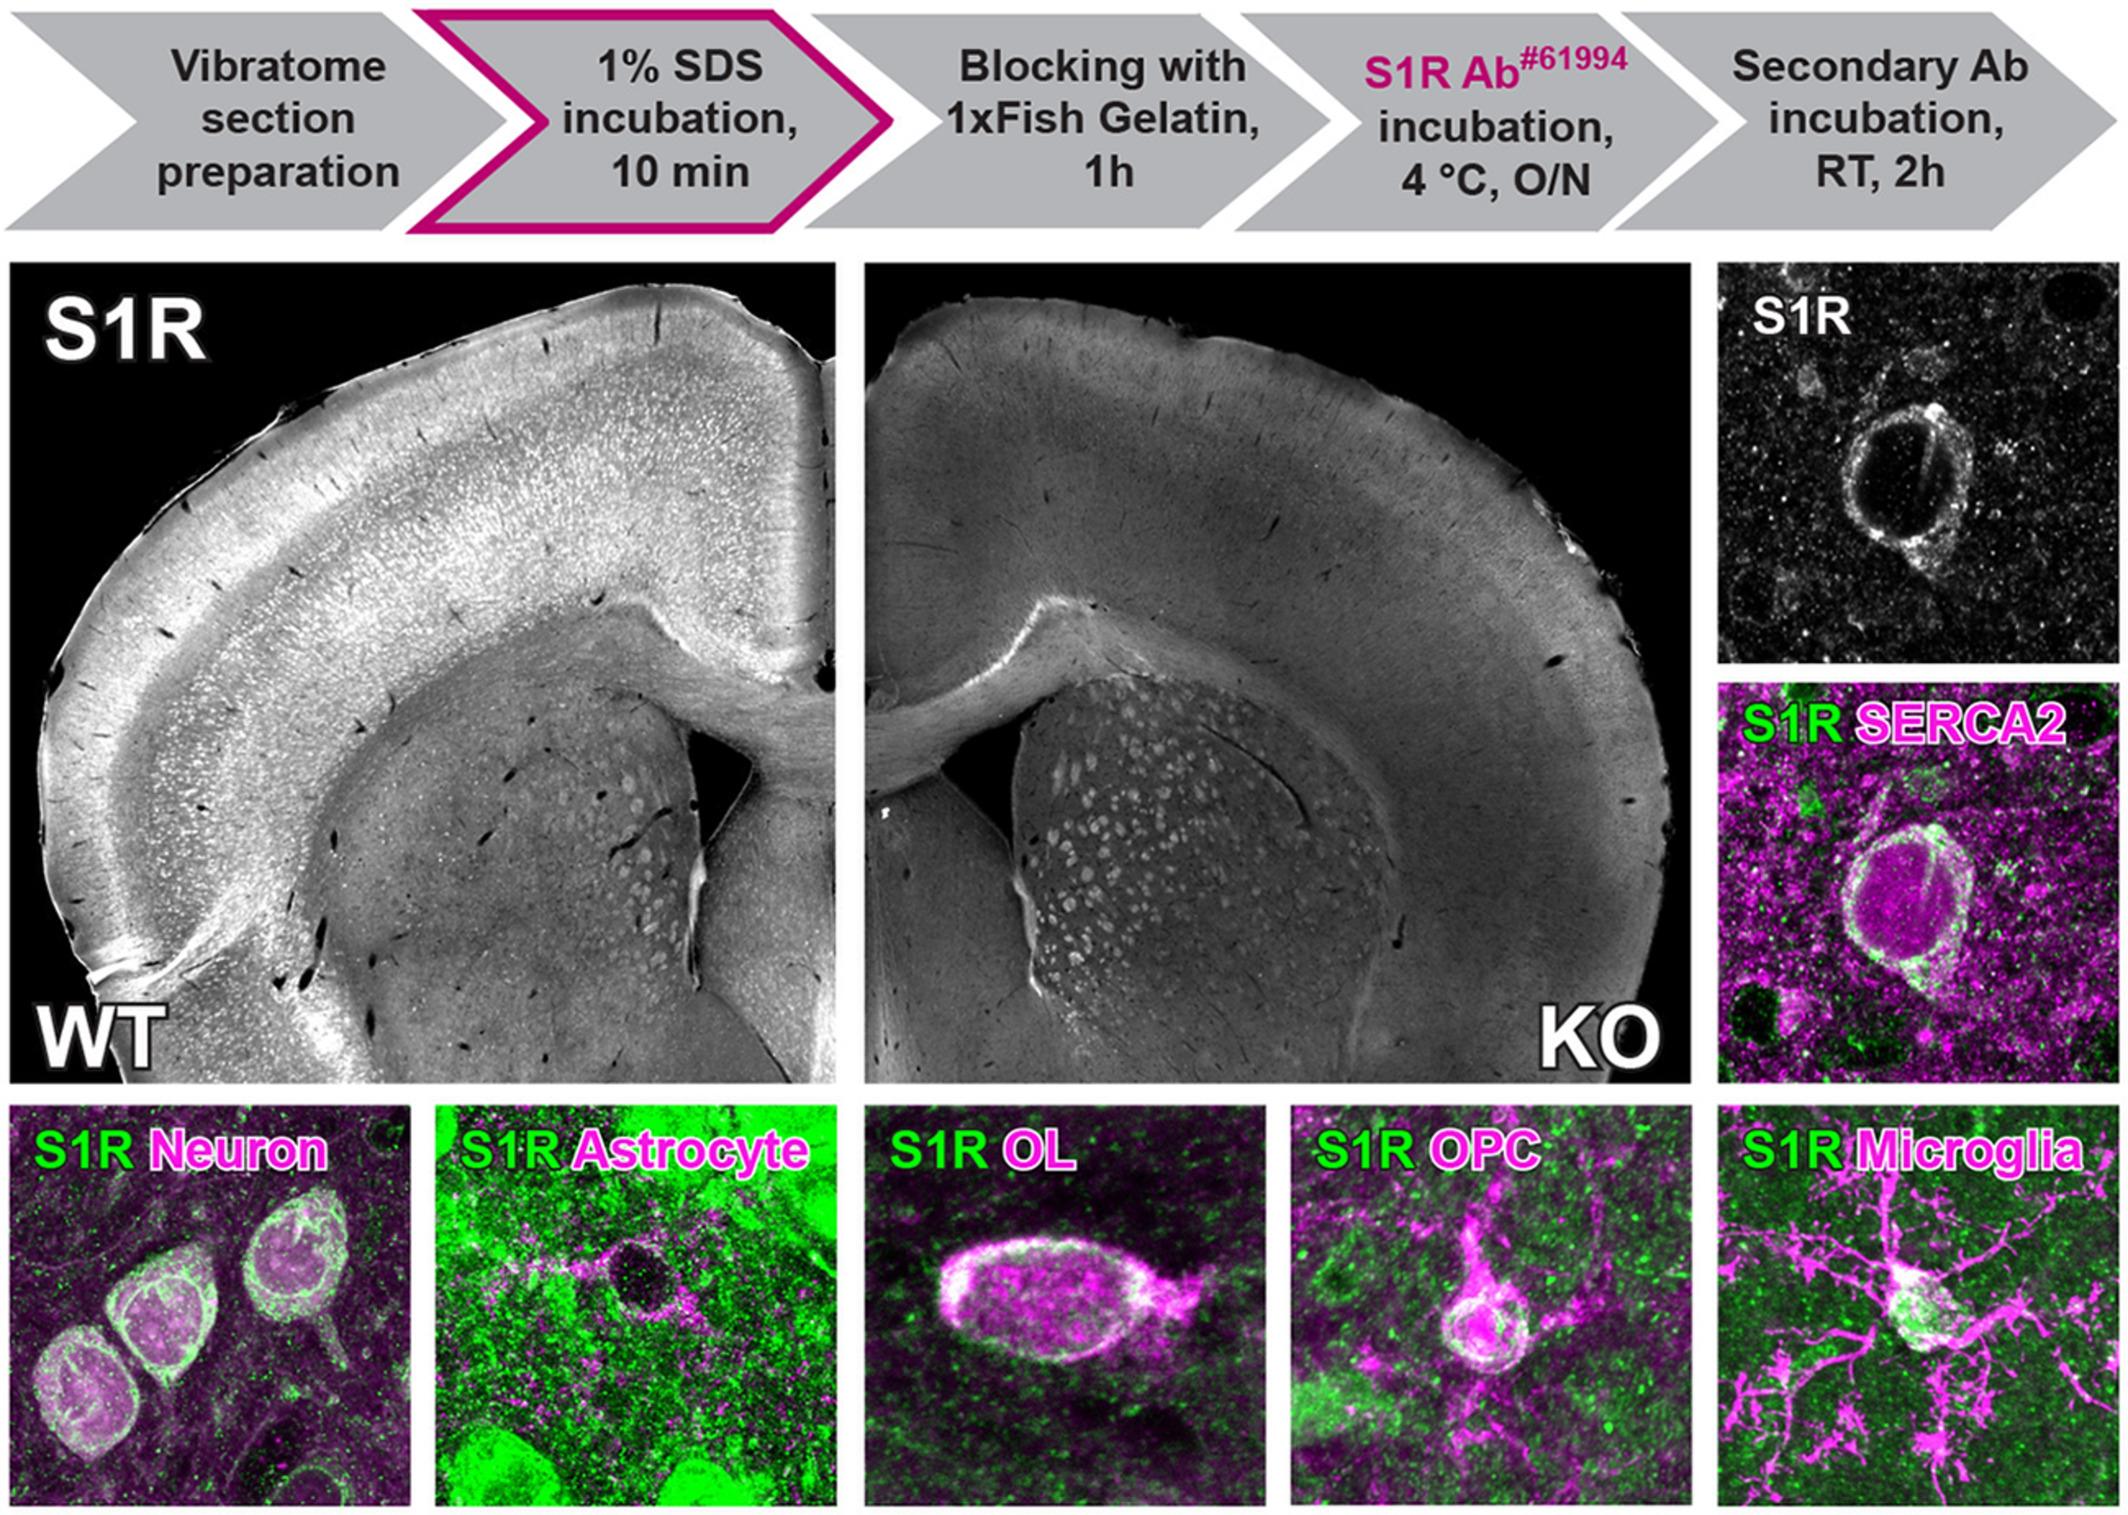
To identify reliable S1R antibodies, we screened six commercially available antibodies on tissue homogenates obtained from the cerebral cortex and spinal cord of WT and S1R KO mice by immunoblotting. The protein samples were prepared by RIPA buffer containing 1% Triton X-100 to release total proteins of the tissue. We loaded 5–30 μg proteins per sample for SDS-PAGE. Prior to incubating with primary antibodies, we stained the blotted nitrocellulose (NC) membranes with Ponceau S solution to confirm proteins of different sizes were uniformly transferred. After incubating the NC membrane with S1R antibodies, we took advantage of the high sensitivity of the HRP (horseradish peroxidase)-based enhanced chemiluminescent (ECL) system to detect S1Rs. To detect potential unspecific signals, we exposed each membrane incubated with different S1R antibodies to a digital imaging system for as long as 15 min. We observed that one monoclonal rabbit antibody #61994 (Ab#61994) from Cell Signaling showed strong signals at the expected size of the S1R (25 kD) in WT mice which were completely absent in the KO mice (Figure 1a, left). Even with the long exposure time (15 min), we detected only faint bands at positions of higher molecular weight. In addition, Ab#61994 generated the same immunoblot results to detect S1Rs in whole brain lysates (data not shown). Another monoclonal rabbit antibody #74807 from Cell Signaling did not show any bands at 25 kD but unspecific upper bands in WT and KO mice. The monoclonal mouse antibody sc-137075 from Santa Cruz showed relatively weak but specific bands of S1Rs at 25 kD, in line with previous studies (Moreno et al., 2014; Yang, Shen, Li, Stanford, & Guo, 2020). However, Absc-137075 also detected many other proteins of different sizes both in WT and KO mice. Other polyclonal rabbit antibodies, that is 42–3300 from Invitrogen, ab53852 from Abcam and 15 168-1-AP from Proteintech, showed bands at 25 kD and other positions both in WT and KO mice (Ab15168-1-AP showed weaker bands at 25 kD in KO mice), indicating unspecific detections of S1Rs by those antibodies for immunoblot (Figure 1a). Taken together, Ab#61994 was identified as the most specific antibody to detect S1Rs in CNS tissues by immunoblot.
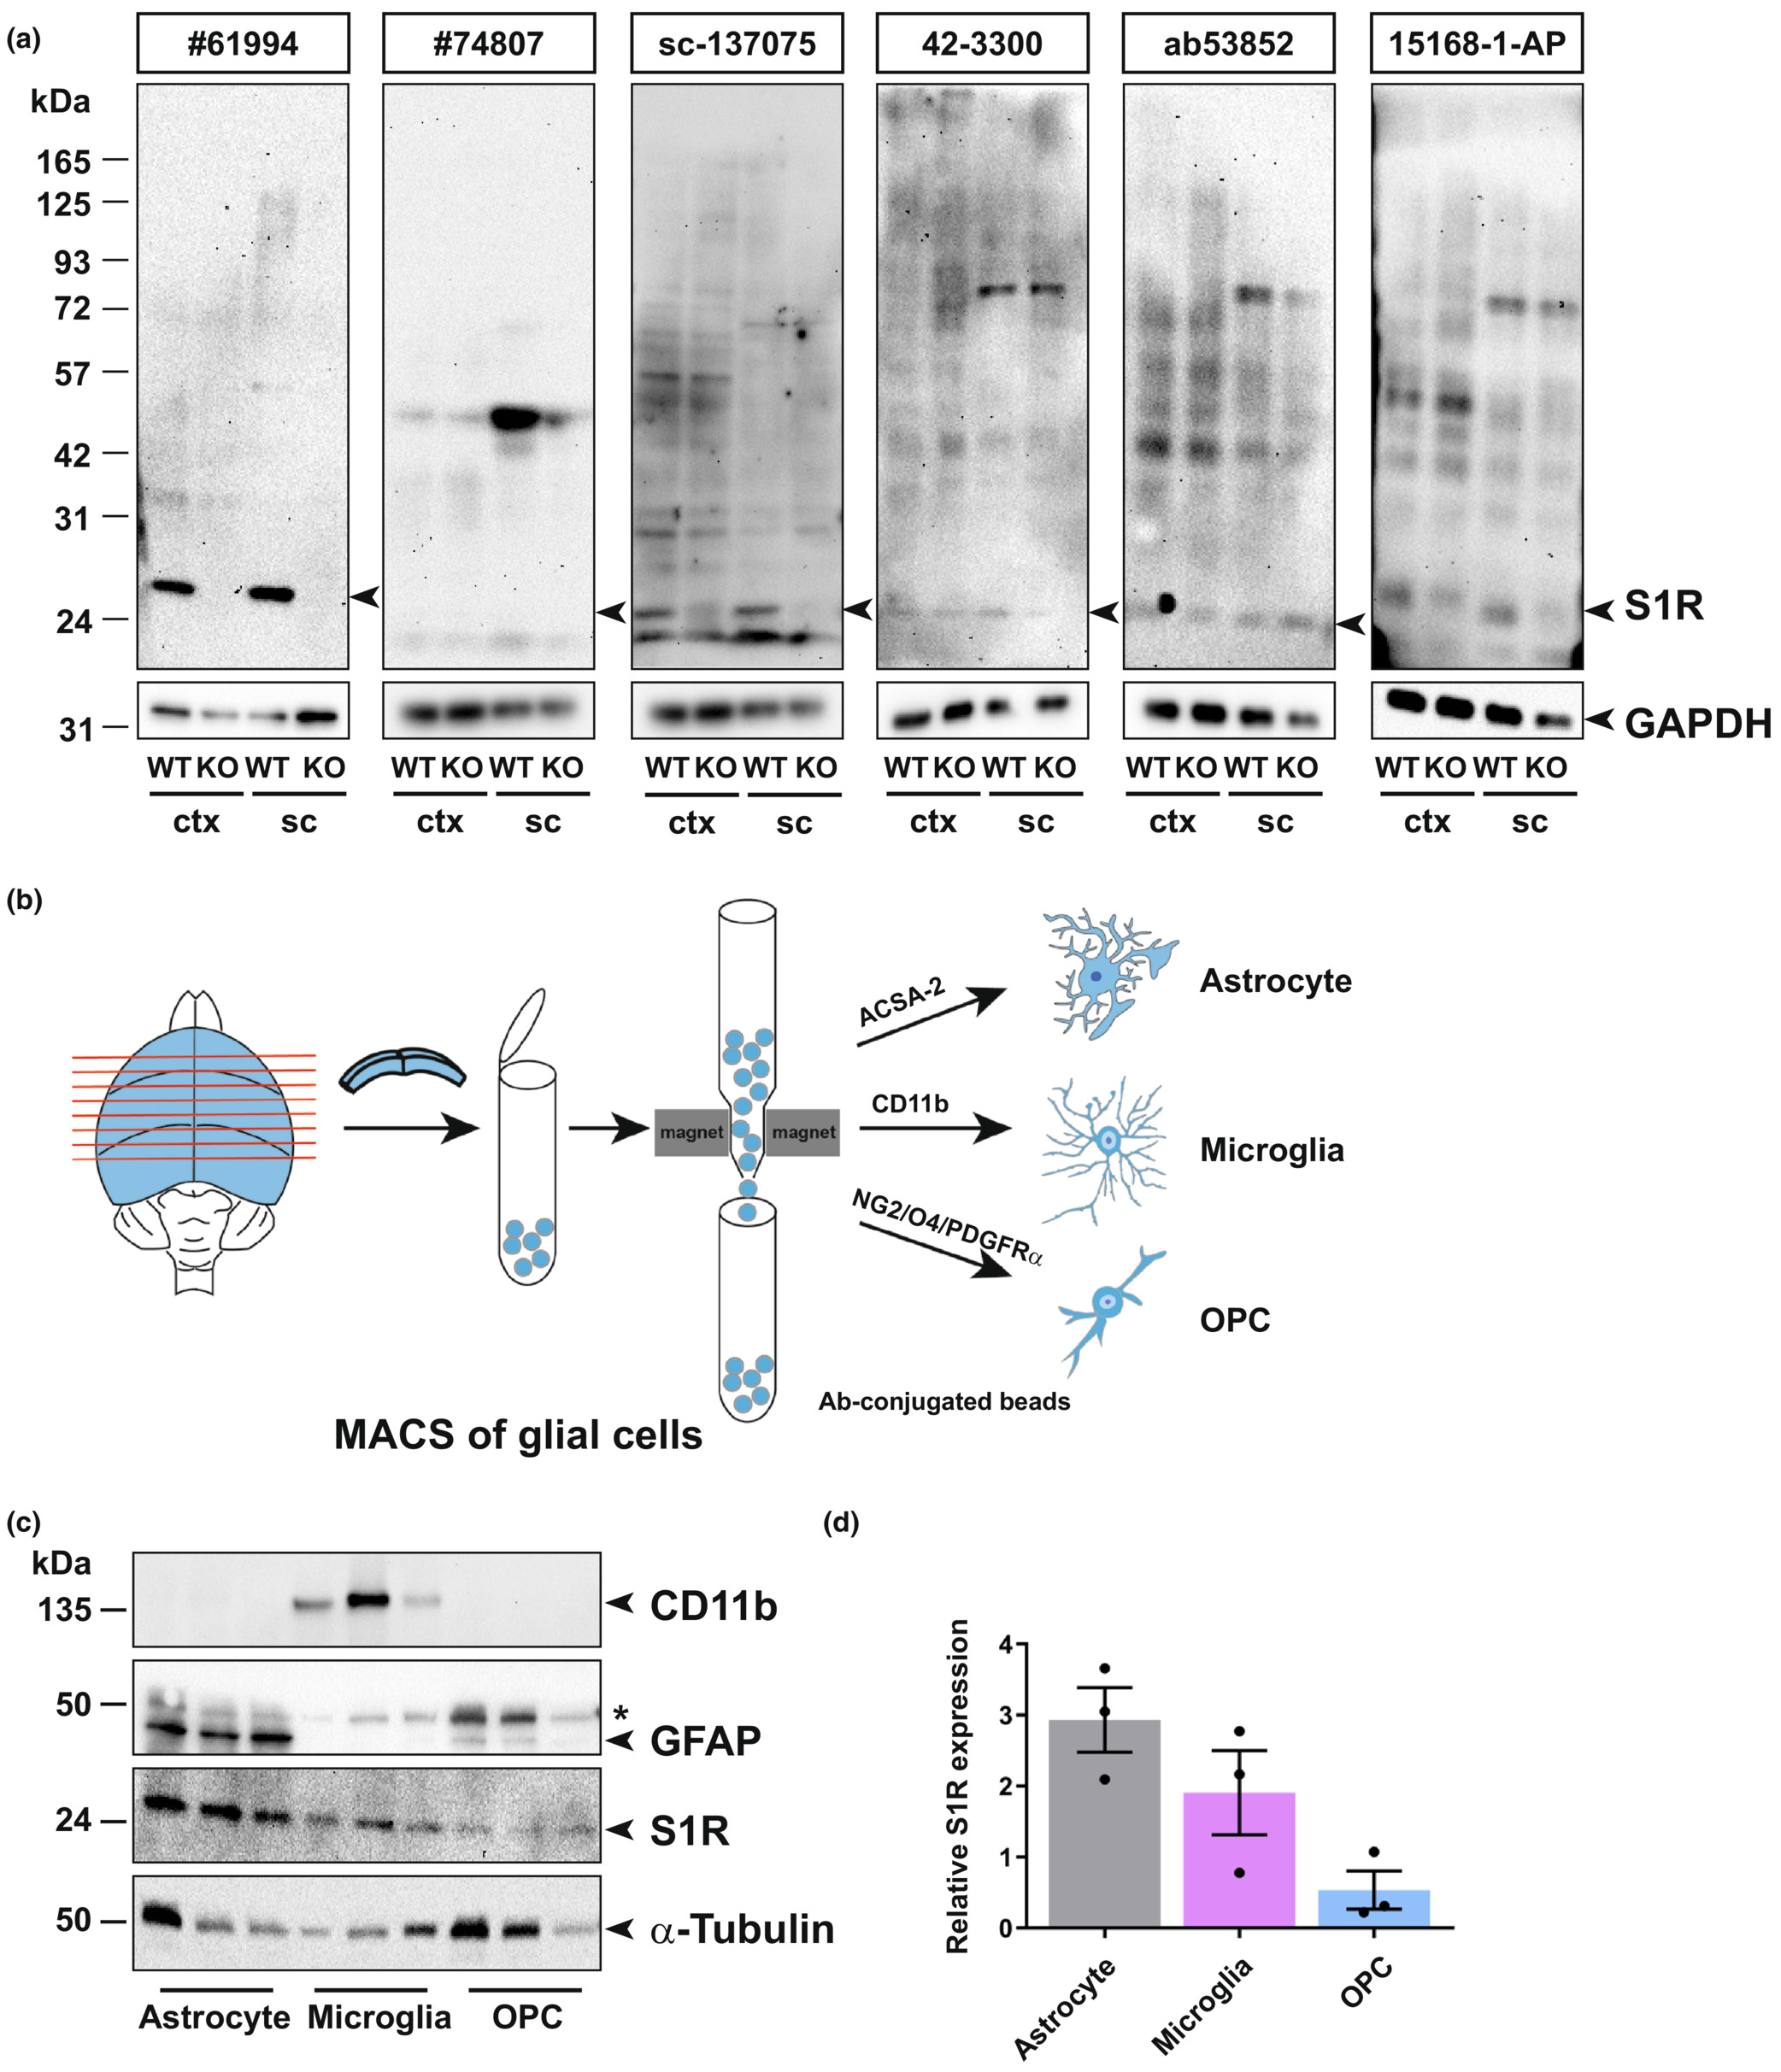
Detection of S1Rs in the CNS by immunoblot. (a) Full-length scan of the S1R immunoblot of protein lysates from cortex (ctx) and spinal cord (sc) tissue of WT and S1R KO mice. S1R antibodies (Abs) from Cell Signaling (#61994 and #74807), Santa Cruz (sc-137075), Invitrogen (42–3300), Abcam (ab53852) and Proteintech (15168-1-AP) were used. The correct molecular weight of S1R is 25 kDa. GAPDH was used as loading control. The same membrane was reused for #74807 after stripping off sc-137075. (b) Illustration of magnetic-associated cell sorting (MACS) of glial cells from mouse cortex. ACSA-2, CD11b and NG2/O4/PDGFRα conjugated beads were used to purify astrocytes, microglia and OPCs, respectively. (c) Immunoblots with expression of S1Rs in sorted astrocytes, microglia and OPCs from mouse brain with CD11b and GFAP immunoblot demonstrating the purity of microglia and astrocyte from MACS respectively. α-Tubulin was used as loading control. Asterisk (*) indicates the band of α-Tubulin which was not totally stripped off. (d) Quantification of grey values of bands from c showing the relative expression of S1R proteins in different glial cells (normalized to α-Tubulin). n = 3 mice.
Previous transcriptome profiling studies using purified cells from postnatal mice demonstrated that Sigmar1 was widely expressed in neurons and glial cells, and was even detected with higher expression level in microglia and OPCs than in other cells (Figure S1A) (Zhang et al., 2014). To detect Sigmar1 expression levels in glial cells of adult mice, we purified translated mRNA directly from astrocytes, microglia and OPCs of adult mouse cerebral cortex using a Cre-dependent RiboTag approach (Figure S1B,C,D). Quantitative real-time PCR (qPCR) results suggested that adult astrocytes, microglia and OPCs all expressed Sigmar1 mRNA, however, with variable levels when normalized to the Actb expression per se (Figure S1E). To further confirm the S1R protein expression in adult glia, we purified astrocytes, microglia and OPCs from the cortex of adult WT mice by magnetic-activated cell sorting (MACS) and performed immunoblots with the specific Ab#61994 (Figure 1b–d). We observed that S1Rs could be detected in protein samples from purified astrocytes, microglia and OPCs. A comparison using α-tubulin as loading controls demonstrated that glial cells do express S1R proteins with variable levels. Notably, Western blot and qPCR analyses of target genes usually rely on normalization to expression levels of house-keeping genes (e.g. β-actin, α-tubulin) which are unequal in different cell types (Ximerakis et al., 2019; Zhang et al., 2014), thereby it is difficult to quantitatively compare S1R expression in purified CNS cells by these methods. Instead, in situ immunolabelling would help to better determine the expression pattern of the S1R.
3.2 Establishment of a reliable protocol for S1R immunohistochemistry
To investigate the S1R expression in situ, a specific S1R antibody working for IHC is highly demanded. Because paraffin or cryo-section preparations are known to be harmful to antigen preservations for IHC (Hira et al., 2019; Shi, Cote, & Taylor, 1997), we used free-floating vibratome sections of formaldehyde-fixed brain tissues. We started with the regular protocol working well in our previous studies (Huang et al., 2020; Huang, Guo, Bai, Scheller, & Kirchhoff, 2019) to test the S1R antibodies (Figure 2a). However, we observed that Ab#61994, Ab#74807 (data not shown) and Absc-137075 did not show any labelling in WT and KO mice (Figure 2b and Figure S2A). We also found that Abab53852 and Ab15168-1-AP showed weak immunostaining in neuron-like cell bodies which were identical in WT and KO mice (Figure S2B,C). In addition, Abab53852 and Ab15168-1-AP strongly labelled many cells with a pattern very similar to anti-GFAP staining, mostly in corpus callosum and hippocampus of WT and KO mice. We noticed that such GFAP-like staining was the only immunolabel of Ab42-3300, however, both in WT and KO mice (Figure S2D). Therefore, these S1R antibodies are not suitable for IHC and specific immunolabelling of cells in the mouse brain.
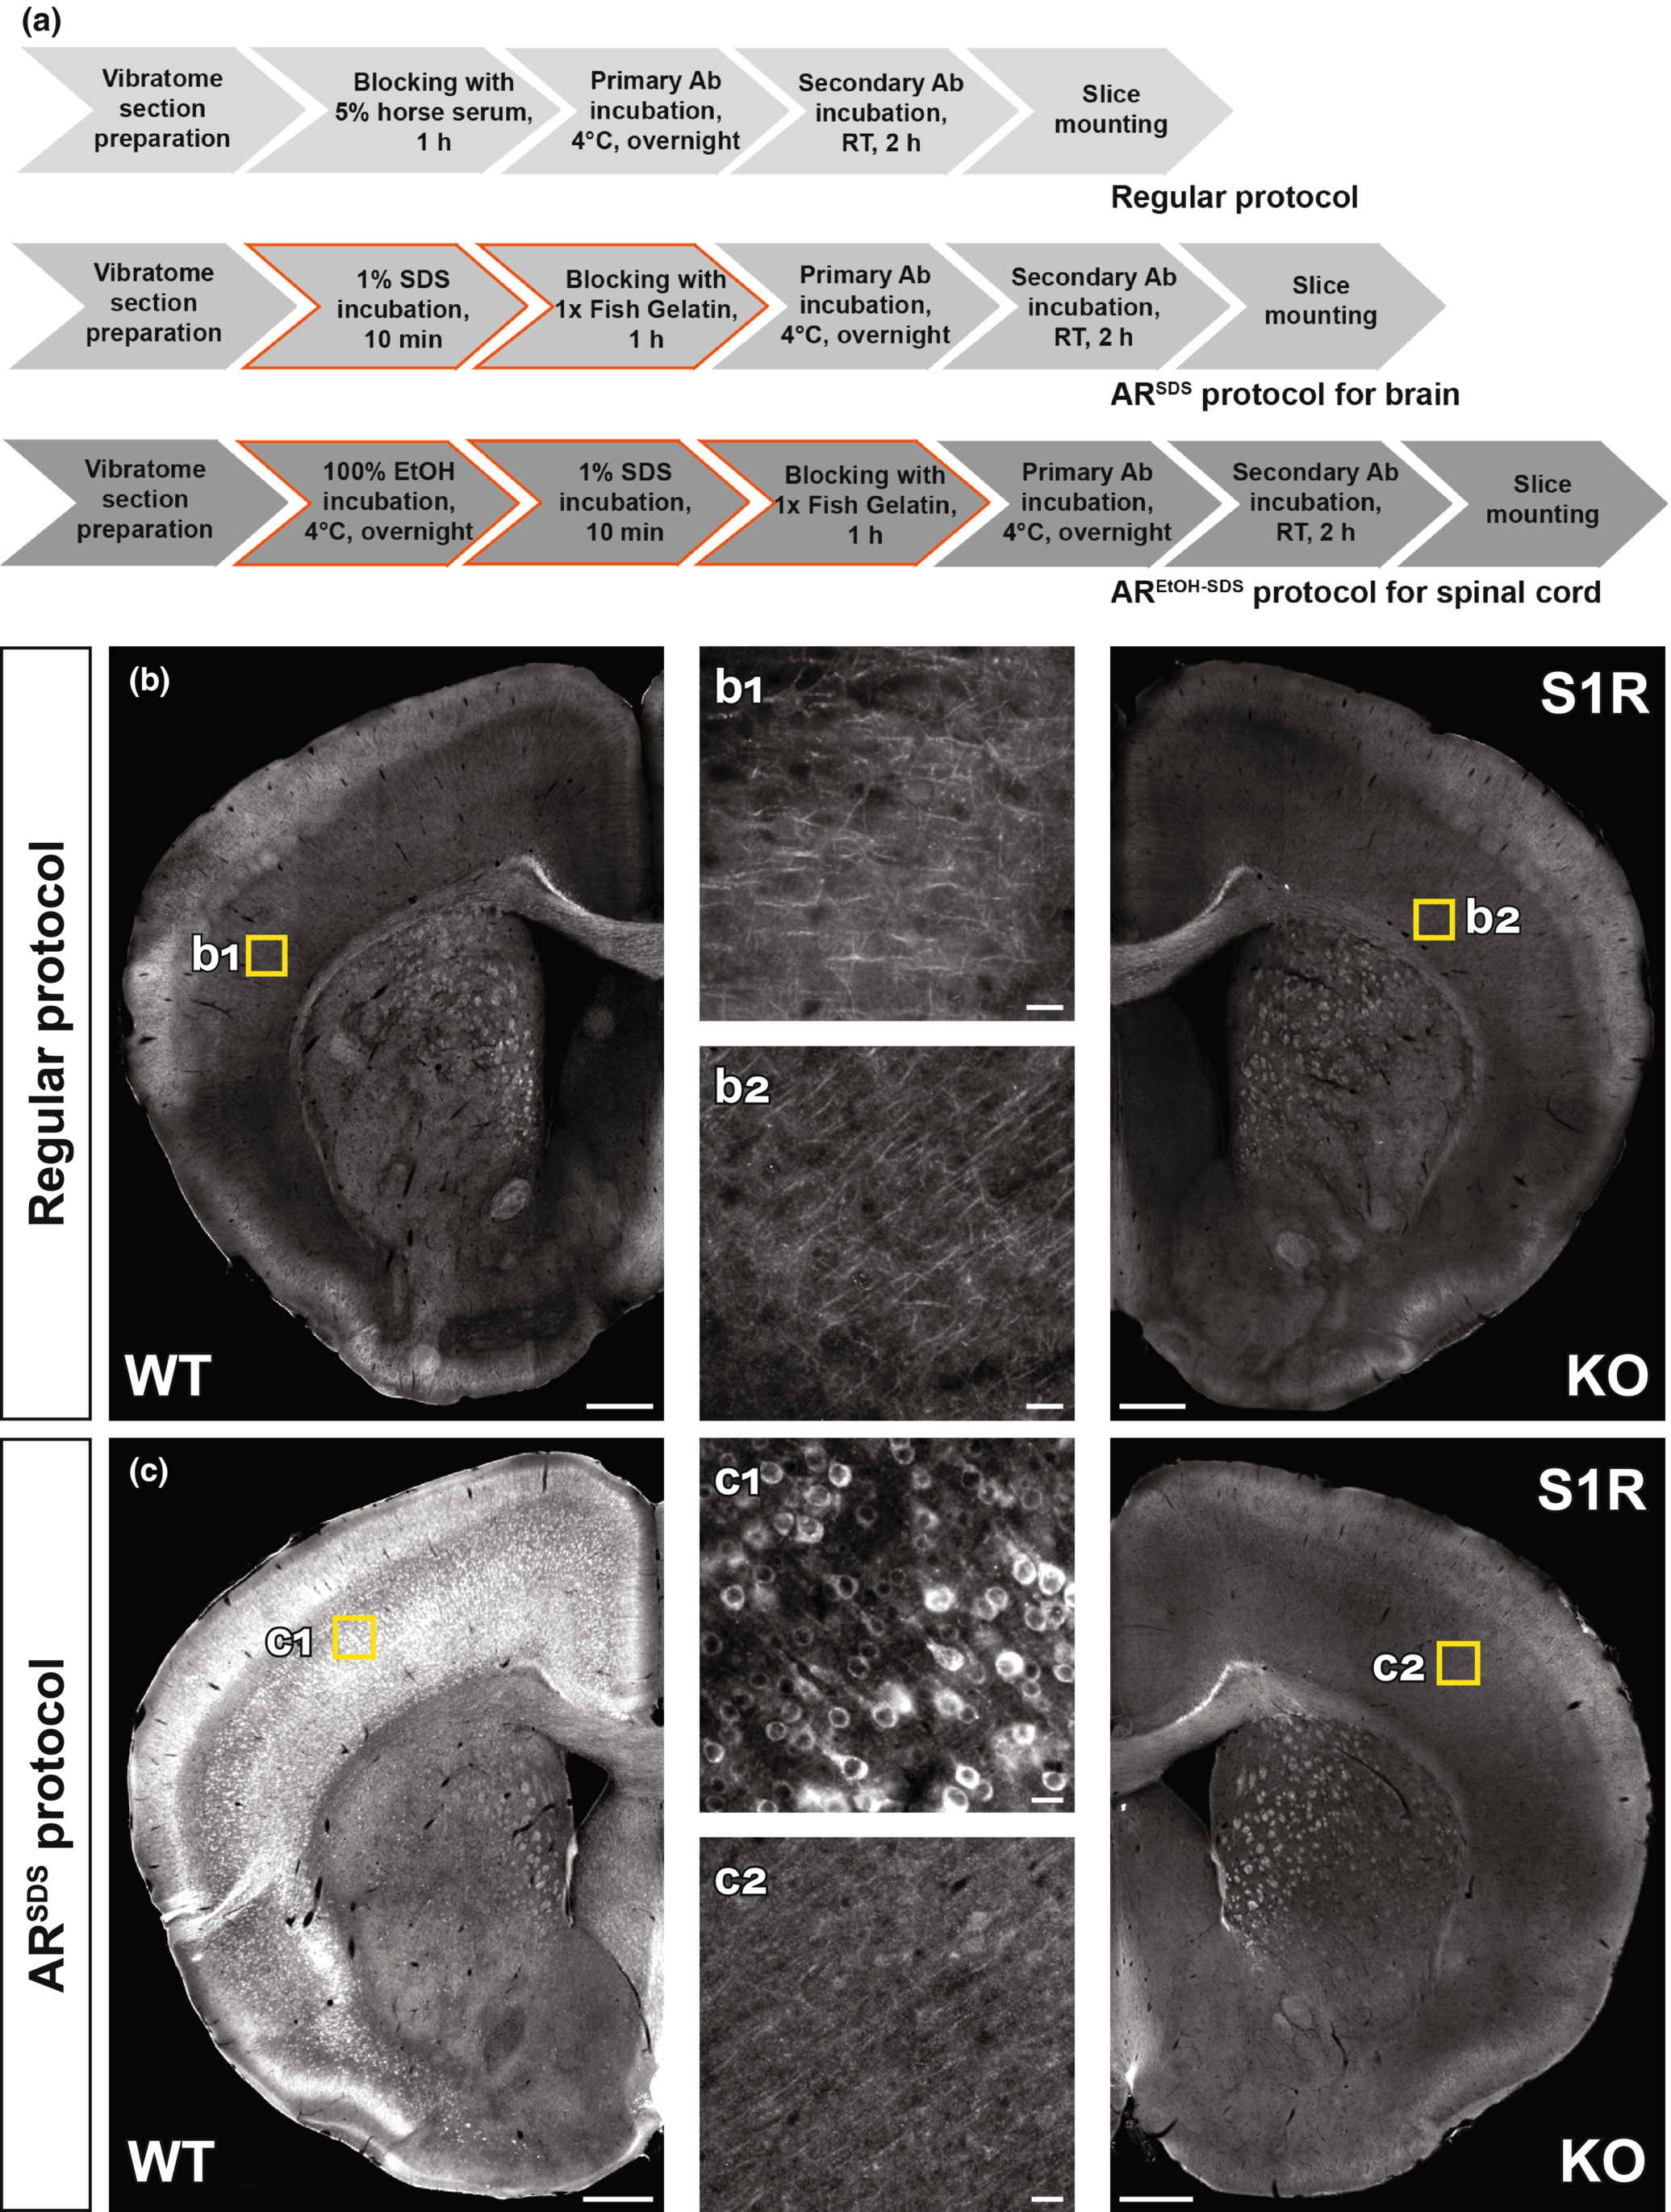
Establishing immunohistochemical protocols to specifically detect S1Rs. (a) Immunohistochemical protocols tested for vibratome sections of brain and spinal cord. The regular protocol without antigen retrieval (AR) was compared to ARSDS protocol with AR using 1% SDS for brain slices. The modified ARSDS protocol with AR using 100% ethanol and 1% SDS sequentially was used for spinal sections (AREtOH-SDS). (b, c) Fluorescent images of S1R immunostainings performed with the regular protocol (b) or ARSDS protocol (c) using Ab#61994. Magnified images (b1, b2, c1, c2) showing corresponded yellow boxes in the cortex of WT (b1, c1) and KO (b2, c2) mice. Scale bars = 200 μm in b-c, 5 μm in b1, b2, c1, c2.
SDS has been suggested as an AR reagent for antibodies detecting denatured proteins in IHC (Brown et al., 1996; Wilson & Bianchi, 1999). Considering that Ab#61994 specifically recognized SDS-denatured S1Rs for immunoblot, we thereby treated vibratome brain slices with SDS (1%, 10 min at RT (20-22°C)) for AR prior to the blocking step (Figure 2a). And indeed, we observed bright and clear immunoreactivity to Ab#61994 in WT mice which was completely absent in S1R KO mice, strongly indicating the capability of Ab#61994 to specifically detect S1Rs in IHC (Figure 2c). Control experiments with only secondary antibodies further confirmed the reliable staining of Ab#61994 in WT mice (Figure S3A,B). Detailed analysis revealed the ARSDS protocol (i.e., 1% SDS for AR + Ab#61994) specifically detected S1R-expressing cells in all CNS regions, except some unspecifically stained white matter tracts in the brain stem, cerebellum and spinal cord (Figure S4A,B) which was not caused by Triton X-100 used in the blocking buffer that may generate myelin staining as suggested by previous studies (Figure S3C,D) (Weruaga et al., 1998). We also noticed that unlike previous reports (Mavlyutov et al., 2010), the cerebral cortex, hippocampus, thalamus and olfactory bulb area showed strong immunolabelling of S1Rs by this protocol (Figure S4A, a1–a3 and B, b1–b3). Although in images with higher magnifications a background staining of tiny puncta could be seen in WT and KO mice (Figure S5A), Ab#61994 immunolabelling clearly demonstrated the ER-like perinuclear ring structures of the S1R staining as reported in previous studies using EYFP-tagged S1Rs in cultured cells (Hayashi & Su, 2007; Kopanchuk et al., 2022) which was further confirmed by co-labelling an ER marker SERCA2 (Figure S5B). In addition, this protocol could immunolabel S1Rs in other organs such as liver (Figure S6A–D) and heart (Figure S6E–H). Therefore, the current ARSDS protocol is able to reliably identify S1R expression in situ.
We tested the effect of 1% SDS pre-treatment for other S1R antibodies as well. However, we did not observe improved immunostaining by Ab#74807 (data not shown), Absc-137075, Ab42-3300 and Abab53852 compared to a treatment without SDS (Figure S7A–C). In line with the immunoblot results, the immunolabelling by Ab15168-1-AP in WT mice was improved after the AR, whereas in KO mice similar but weaker immunostaining was also observed (Figure S7D). In addition, the GFAP-like staining pattern could always be found using Ab42-3300, Abab53852and Ab15168-1-AP in WT and KO mice even after the AR (Figure S7B-D). Taken together, except Ab#61994, the other commercial S1R antibodies failed to provide a reliable immunolabelling of S1Rs for IHC.
3.3 S1Rs are widely expressed in neurons and glial cells in the forebrain
We took advantage of the newly established IHC ARSDS protocol to study the expression of S1Rs in the CNS. We observed similar patterns of S1R immunoreactivity in the brains of mice at different ages from postnatal day 7 (P7) to 24 w (Figure S8A–D). Recent single-cell RNA sequencing (sc-RNA-seq) studies suggest that Sigmar1 expression can be detected in CNS cell types with different proportions and levels (Figure S9) (Consortium, 2020; Ximerakis et al., 2019). Thus, we performed co-immunostaining for S1Rs and different cell markers in the brain of 8-week-old mice to study S1R expression in detail, with particular focus on regions in the dorsal brain such as cerebral cortex (grey matter) and corpus callosum (cc, white matter) as well as in the ventral brain such as striatum (CPu, caudate putamen), thalamus (th) and hypothalamus (hth) (Figures 3–7).
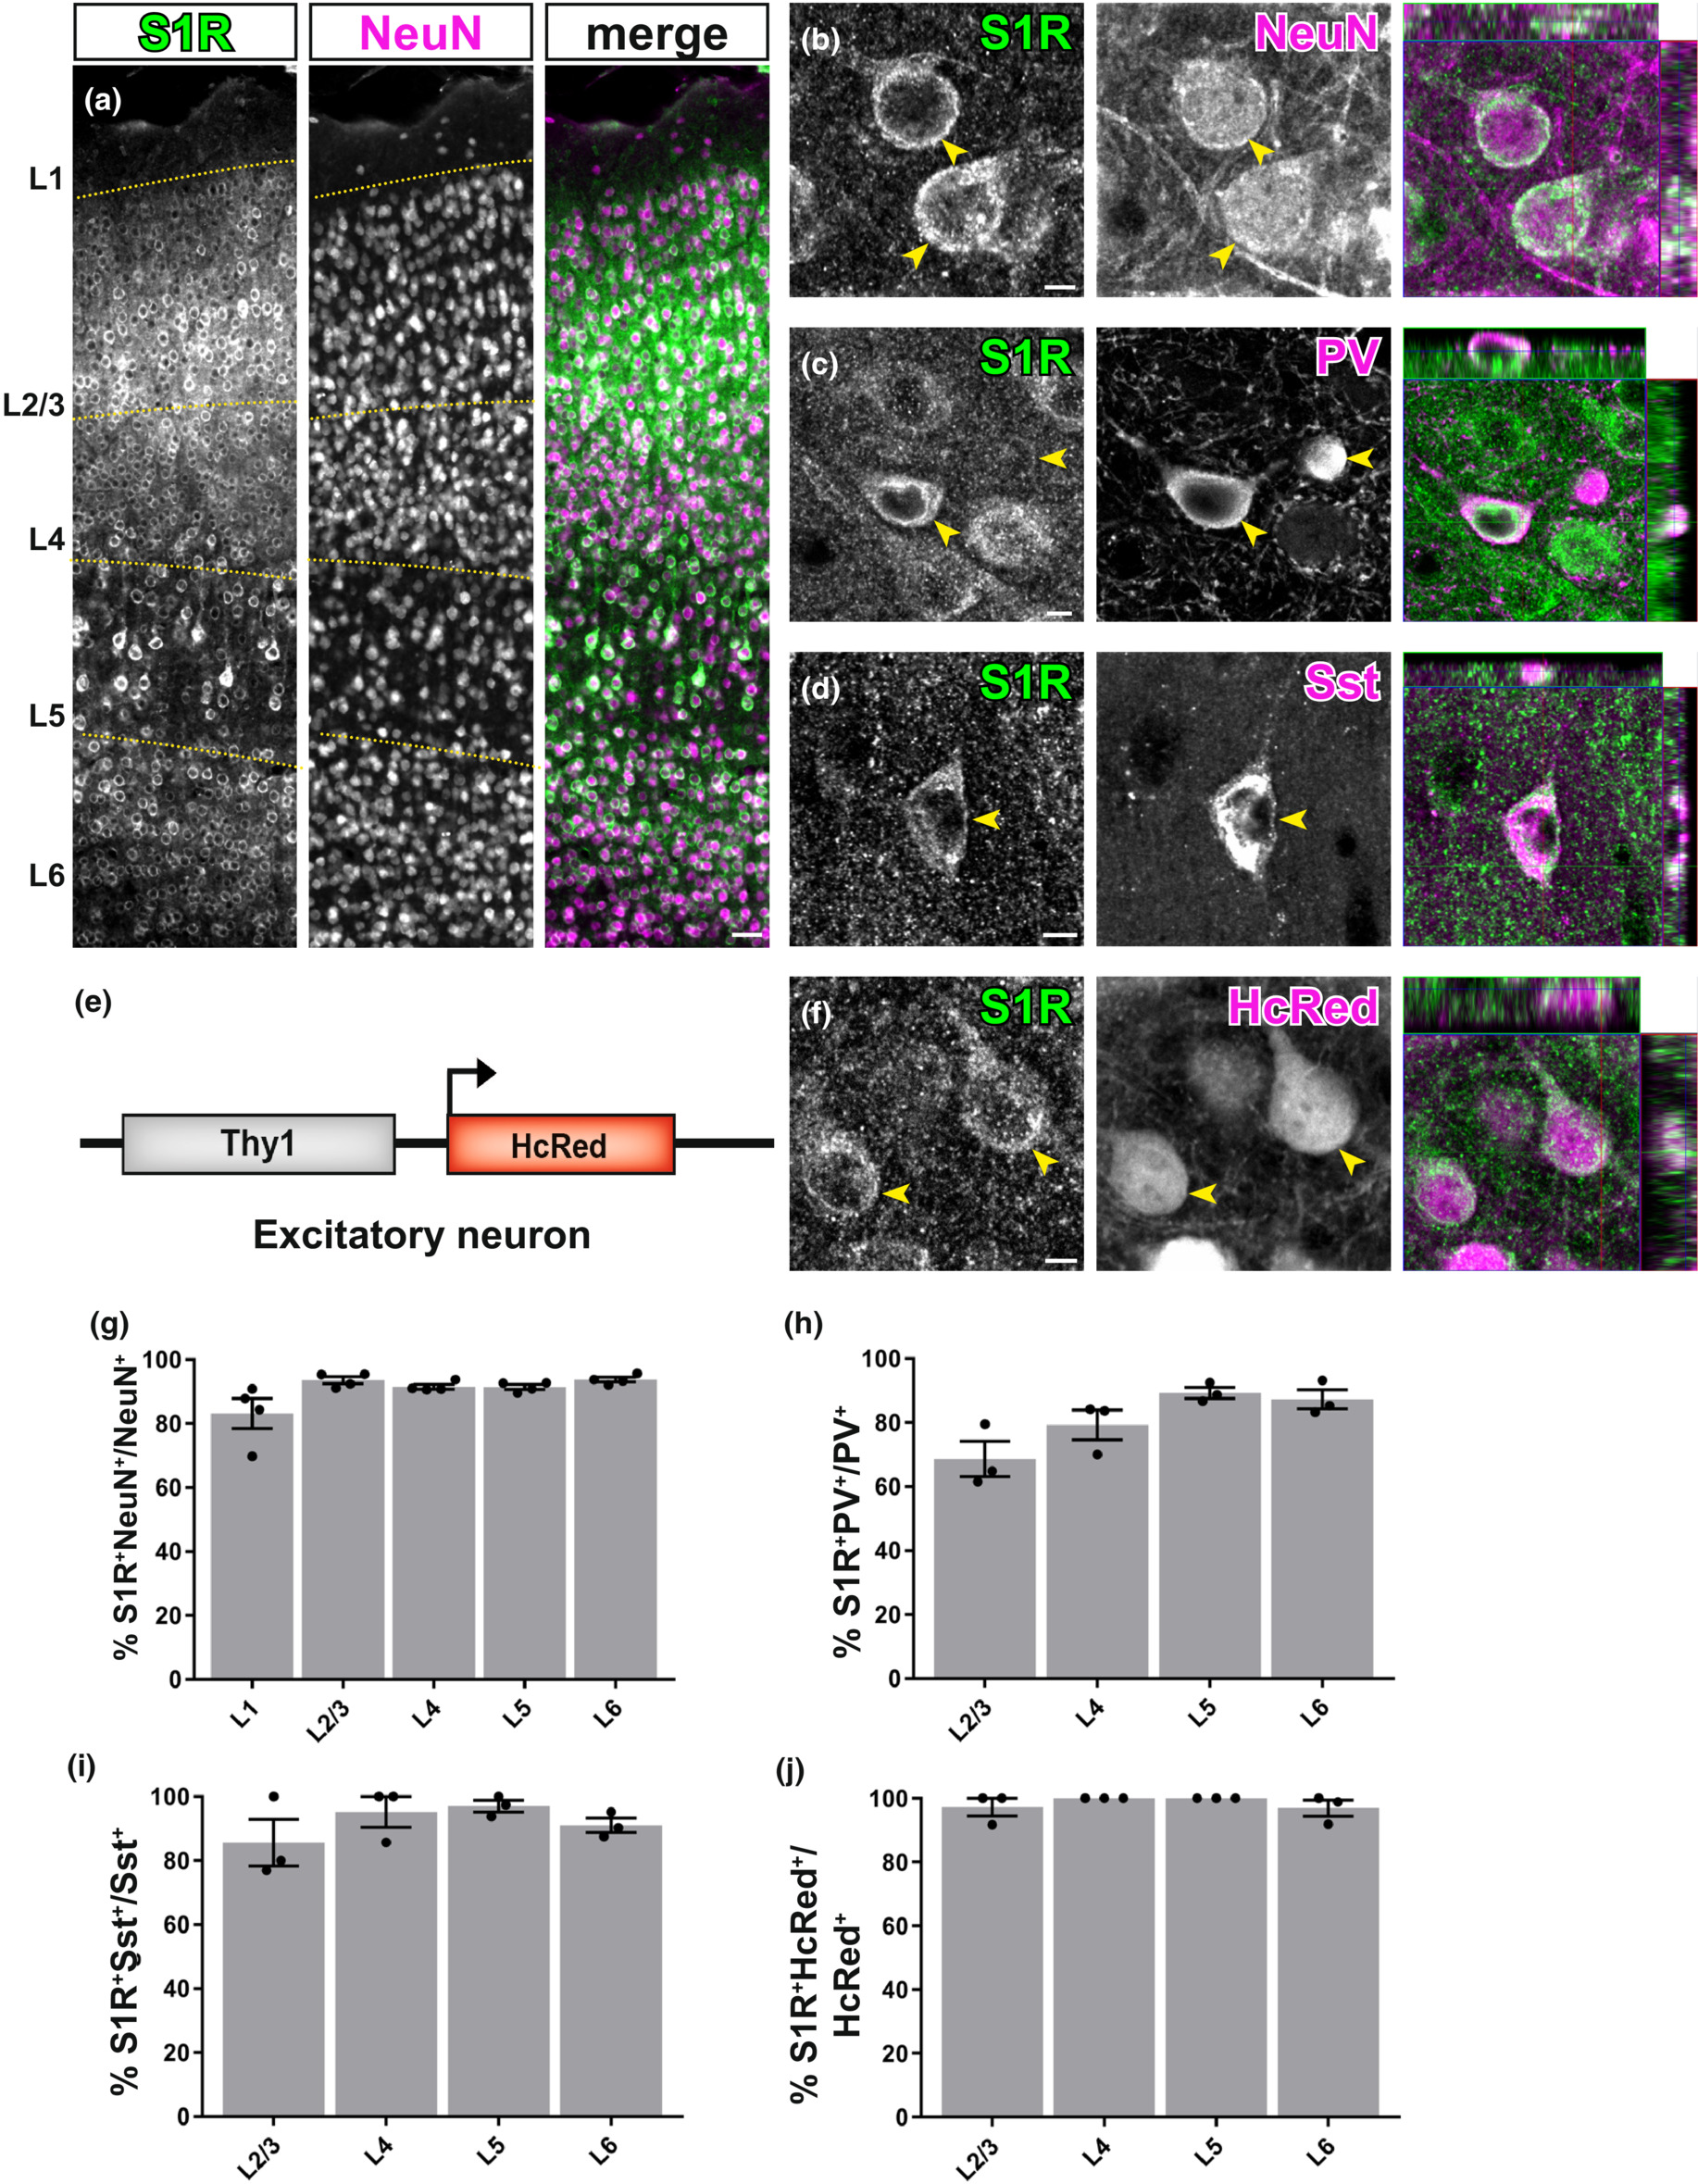
S1Rs are expressed abundantly in neurons. (a) Immunohistochemical detection of S1Rs in NeuN+ cells in different cortical layers (L1-L6). Almost all NeuN+ cells were co-localized with S1R immunolabelling. (b) Confocal images depicting the ring-like structure of S1R immunostaining in NeuN+ cells. (c, d) Detection of S1Rs in Parvalbumin+ (PV, c) and Somatostatin+ (Sst, d) interneurons. (e) Scheme with transgenic mice of Thy1-HcRed which were used to visualize excitatory neurons. (f) Confocal images showing the S1R immunoreactivity in HcRed+ excitatory neurons. The rightmost images of b,c,d,f show the orthogonal views. (g–j) The proportions of S1R+ cells in NeuN+ (g), PV+ (h), Sst+ (i) and HcRed+ (j) neurons from different cortical layers. n = 3 mice. Scale bars = 50 μm in (a), 5 μm in (b,c,d,f).
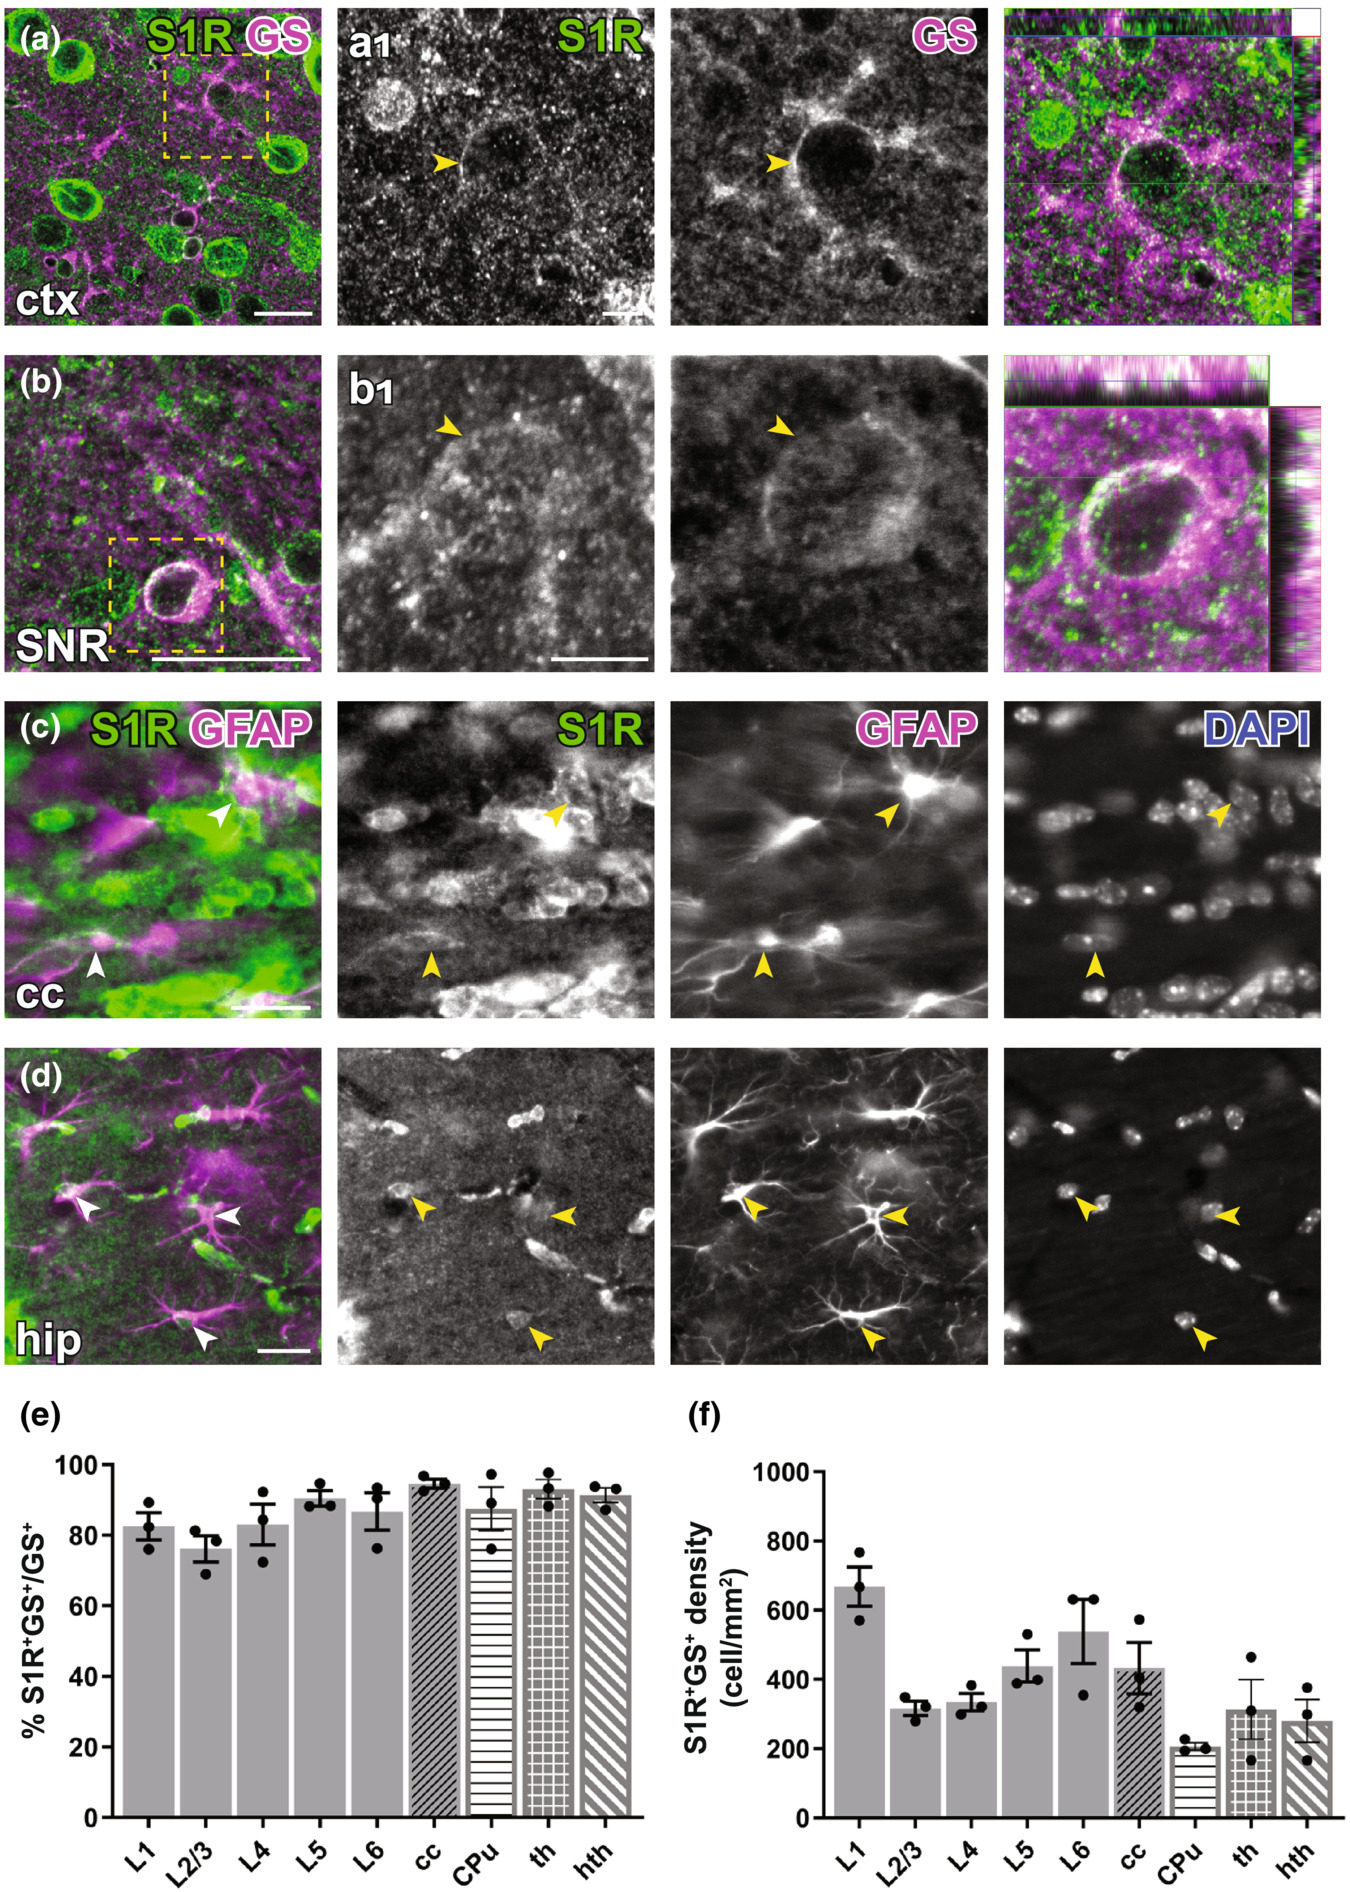
Immunohistochemical detection of S1R expression in forebrain astrocytes. (a, b) S1R immunoreactivities in GS+ astrocytes in ctx (a), substantia nigra (SNR, b). (a1–b1) Magnified images corresponding to boxed areas in (a, b). Arrowhead indicated S1R staining in astrocytes. The orthogonal views are shown in the rightmost pictures. (c, d) Axioscan images showing the ring-like structure of S1R staining in GFAP+ astrocytes in the corpus callosum (cc, c), hippocampus (hip, d). (e, f) Quantification of proportions and densities of GS+ cells expressing S1R+ in different cortical layers (L1-L6), cc, striatum (CPu, caudate putamen), thalamus (th) and hypothalamus (hth). n = 3 mice. Scale bars = 20 μm in (a–d), 5 μm in (a1–b1).
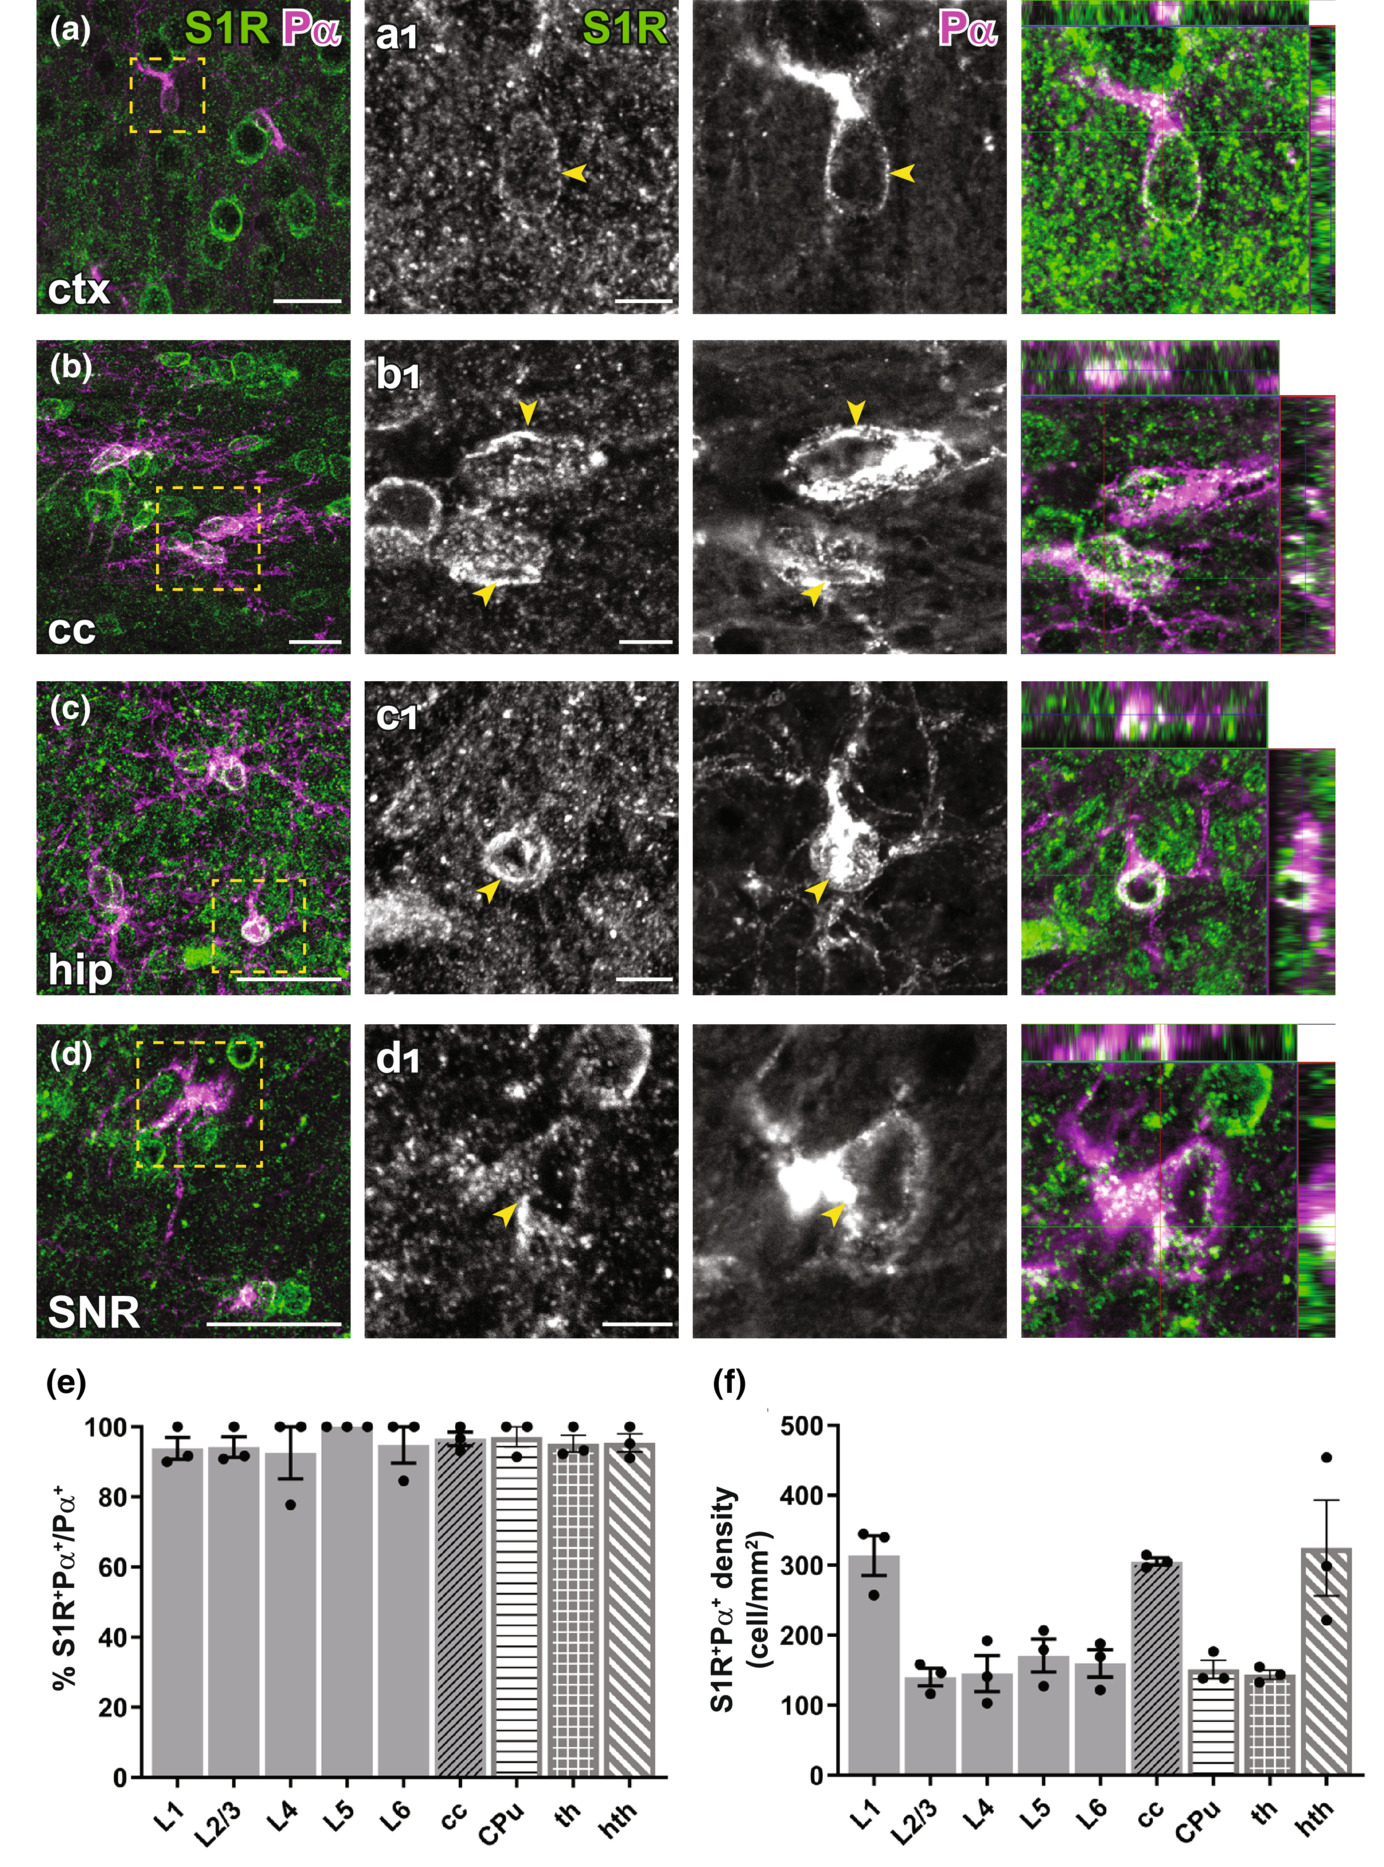
Detection of the S1R expression in OPCs in the forebrain. (a–d) S1R immunostaining co-localized with PDGFRα+ (Pα) OPCs in ctx (a), cc (b), hip (c), SNR (d). (a1–d1) Magnified images showing boxed areas from (a–d). Arrowhead indicated S1R staining in OPCs. The rightmost images indicating the orthogonal views. (e, f) Quantification of proportions (e) and densities (f) of S1R+Pα+cells in different cortical layers (L1-L6), cc, CPu, th and hth. n = 3 mice. Scale bars = 20 μm in (a–d), 5 μm in (a1–d1).
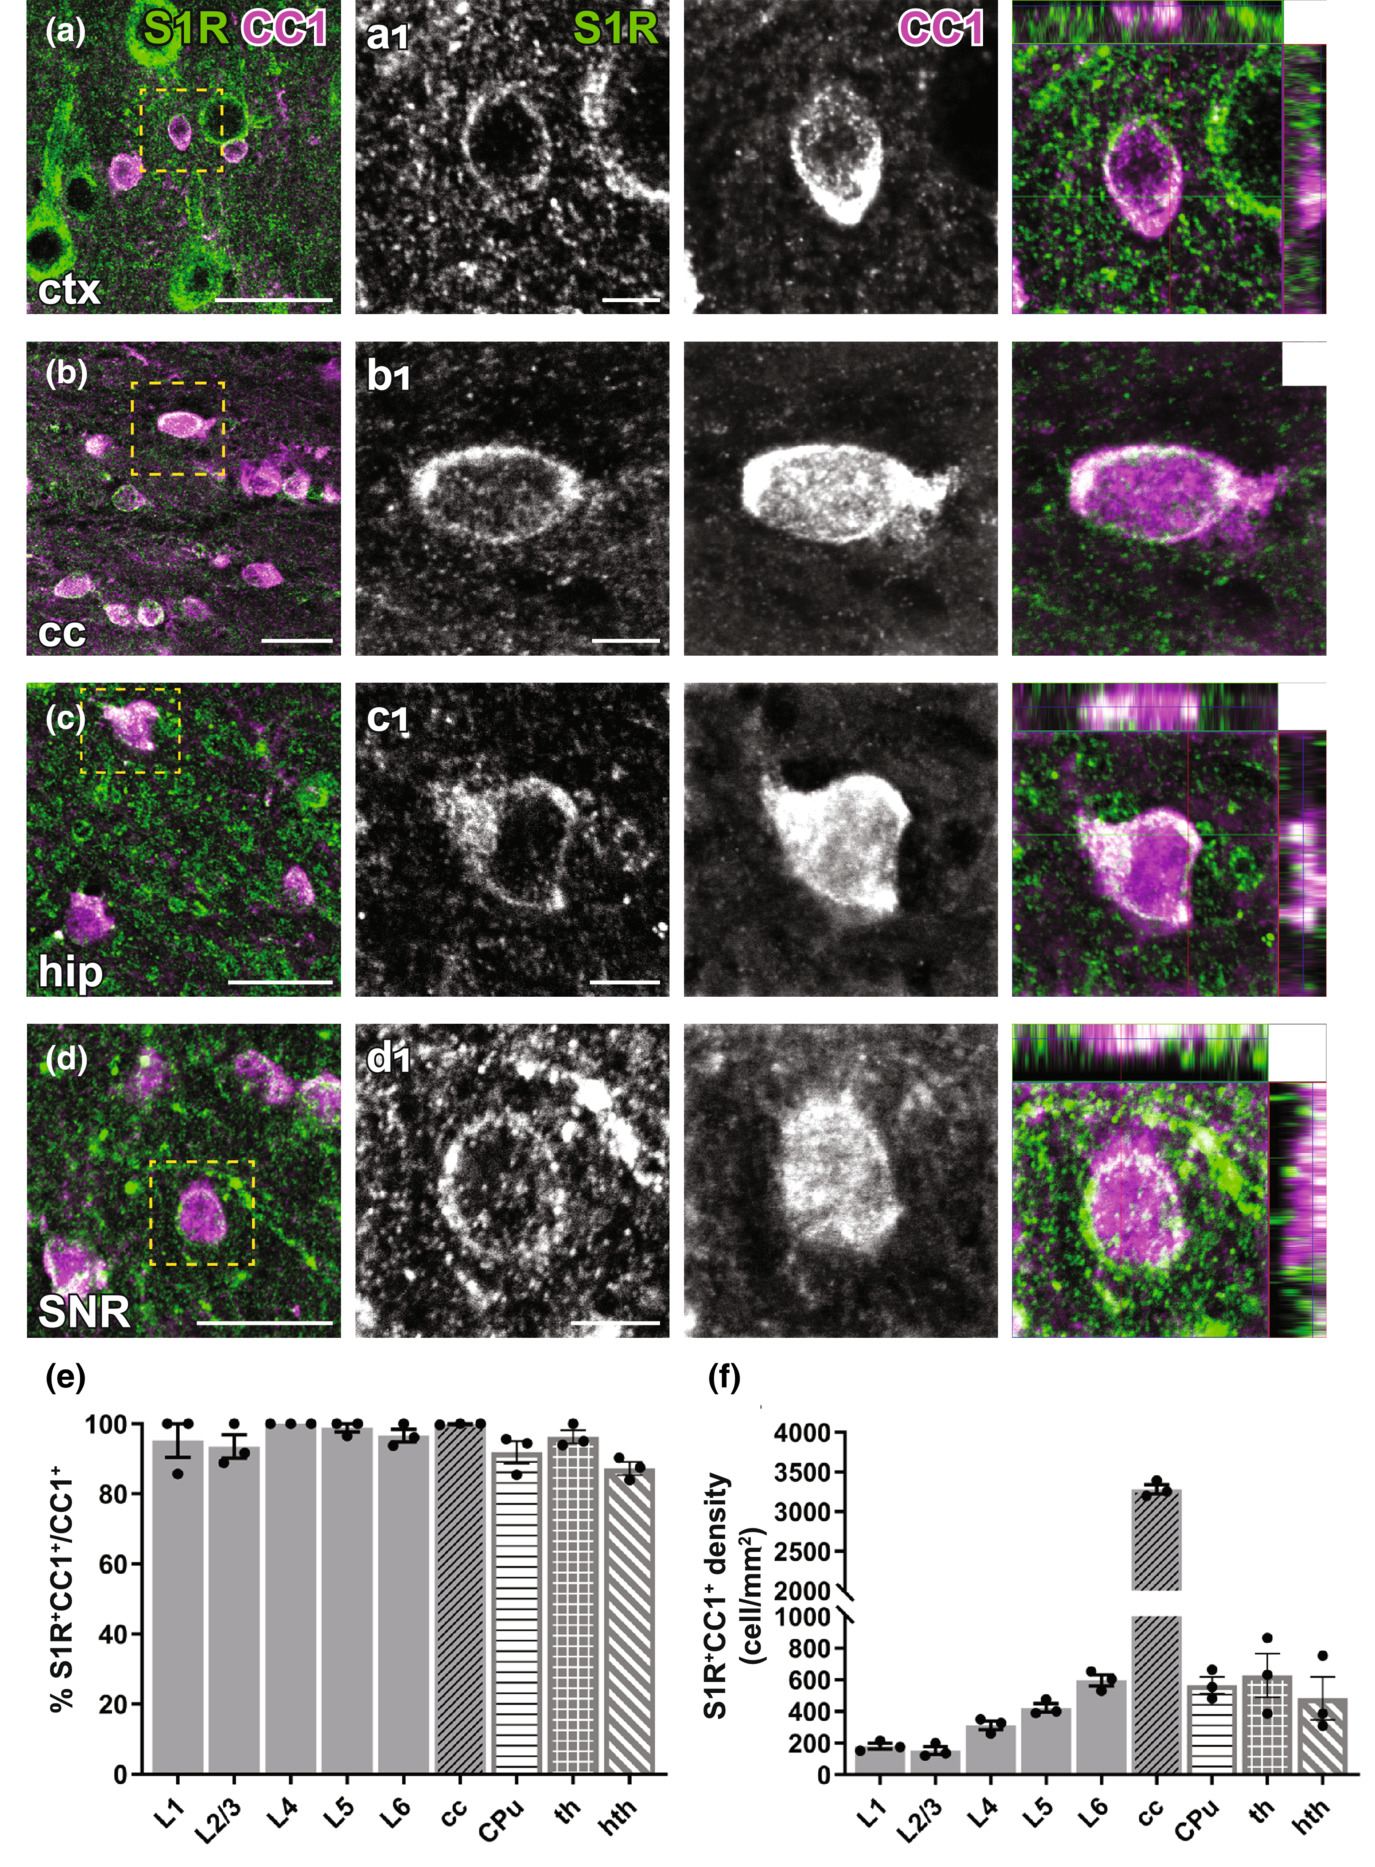
Immunohistochemical detection of S1Rs in forebrain oligodendrocytes. (a–d) S1Rs immunoreactivity in CC1+oligodendrocyte in ctx (a), cc (b), hip (c), SNR (d). (a1–d1) Magnified images correspond to boxed areas in (a–d). Arrowhead indicated S1R immunostaining in oligodendrocyte. The orthogonal views are shown in the rightmost images (e, f) Quantification of proportions (e) and densities (f) of S1R+CC1+ cells in different cortical layers (L1-L6), cc, CPu, th and hth. n = 3 mice. Scale bars = 20 μm in (a–d), 5 μm in (a1–d1).
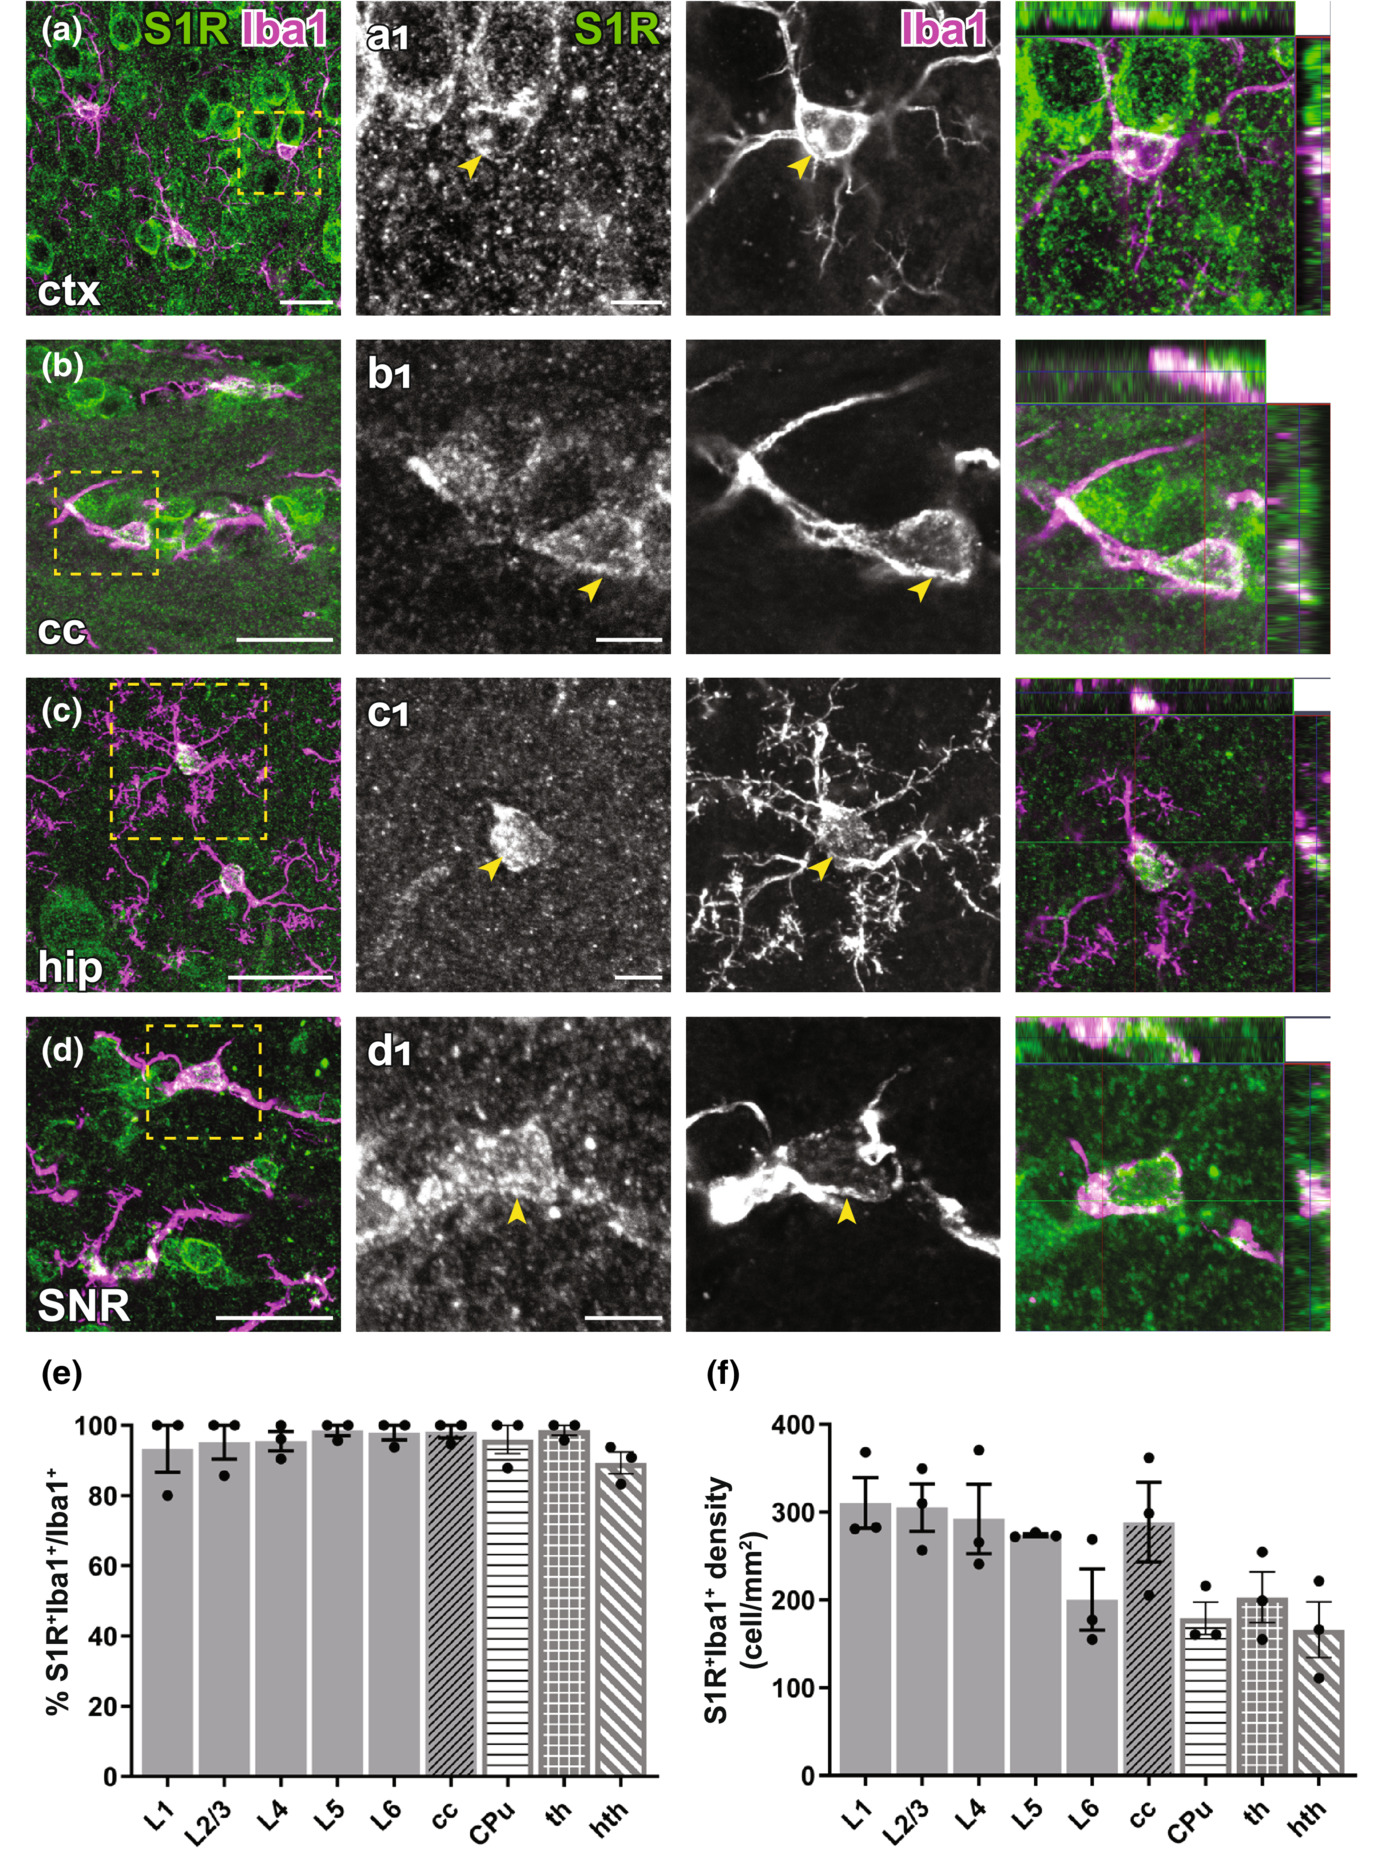
Immunolabelling of S1Rs in microglia in the forebrain. (a–d) S1R immunolabelling colocalized with Iba1 staining in ctx (a), cc (b), hip (c), SNR (d). (a1–d1) Magnified images corresponding to boxed regions in (a–d). Arrowhead indicated overlapping of S1R and Iba1 immunostaining in microglia. The orthogonal images are presented at the rightmost. (e–f) Proportions (e) and densities (f) of S1R+Iba1+cells in different cortical layers (L1-L6), cc, CPu, th and hth. n = 3 mice. Scale bars = 20 μm in (a–d), 5 μm in (a1–d1).
We combined NeuN (a pan-neuronal marker) and S1R immunostaining to evaluate the expression of S1Rs in neurons. We found that throughout the forebrain, the majority of neurons were immunopositive for S1R (Figure 3a,b). For example, in all cortical layers, S1R immunolabelling was found in ~85% of NeuN+ cells in layer 1 (L1) and in more than 90% of NeuN+ cells in L2-6 (Figure 3g). Since NeuN also labelled interneurons in addition to principal excitatory neurons, we further studied the expression of S1Rs in two major interneuron types, i.e. parvalbumin (PV)+ and somatostatin (Sst)+ interneurons (Figure 3c,d). We found still the majority of PV+ or Sst+ interneurons were expressing S1R, however, with different proportions. Specifically, the proportion of PV+ interneurons immunolabelled for S1R was ~70% in L1, ~80% in L2/3 and ~ 90% in L5 and L6 (Figure 3h), while ~90% of Sst+ interneurons showed immunoreactivity of S1R in L2-L6 (Figure 3i). Please note, virtually no PV+ or Sst+cells were found in L1. To determine the S1R expression in excitatory neurons, we performed S1R immunostaining on brain slices from fluorescent transgenic mice in which excitatory neurons were labelled by HcRed expression driven by the Thy1 promoter (Figure 3e,f). In line with the results from NeuN+ cells, virtually all HcRed+ cells were found to be S1R immunopositive across the whole cortex (Figure 3j).
For detection of astrocytes, we used glutamine synthetase (GS) immunostaining. We observed that although the perinuclear ring structure of S1R in GS+ cells appeared thinner than in neurons, still most of GS+ cells in different areas across the forebrain could be immunolabelled for S1R (Figure 4a,b). We found ~80–90% GS+ cells expressing S1R in cortical layers, cc, CPu, thalamus and hypothalamus (Figure 4e,f). Notably, we did not find an S1R staining in astrocytes that mimicked a typical GFAP-containing cytoskeleton well known from anti-GFAP immunostainings in the healthy brain (Figure 4c,d).
To study S1R expression in oligodendrocyte lineage cells, we performed PDGFRα (Pα, an OPC marker) and APC CC1 (an OL marker) immunostainings. With the ARSDS protocol, we were able to detect S1R expression in almost all OPCs (Figure 5) and OLs (Figure 6), both in grey matter (e.g. the cortex) and in white matter (e.g. the cc) as well as in other studied ventral brain areas. To our knowledge, this is the first time that S1R expression has been observed in OPCs by immunolabelling.
To study the microglial expression of S1Rs, we combined Iba1 (a microglia marker) and S1R immunostaining. Like other glial cells, the majority of Iba1+ cells were immunolabelled for S1R in all regions of the forebrain (Figure 7a-d). Quantification results even suggested that virtually all Iba1+ cells were co-expressing S1Rs, at least in the cortex, cc, CPu, thalamus and hypothalamus (Figure 7e-f).
The specific S1R immunolabelling allowed us to compare relative expression levels of the S1R in different CNS cell types in defined regions in situ, for example, a comparison of individual cellular S1R expressions in deep cortical layers (Figure S10). Taken together, we were able to demonstrate that unlike previous scRNA sequencing results (Figure S9) the majority of neurons and all types of glial cells express S1R proteins with variable levels.
3.4 S1Rs are widely expressed in the cerebellum and spinal cord
The ARSDS protocol for S1Rs also generated specific immunolabelling of S1Rs in the cerebellum (Figure 8a,b). We observed high expression in cell bodies and neurites of Purkinje neurons (confirmed by Calbindin staining) (Figure 8c). Further investigations with other cell type markers revealed that S1Rs were widely expressed in astrocytes including Bergmann glia (S100B+), microglia (Iba1+), OPCs (Pα+) and OLs (CC1+) in the cerebellum (Figure 8d-g).

The expression of S1Rs in the cerebellum. (a, b) Sagittal sections of cerebellum were stained for S1R using the ARSDS protocol. Specific immunostaining of S1Rs in WT cerebellum (a) is absent in S1R KO mouse (b). (a1, b1) Magnified views showing the molecular layer in the indicated regions of a and b. (c–g) Cerebellar slices were double-immunostained for S1Rs, calbindin+ (calb) (c), S100B+ (d), Iba1+ (e), Pα+(f) and CC1+(g) respectively. (c1–g1) The enlarged images of boxed area in (c–g). Scale bars = 200 μm in (a, b), 20 μm in a1, b1, c-g and 5 μm in (c1–g1).
Previous studies using AbRuoho showed that high expression of S1R in motor neurons of the spinal ventral horn, however, the S1R expression in other cell types had not been mentioned. In the current work, we first tested the performance of the ARSDS protocol for S1Rs in the spinal cord (Figure S11A). We observed high expression of S1Rs in the ventral horn of WT mice, but with a strong background. Moreover, unspecific staining by the ARSDSprotocol could also be observed in the KO mice, preferentially in white matter myelin structures. Considering delipidation of myelin is widely used to decrease background for the detection of myelin proteins (Ishii, Fyffe-Maricich, Furusho, Miller, & Bansal, 2012; Jahn, Tenzer, & Werner, 2009), we tested a pre-treatment of spinal slices with 100% ethanol overnight (more than 16 h), followed by 1% SDS treatment. This modified protocol (AREtOH-SDS, i.e., 100% ethanol +1% SDS + Ab#61994; Figure 2a), largely reduced the background staining both in WT and KO mice (Figure S11B). Therefore, we performed co-immunostaining for S1Rs and glial markers with the AREtOH-SDS protocol on spinal sections. We found that virtually all neurons in the spinal cord, though with even higher level in the ventral horn, were expressing S1Rs (Figure S11C,D). Regarding the still relatively higher immunostaining background in the spinal cord compared to the brain, we quantified S1R immunopositive cells in WT and KO spinal cords. We found that more than 90% of all types of glial cells either in the spinal grey matter or white matter of WT mice were immunolabelled for S1R, whereas this proportion was no more than 5% in the KO mice (Figure S12 and S13). Therefore, this AREtOH-SDS protocol still could be used to specifically detect S1R-expressing cells in the spinal cord. However, for yet unknown reasons, the myelin-like staining could still be seen in both groups of mice with the AREtOH-SDS protocol. To further investigate the unspecifically stained components, we combined myelin basic protein (MBP, a myelin marker) and S1R immunostaining. The unspecific S1R immunolabelling did not fully overlap with MBP staining, but appeared to be in the inner layers of myelin sheaths (Figure S11E,F). Thereby, this protocol is not suitable to study S1R expression in myelin in the spinal cord. More efforts are required to improve the AR of spinal slices for S1R immunostaining. Nevertheless, the current results from the AREtOH-SDS protocol demonstrated that the majority of neurons and glial cells in the spinal cord express S1Rs.
3.5 Detection of S1Rs in the injured brain by immunohistochemistry
It has been suggested that S1R plays important role in the injured brain. However, the S1R expression pattern under neuropathology was not yet clear because of the lack of a reliable immunodetection method. Therefore, we evaluated the performance of the newly established S1R immunolabelling ARSDS protocol working on brains with acute brain injuries. We performed cortical stab wound injuries (SWI) to adult mice which were analysed at 3 and 7 days post-injury (dpi). The IHC results showed that S1Rs in the (peri-) injured area were still well detected by the current protocol. We observed that the S1R expression level in the ipsilateral cortex did not show overt difference compared to the contralateral side, although the core injury area showed reduced S1R expression possibly because of loss of neurons (contra, Figure 9a,a1; ipsi, Figure 9a,a2) at 3 dpi which partially recovered with the wound healing at 7 dpi (Figure 9b,c). Moreover, S1Rs were also detected in activated microglia, astrocytes and OPCs in the injury-affected region (Figure 9d-f). Of note, we still did not find S1R immunostaining colocalized with GFAP in the main processes of astrocytes (Figure 9d,d1). Compared to resting microglia in healthy brain, activated microglia showed stronger S1R expression, though its biological meaning remains to be elucidated (Figure 9e,e1).
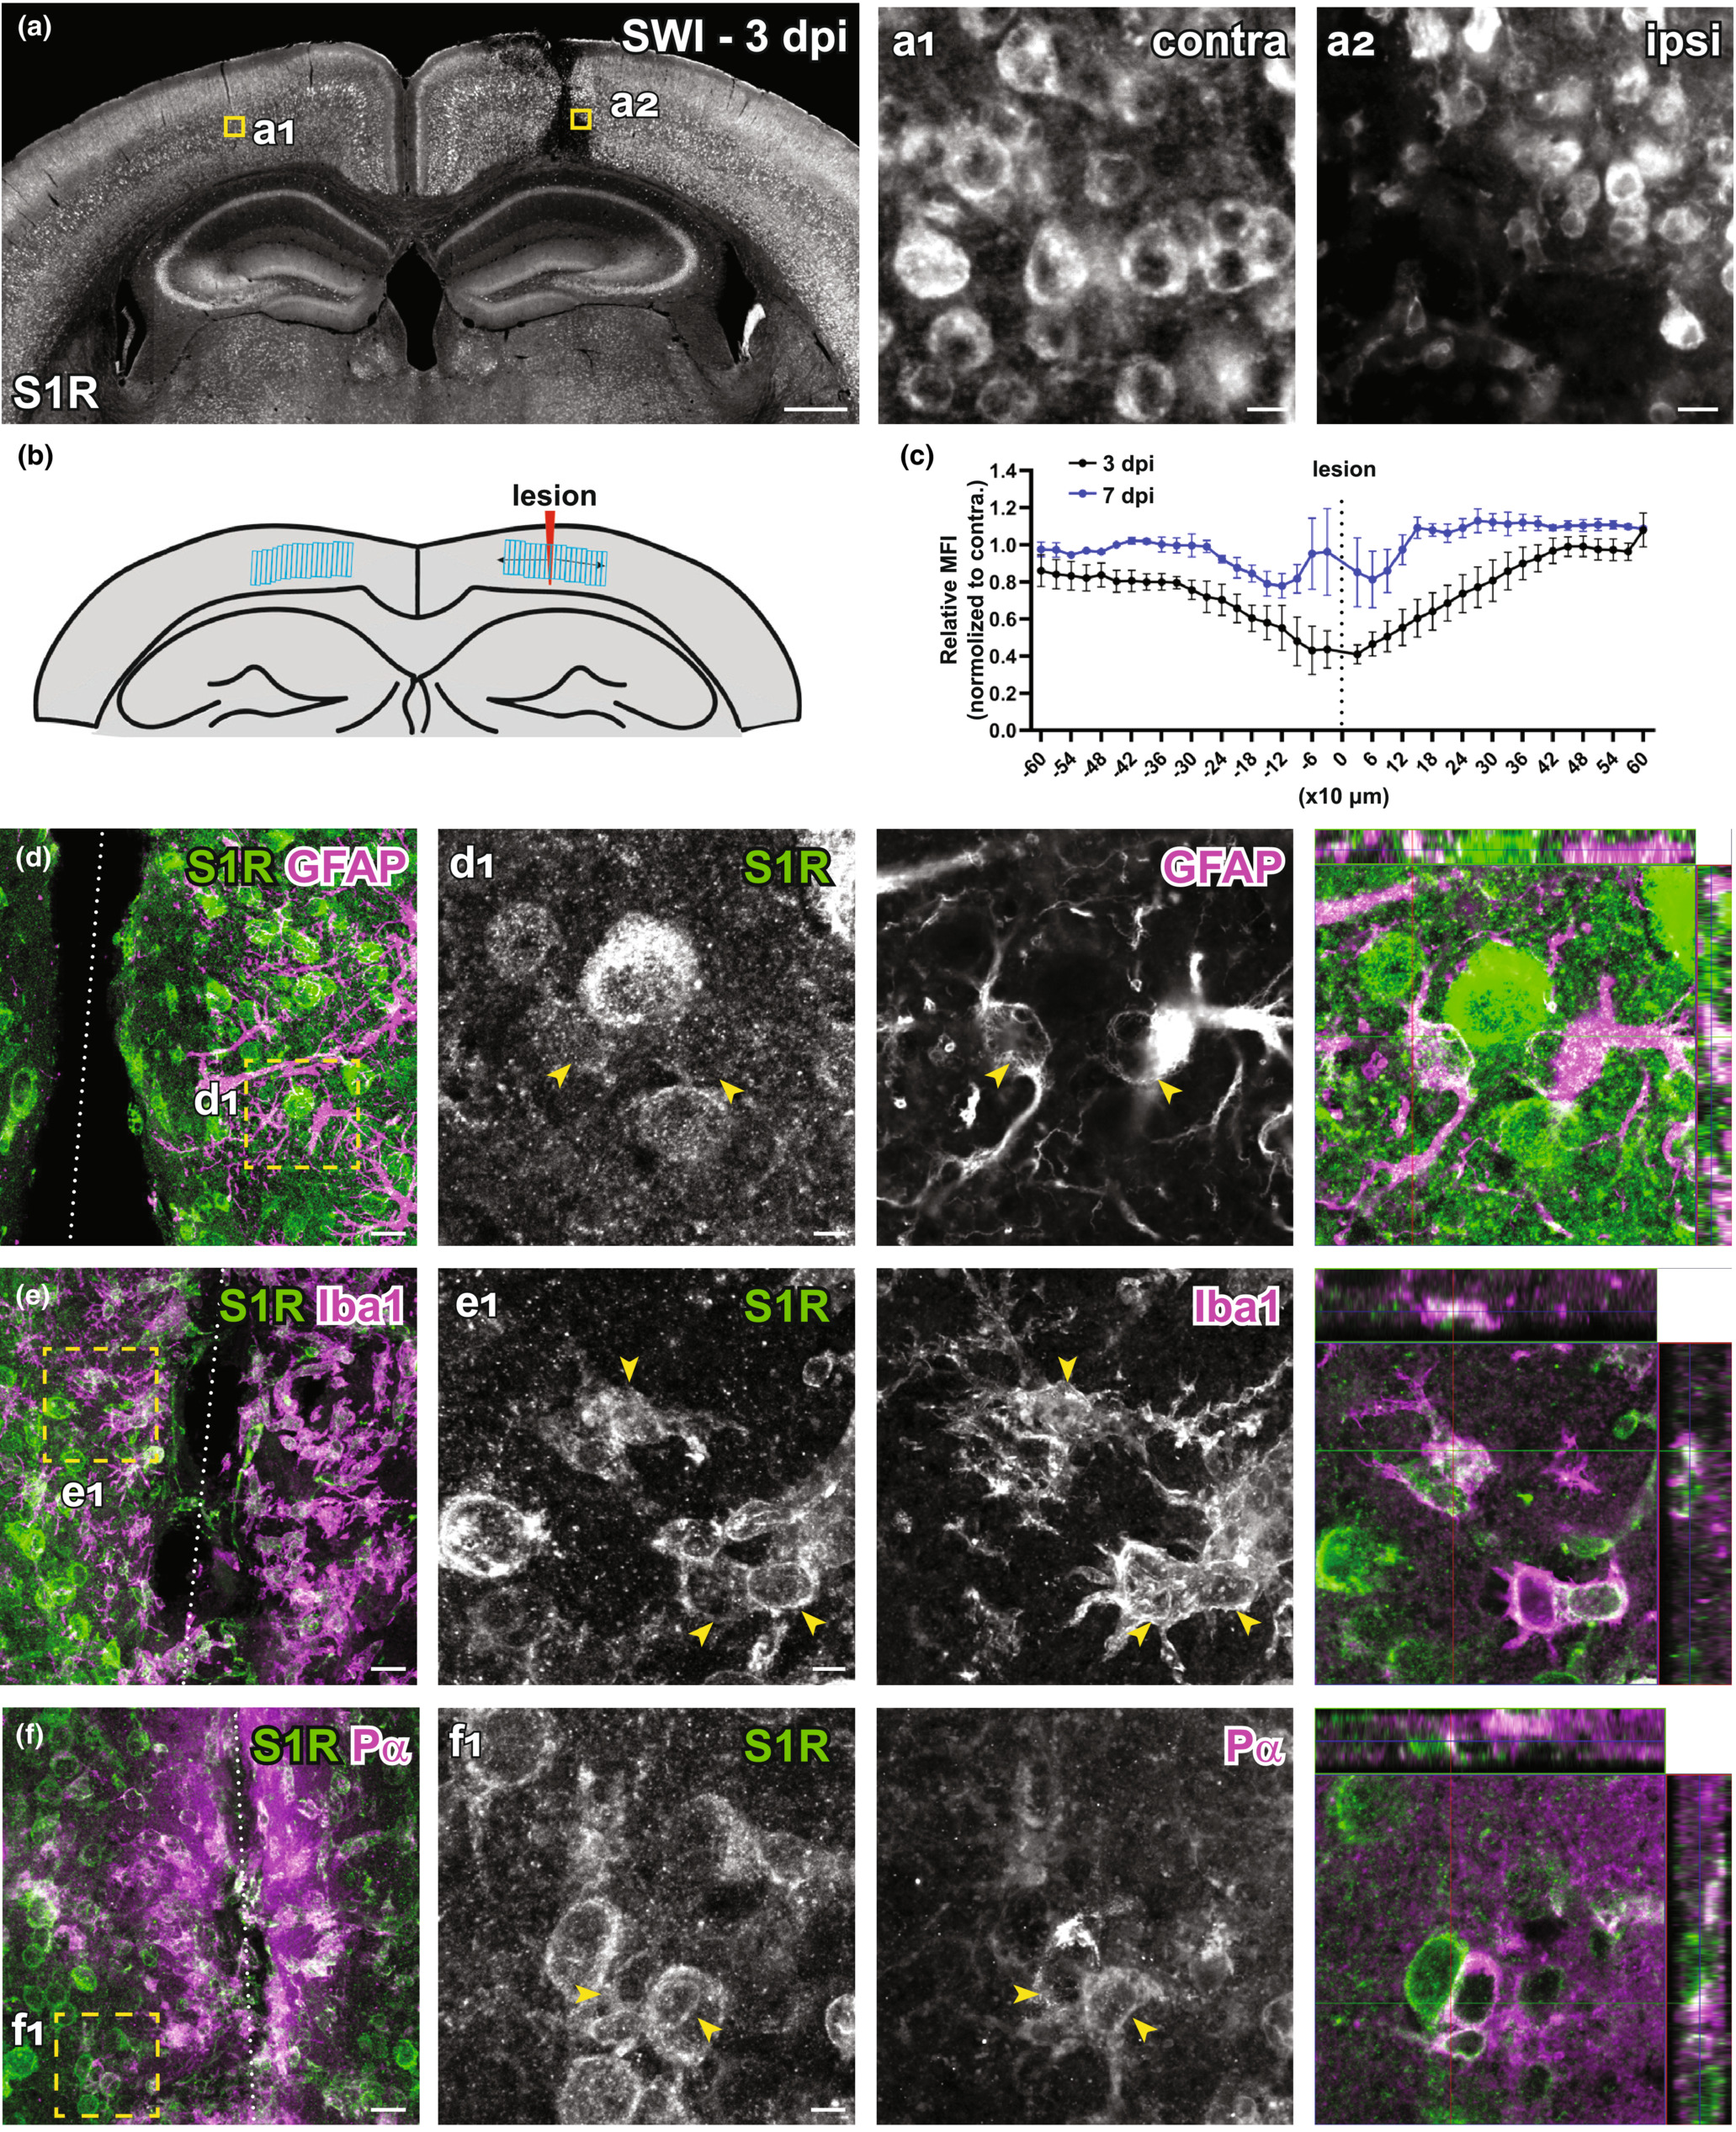
Immunolabelling of S1Rs in the injured brain. (a) Overview of S1R immunostaining at 3 days post stab wound injury (3dpi). Ring-like structures of S1Rs in the contralateral (contra, a1) and ipsilateral (ipsi, a2) sides as indicated by the yellow boxes in a. (b) Schematic diagram showing the analysed area defined by LRoi. Regions of Interest (ROIs) were created perpendicular to the lesion. The lesion was chosen as the ROI 0 to be in the centre of all ROIs. Corresponding ROIs were created on the contralateral side. Distances of ROIs to the lesion site (defined as 0) were shown in x-axis. (c) Relative mean fluorescence intensity (MFI) of S1R immunostaining in ROIs from the injured side (ipsi) normalized to contralateral side at 3 and 7 dpi respectively. (d–f) Injured brain sections were co-immunostained for S1Rs with various glial markers (GFAP, Iba1 and Pα). (d1–f1) The boxed areas in d–f are magnified. Activated astrocytes (GFAP+), microglia (Iba1+) and OPCs (Pα+) at the lesion site were expressing S1Rs enriched in the cell body. Scale bars = 500 μm in a, 10 μm in a1-a2, 20 μm in d–f and 5 μm in d1–f1.
3.6 Conditional deletion of S1Rs in the CNS in vivo
The newly established IHC protocol detecting S1Rs specifically enabled us to show that S1Rs are widely expressed in neurons and glial cells in the CNS. Therefore, the conditional knockout of S1Rs in cell types of interest in vivo would be a valuable tool to study S1R functions in the CNS. To achieve this goal, we generated a S1R flox mouse in which the exons 1–3 of Sigmar1 are flanked by loxP sites (Figure S14). To test whether S1Rs could be specifically deleted in neurons in vivo, we crossed S1R flox mice to NEX-Cre knockin mice in which principal neurons express Cre to generate neuronal S1R cKO mice (NEX-Cre × S1Rfl/fl) (Figure 10a). Control mice (NEXwt/wt × S1Rfl/fl) and cKO mice were analysed at 10 w. We were able to show that S1R expression was drastically reduced in pyramidal neurons in the expected brain regions such as neocortex and hippocampus (Figure 10b,c). Quantification of S1R-expressing NeuN+ cells in the dorsal cortex confirmed that either in proportion (~96% in ctrl, ~5% in cKO) or in density (2900 cells/mm2 in ctrl, 156 cells/mm2 in cKO) S1R expression was largely ablated in NeuN+ cells in the neuronal S1R cKO mice (t = 142.7, df = 4, p-value < 0.0001 in d and t = 23.65, df = 4, p-value < 0.0001 in e) (Figure 10d,e).
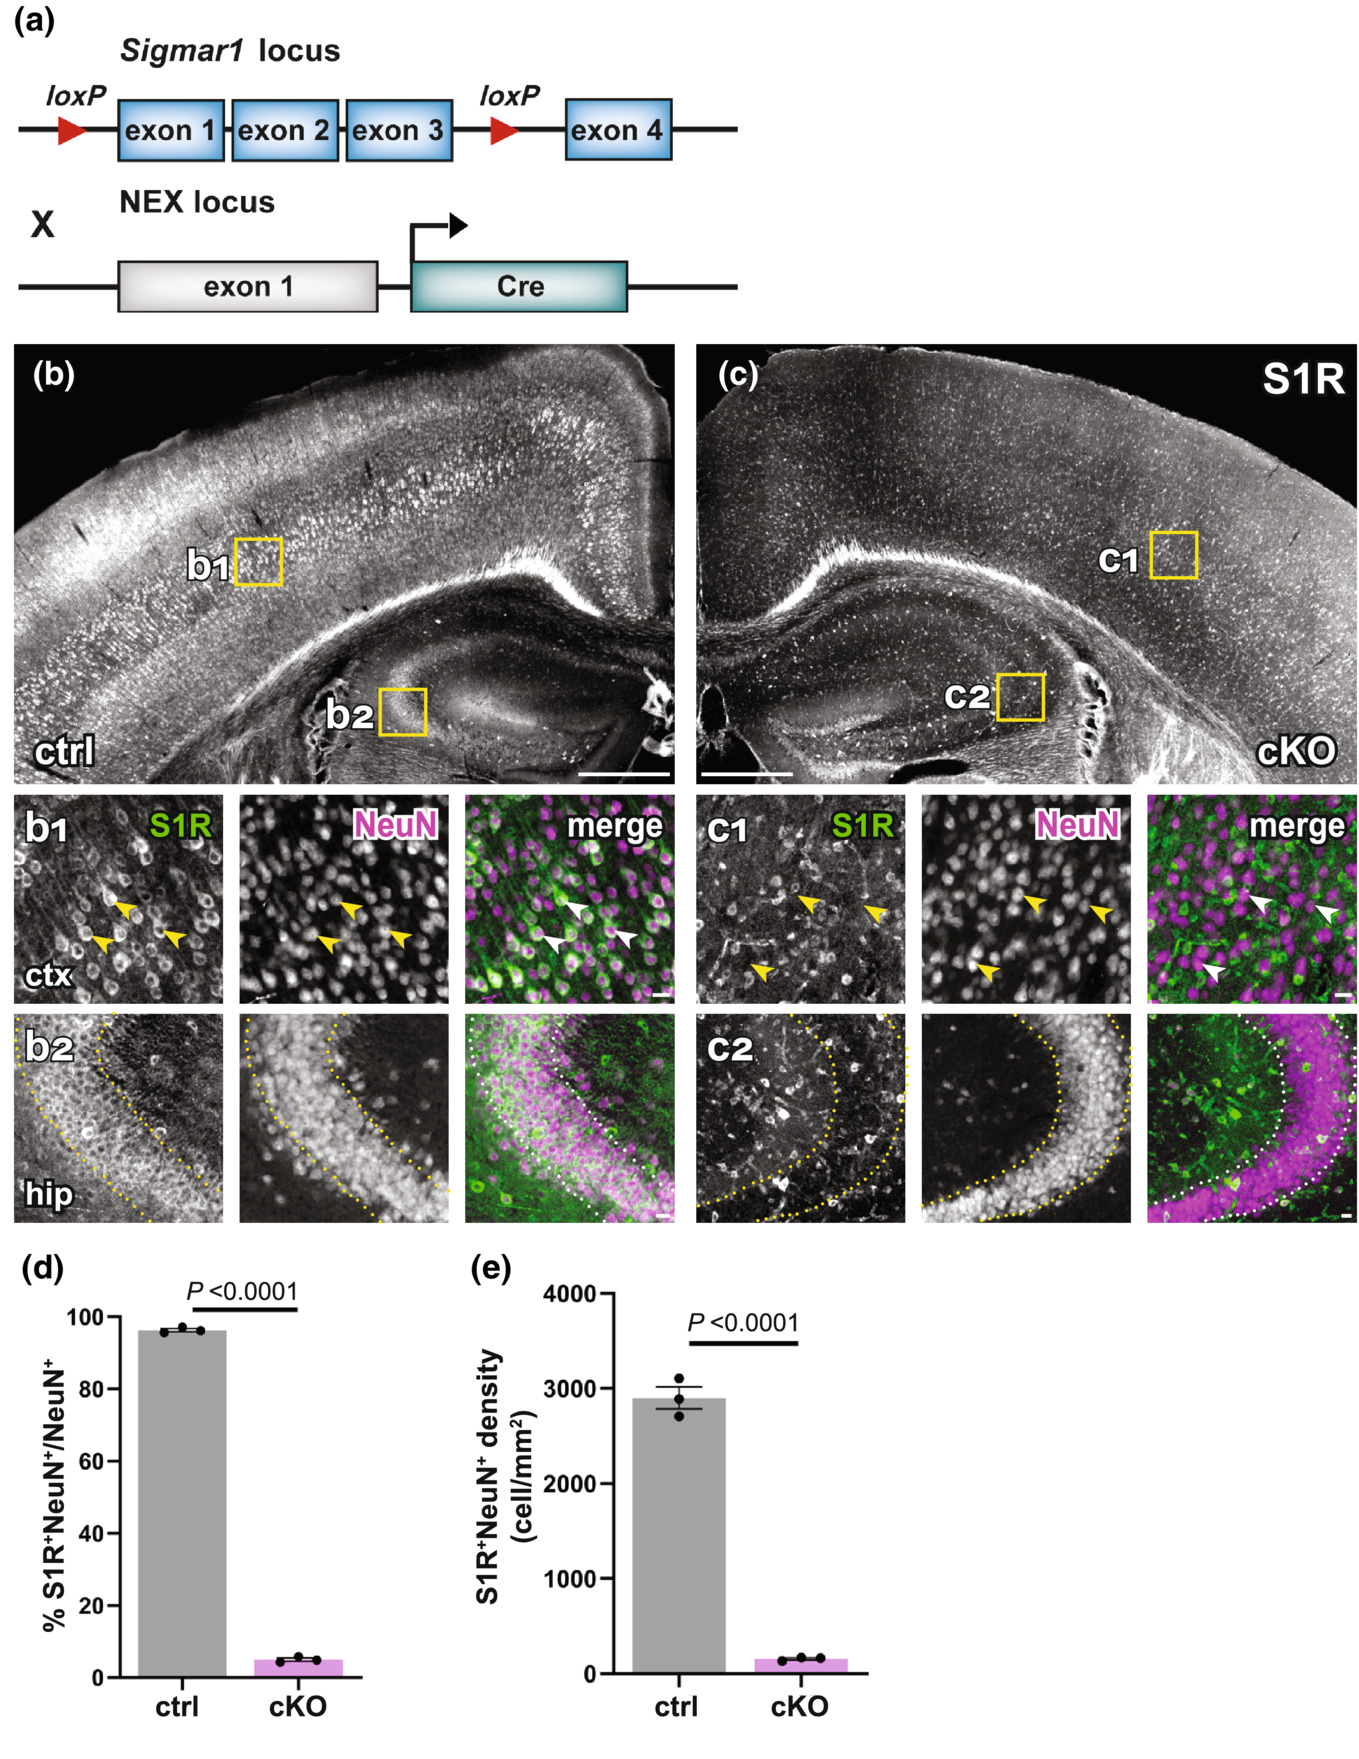
Successful knockout of S1Rs in principal neurons within the neocortex and hippocampus. (a) Scheme with transgenic structures of NEX-Cre x S1Rfl/fl mice used to delete S1Rs in principal neurons. (b, c) Overviews of S1R immunostaining in the dorsal brain of control (ctrl, b) and cKO (c) mice. (b1, b2, c1, c2) Magnified views (yellow boxes in b and c). Arrowheads indicate reduced S1R expression in cortical NeuN+ cells in cKO (c1) compared with ctrl (b1). Dotted lines indicate reduced expression of S1Rs in pyramidal neurons in the hippocampal CA2 region of cKO (c2) compared with ctrl (b2) mice. (d–e) Histograms highlighting decreased proportion and density of S1R+ cells in NeuN+ cells in cKO mice. n = 3 mice per group. Scale bars = 500 μm in (b, c), 50 μm in b1-b2, c1-c2.
To evaluate the temporally controlled deletion of S1Rs in targeted cell types of S1R flox mice, we crossbred S1R flox mice to CX3CR1-CreERT2 mice (CXCTct2/wt x S1Rfl/fl) to generate microglia-specific S1R cKO mice (Figure 11a). These mice were injected with tamoxifen at 4 w and analysed at 3 or 6 w post-injection (wpi) (Figure 11b). Upon quantification of the immunostaining for Iba1 and S1R, we observed that in the dorsal cortex of cKO mice the proportion of Iba1+ microglia co-expressing S1R was reduced to 34.8 ± 2.9% at 3 wpi compared to ctrl (96.4 ± 3.2%). This level did not further decrease at 6 wpi (29 ± 6%) (F[2, 6] = 76.61, p-value < 0.0001) (Figure 11c-f). Thereby, we conclude that in adult mice the microglial S1R expression can be largely deleted within 3 weeks upon Cre induction.
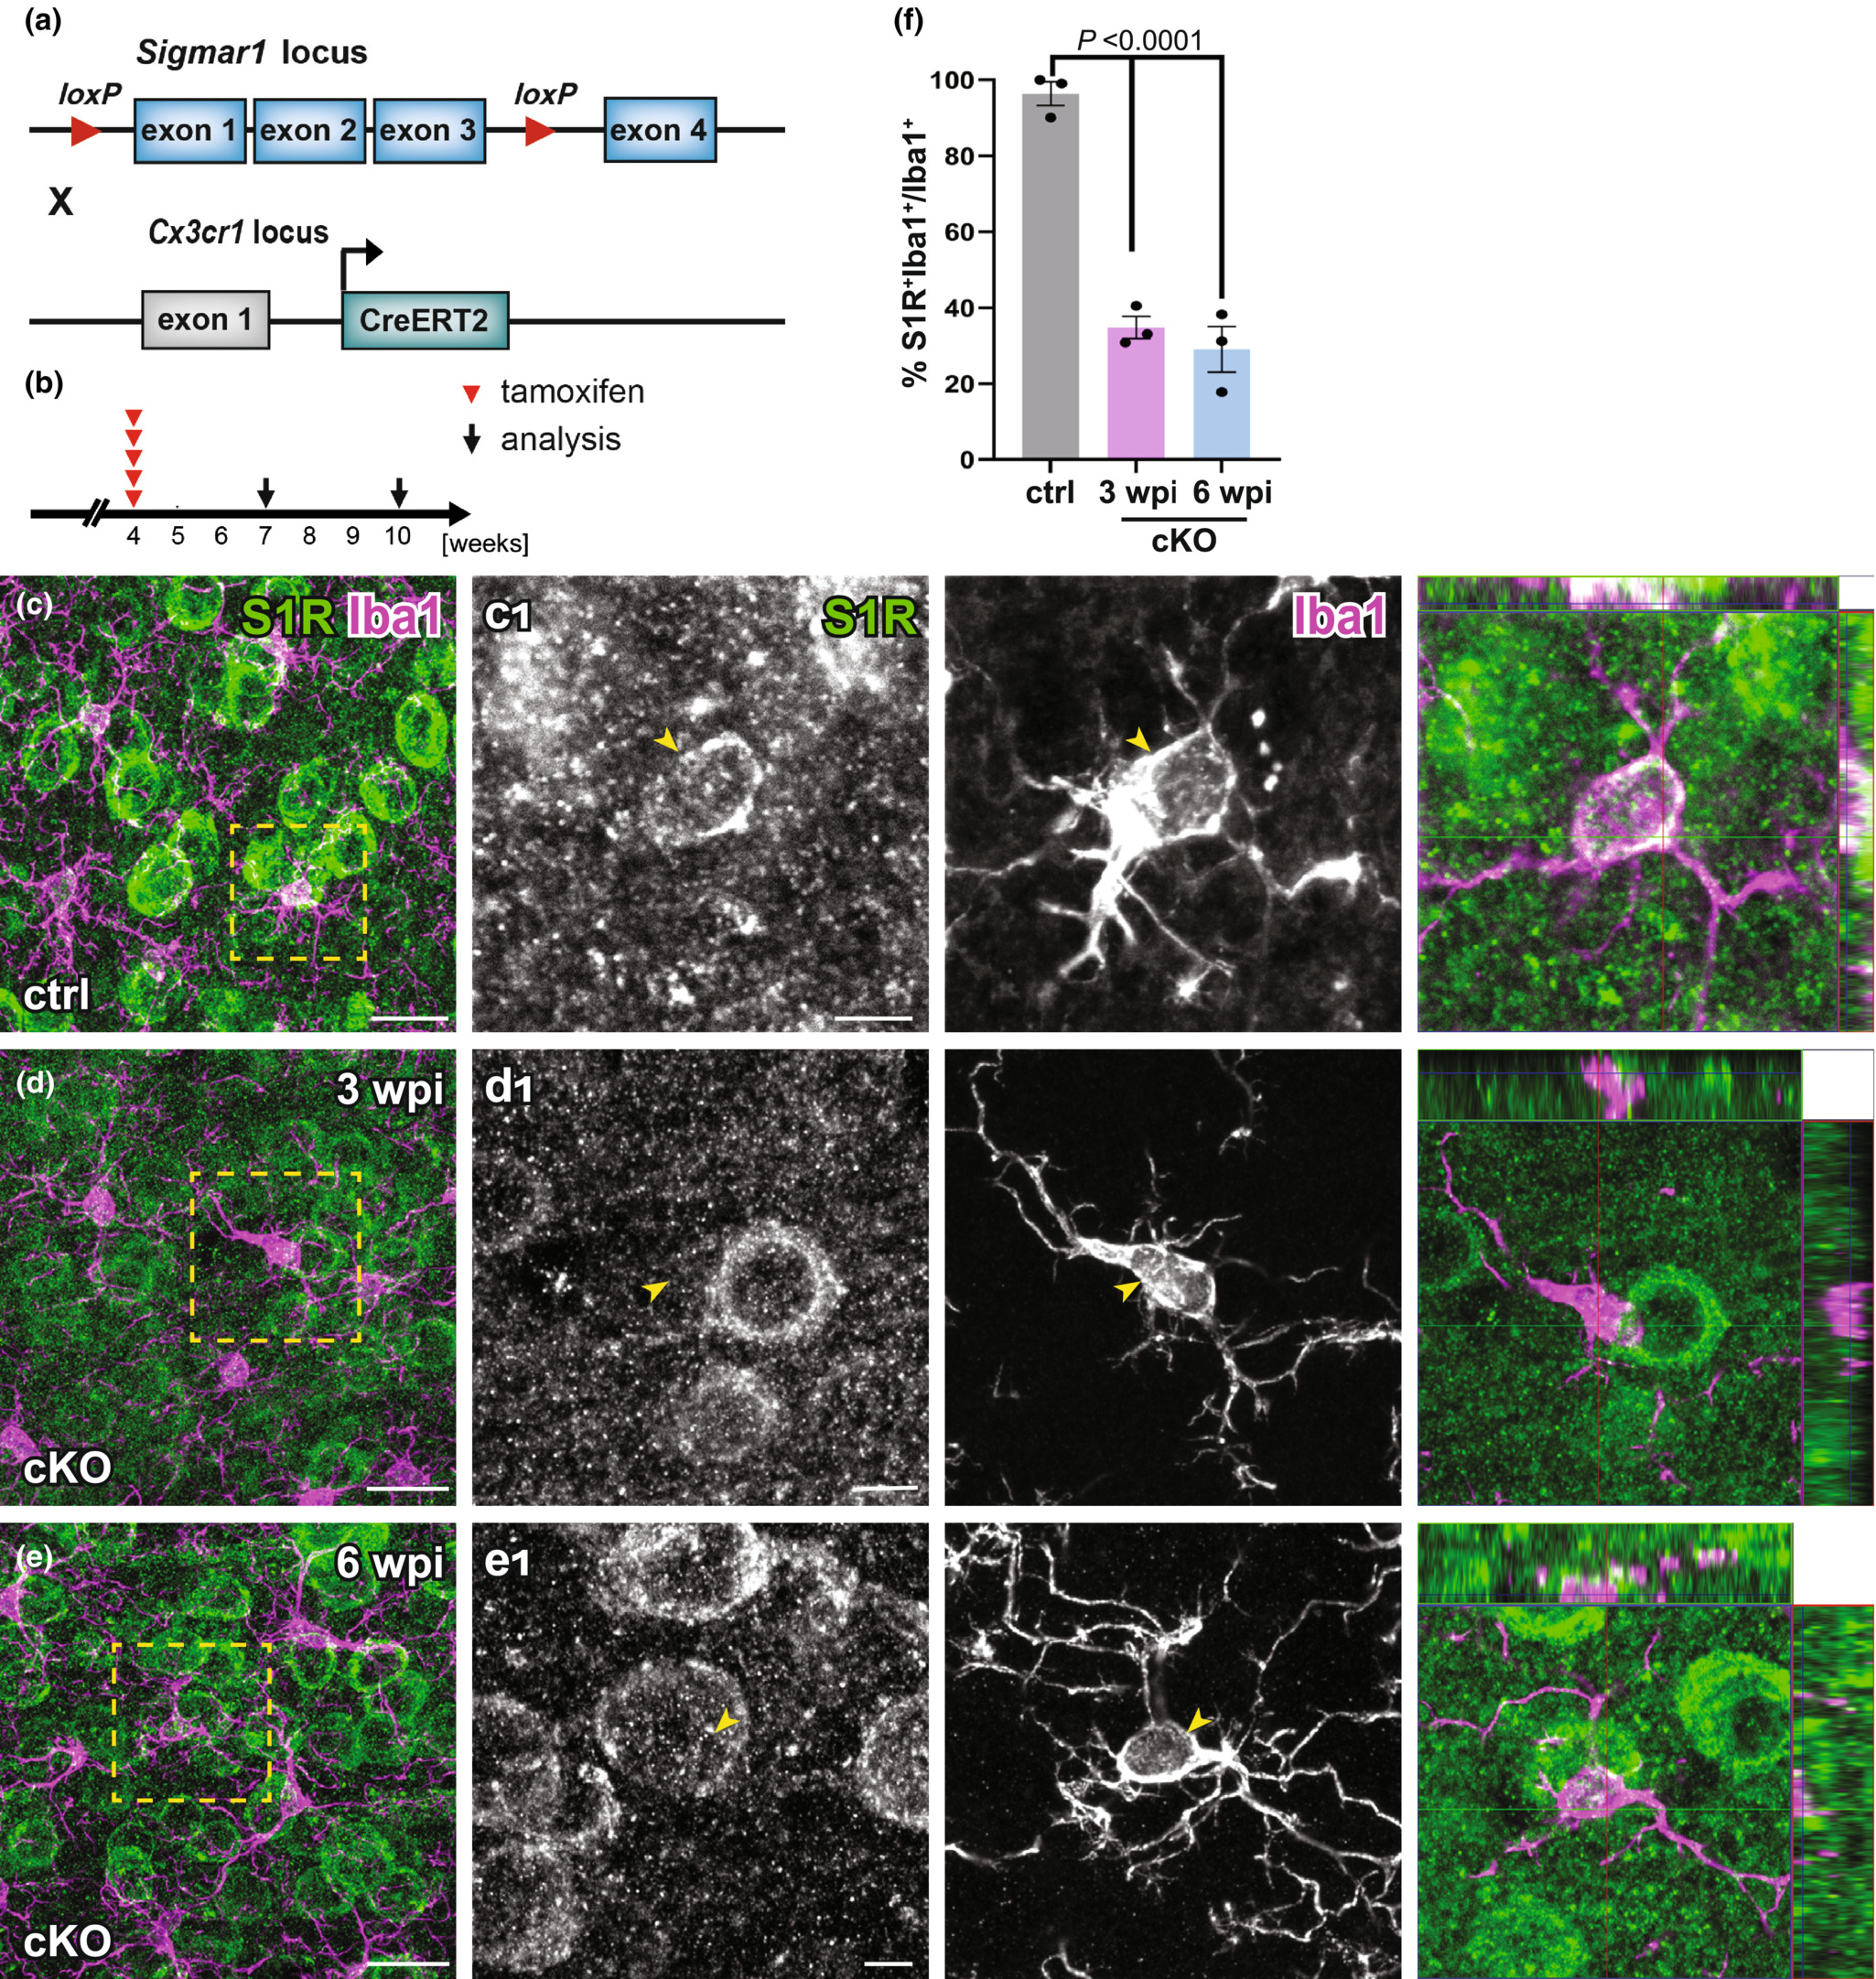
Successful deletion of S1Rs in microglia. (a) Schematic representation of double transgenic mice CX3CR1-CreERT2 x S1Rfl/fl used to conditionally delete S1Rs in microglia. (b) Experimental plan. All mice were injected with tamoxifen at 4 w. Immunostaining of S1Rs was performed at 3 w (3 wpi) or 6 w (6 wpi) post the first tamoxifen injection. (c–e) Double-staining of S1R and Iba1 in ctrl (c) and cKO (d–e) mice. (c1–e1) The boxed regions from c–e are magnified. The orthogonal views of S1R and Iba1 immunolabelling are presented in the images at the right (f) Quantification S1R-expressing Iba1+ microglia in the ctx of ctrl and cKO mice. n = 3 mice per group. Scale bars = 20 μm in c–e, 5 μm in c1-e1.
Taken together, the S1R flox mouse appears as a powerful tool to efficiently delete S1Rs in neurons and glial cells in the CNS in vivo.
4 DISCUSSION
Validation in KO animals is a golden standard to verify the specificity of antibodies for immunoblot and immunolabelling (Laflamme et al., 2019). After screening of six commercial S1R antibodies using S1R KO mice, we identified Ab#61994 from Cell Signaling as a reliable antibody for specific detection of S1R using Western blotting of brain and spinal cord lysates. Ab#61994 is a newly produced rabbit monoclonal antibody, which has been used only in a few studies so far (six publications according to the Cell Signaling website). Recently, one study by Abdullah et al., verified the specificity of Ab#61994 to detect S1Rs in tissue lysate from mouse heart, but without showing the complete protein separation range of the immunoblot (Abdullah et al., 2020). Therefore, the current work provides further evidence that Ab#61994 is a reliable antibody specifically recognizing S1Rs in immunoblot without generating bands at other molecular weight positions. However, four other S1R antibodies showed bands in protein samples from both WT and KO mice, indicating they are not working specifically for immunoblot. The antibody sc-137075 from Santa Cruz showed specific bands of S1Rs at the correct size, but also unspecifically bound to many proteins with different sizes other than S1Rs. Furthermore, we identified that only Ab#61994 could generate specific immunohistochemical staining of S1Rs with AR by 1% SDS. The other S1R antibodies failed to generate specific immunostaining in vivo under our tested conditions. Thus, our results suggest to cautiously re-evaluate previous studies using those antibodies for immunoblot, immunoprecipitation and/or IHC of S1Rs.
The S1R has been discovered for over 40 years. Intensive in vitro studies have revealed that S1Rs are serving as a pluripotent modulator of various cellular functions and are ligand-operated chaperons mainly localized on the ER membrane (Su et al., 2016). Recent transcriptomic studies of either bulk sequencing of purified CNS cells or single-cell sequencing all suggest that the S1R mRNA is widely detected in different cell types in the CNS (Consortium, 2020; Ximerakis et al., 2019; Zhang et al., 2014). However, the spatial protein expression pattern of S1R is still difficult to conclude because of conflicting IHC results using antibodies generated by different research groups or commercial companies (Alonso et al., 2000; Hayashi & Su, 2004; Palacios et al., 2003). A recent study using S1R KO mice examined the specificity of the AbRuoho and several commercial S1R antibodies including Absc-137075 and Ab42-3300 for IHC in dorsal root ganglion (DRG), which suggested only AbRuoho could reliably label S1Rs in the DRG (Mavlyutov et al., 2016). Furthermore, AbRuoho was the only antibody validated by S1R KO mice for immunolabelling of S1Rs in the CNS, though it did not work well for immunoblot (Mavlyutov et al., 2010; Mavlyutov et al., 2016). However, IHC studies using AbRuoho did not provide a clear S1R expression pattern at (sub)cellular levels in the CNS in vivo. In addition, AbRuoho is a custom-made antibody, hence, with limited availability to the research community.
In the current study, the newly established IHC protocol (ARSDS protocol) using Ab#61994clearly revealed that S1Rs are mainly localized in the ER-like structure of CNS cells as suggested by in vitro studies. Notably, unlike the study using the AbRuoho (Mavlyutov et al., 2016) the current protocol demonstrated high expression levels of the S1R in the olfactory bulb, cerebral cortex, hippocampus and thalamus. Combining immunostainings with cell type-specific markers, we were able to show that in addition to neurons, as suggested by using AbRuoho (Mavlyutov et al., 2010), S1Rs are widely expressed in various glial cells in the CNS including astrocytes, OPCs, OLs and microglia. Several AR methods such as heating with citrate buffer, microwave treatment, etc., have been tested to improve the immunostaining quality for the S1R in cultured cells (Hayashi, Lewis, Hayashi, Betenbaugh, & Su, 2011). In the current study, 1% SDS was used for the AR of the formaldehyde-fixed CNS tissue, substantially improving the S1R immunostaining. However, no AR was performed in studies using AbRuoho (Mavlyutov et al., 2016; Nakamura et al., 2019), which may explain their relatively fainter staining of S1Rs in the CNS compared to the results of the current protocols. Even more importantly, Ab#61994 is a monoclonal antibody produced by immortalized hybridoma cells, thereby ensuring its sustainable availability to the research community.
Although Ab#61994 displayed a very good capacity to specifically detect S1Rs in immunoblot and IHC, some drawbacks of using this antibody have to be considered. First, regarding the punctate background signals in the S1R KO brain, the signal/noise ratio of the current IHC protocol was not satisfactory to identify potential S1R expressions in fine structures such as the plasma membrane upon stimulations by agonists or stress in vivo (Su et al., 2016). Second, Ab#61994 can unspecifically bind to myelin-like structures in the spinal cord, brain stem and cerebellar white matter, hence limiting its application in white matter studies in certain CNS regions. Third, Ab#61994 did not work for IHC in brain tissues without SDS treatment, indicating that Ab#61994 may only recognize denatured S1R proteins. Therefore, it would be difficult to immunoprecipitate naïve S1Rs using Ab#61994. Further optimization of AR protocols for Ab#61994 as well as newly designed S1R antibodies would help to solve such problems.
Activation or inactivation of S1Rs by exogenous ligands both showed therapeutic effects for numerous neurological and psychological disorders. However, endogenous ligands of the S1R still remain unclear, hindering the understanding of patho- as well as physiological roles of the receptor in vivo (Sałaciak & Pytka, 2022; Schmidt & Kruse, 2019). Loss-of-function experiments would be an ideal strategy to investigate functions of S1R. However, unlike the pharmacological effects of the exogenous ligands, S1R KO mice showed mild phenotypes in ageing-related memory loss, cognitive impairments, motor defects, etc. (Couly et al., 2022). One possible explanation to such discrepancy can be a certain genetic compensatory machinery established during embryonic development that rescues the loss of S1R functions in global KO mice (El-Brolosy & Stainier, 2017). For example, hepatocyte-specific SIRT1 cKO mice develop a fatty liver which was not seen in global SIRT1 KO mice (Wang, Li, & Deng, 2010). Moreover, neither pharmacological intervention nor constitutive deletion of S1R could exclusively study S1R functions in specified cell types. To address such questions, we generated a Cre-dependent S1R conditional KO mouse (S1R flox). For the proof of concept, we showed that S1Rs could be successfully deleted in neurons or microglia mediated by Cre or CreER/tamoxifen systems in vivo. Regarding the broad expression of S1R in various cell types in and outside of the CNS, this newly generated S1R flox mouse will be a powerful tool to study cell-type-specific functions of the S1R in vivo.