
Single-cell genomic profiling of human dopamine neurons identifies a population that selectively degenerates in Parkinson’s disease

By Tushar Kamath, Abdulraouf Abdulraouf, S. J. Burris, Jonah Langlieb, Vahid Gazestani, Naeem M. Nadaf, Karol Balderrama, Charles Vanderburg, and Evan Z. Macosko
Excerpt from the article published in Nature Neuroscience (2022). https://doi.org/10.1038/s41593-022-01061-1ce
Editor’s Highlights
- A single subtype of dopamine (DA) neurons, marked by the expression of the gene AGTR1 and spatially confined to the ventral tier of the substantia nigra pars compacta (SNpc), was highly susceptible to lose in Parkinson’s disease (PD).
- This DA subpopulation, SOX6_AGTR1, showed the strongest upregulation of targets of TP53 (tumor-suppressor protein p53) and NR2F2 (encoding nuclear receptor subfamily 2, group F, member 2, alias COUP-TFII), nominating molecular processes associated with degeneration.
- The transcription factor (TF) encoded by NR2F2 promotes mitochondrial dysfunction in several disease models, including those of heart failure and PD.
- Upregulation of the TF encoded by TP53 provides a link to other neurodegenerative diseases, such as amyotrophic lateral sclerosis, in which TP53 has been implicated in motor neuron death.
Abstract
The loss of dopamine (DA) neurons within the substantia nigra pars compacta (SNpc) is a defining pathological hallmark of Parkinson’s disease (PD). Nevertheless, the molecular features associated with DA neuron vulnerability have not yet been fully identified. Here, we developed a protocol to enrich and transcriptionally profile DA neurons from patients with PD and matched controls, sampling a total of 387,483 nuclei, including 22,048 DA neuron profiles. We identified ten populations and spatially localized each within the SNpc using Slide-seq. A single subtype, marked by the expression of the gene AGTR1 and spatially confined to the ventral tier of SNpc, was highly susceptible to loss in PD and showed the strongest upregulation of targets of TP53 and NR2F2s, nominating molecular processes associated with degeneration. This same vulnerable population was specifically enriched for the heritable risk associated with PD, highlighting the importance of cell-intrinsic processes in determining the differential vulnerability of DA neurons to PD-associated degeneration.
Main
The degeneration of midbrain DA neurons within the SNpc is a pathological hallmark of PD and Lewy body dementia (LBD)1. Nevertheless, some SNpc neurons are observed to survive even into the late stages of these diseases2,3,4,5,6,7, suggesting differential vulnerability to degeneration. A clearer understanding of the specific molecular characteristics of vulnerable neurons, and the associated cascade of molecular events that lead to their demise, could provide opportunities to refine laboratory models of PD, and aid in the development of disease-modifying or cell-type-specific therapies8.
Recent advances in single-cell RNA-sequencing technology9,10,11, and its application to the postmortem human brain, have begun to reveal cell-type-specific changes in several brain diseases12,13,14,15,16. While some studies have profiled the human SNpc at single-cell resolution17,18,19,20, the proportion and absolute number of DA neurons sampled has been small—considerably lower than in murine SNpc—making it challenging to identify molecularly defined subpopulations and robustly compare across subjects.
Here, we developed a protocol for selective enrichment of DA neurons from postmortem human SNpc and used it to define ten transcriptionally-distinct populations by single-nucleus RNA-sequencing (snRNA-seq). We then spatially localized these populations along the dorsal–ventral axis of the SNpc using Slide-seq, a high-resolution spatial transcriptomics technology. Interestingly, we found that one population—marked by expression of AGTR1—was highly ventrally localized, consistent with previously identified patterns of DA neuron loss in PD21. Additional snRNA-seq analysis of postmortem tissue from patients with PD confirmed the selective loss of this population in PD. Critically, the transcriptional signature of these PD-vulnerable cells was highly enriched for expression of loci associated with PD by previous Genome-Wide Association (GWA) studies. These enrichment results suggest that cell-intrinsic molecular mechanisms play important roles in the selective vulnerability of some DA neuron populations to PD degeneration.
Results
A molecular taxonomy of human SNpc DA neurons
To address the sampling challenge associated with DA neuron profiling, we developed a protocol based on fluorescence-activated nuclei sorting (FANS), to enrich midbrain DA neuron nuclei for use in snRNA-seq (Fig. 1a). In a scRNA-seq dataset of mouse midbrain22(Extended Data Fig. 1a), we identified the gene Nr4a2 encoding a transcription factor (TF) as specific to mammalian midbrain DA neurons (area under the curve (AUC) = 0.76; Methods). To comprehensively profile all cell types in the SNpc, we isolated nuclei from eight neurotypical donors (Supplementary Table 1) and performed snRNA-seq on both NR4A2-positive and -negative nuclei (Extended Data Fig. 1b). In total, we generated 184,673 high-quality profiles (median number of unique molecular identifiers (UMIs) per individual, 8,810; median number of genes per individual, 3,590 (Extended Data Fig. 1c,d); median number of UMIs per cell, 8,086; median number of genes per cell, 3,462 (Extended Data Fig. 1e,f)), 43.6% of which were from the NR4A2-positive cytometry gate (Methods and Fig. 1b). We performed clustering analysis of each donor separately to assign profiles to one of seven main cell classes, including DA neurons (Methods and Extended Data Fig. 1g–j). The NR4A2-sorted profiles were 70-fold enriched for DA neurons (Fig. 1c), defined by a cluster with joint expression of TH, SLC6A3 and SLC18A2 (Extended Data Fig. 1i,j), genes whose products are essential for DA neurotransmission23.
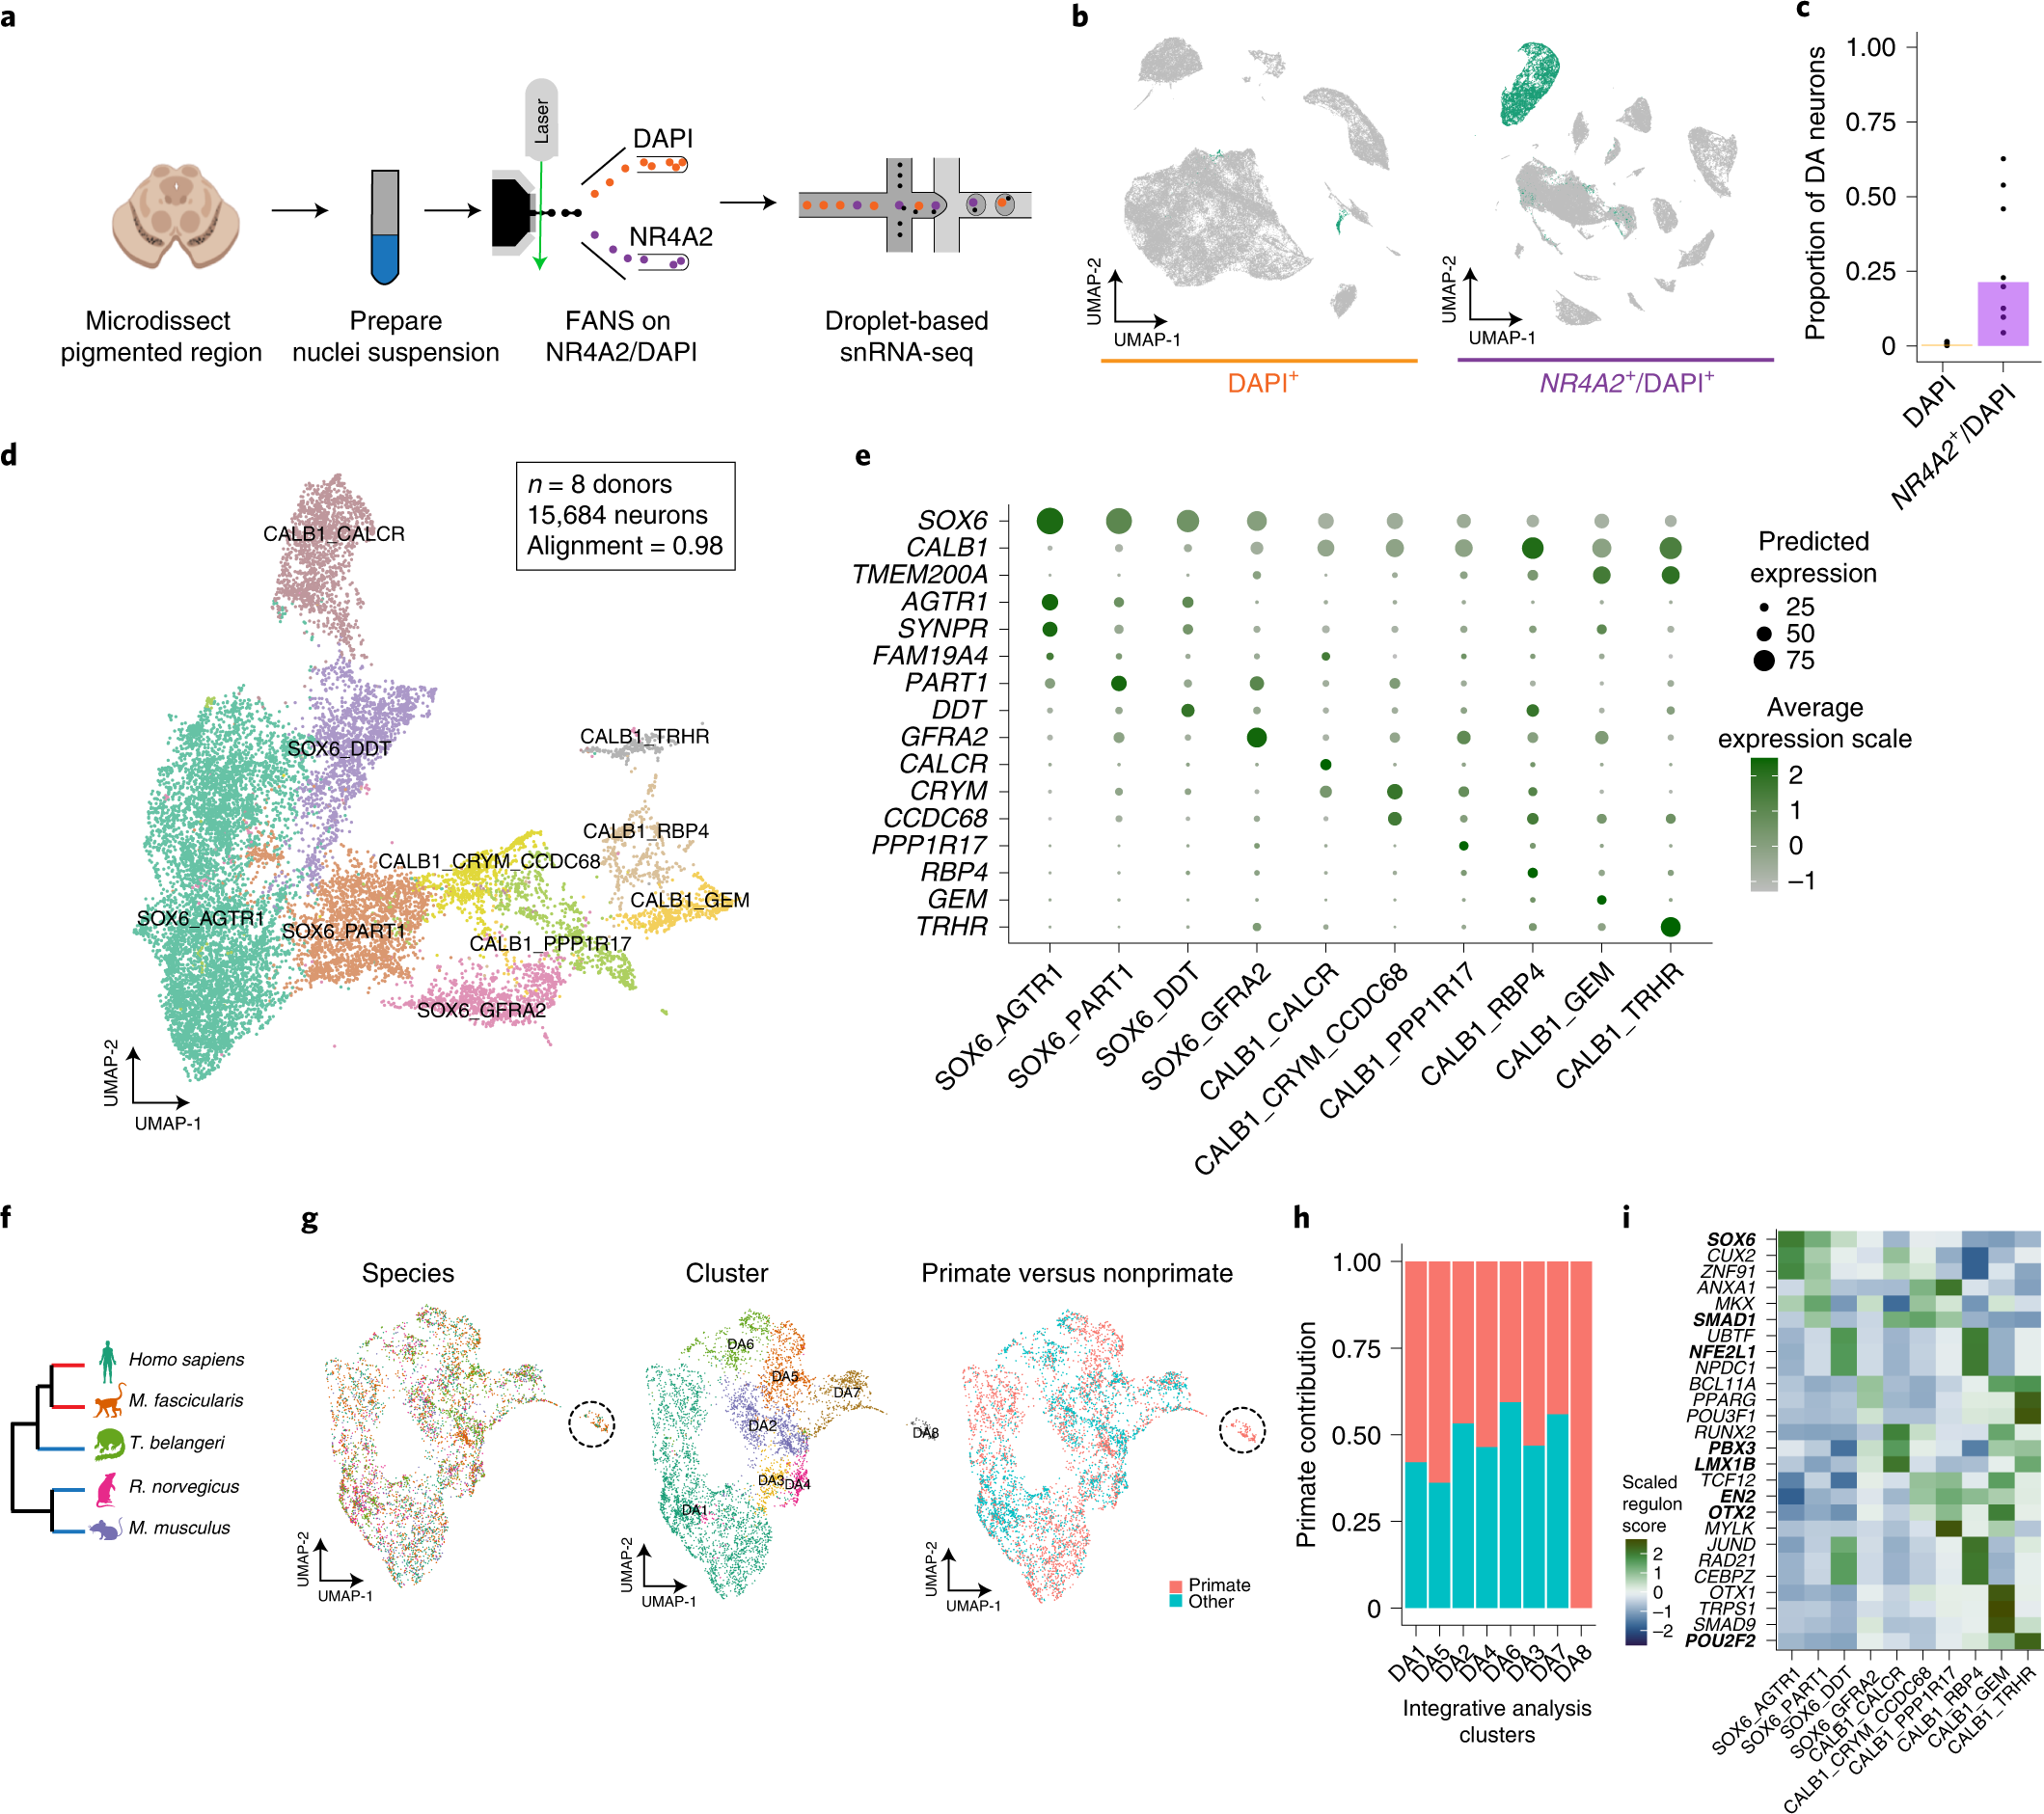
a, NR4A2 antibody-based enrichment strategy and snRNA-seq profiling workflow. b, UMAP representation of 104,097 NR4A2– (left) and 80,576 NR4A2+ (middle) nuclei from eight neurotypical donors. Profiles colored green are from clusters identified as DA neurons. c, Bar plot of proportions of DA neurons per replicate for NR4A2– versus NR4A2+ libraries (median fold enrichment, 70; n = 21 NR4A2+ and n = 16 NR4A2– libraries). d, UMAP representation of 15,684 DA neuron nuclei, colored by cell type. e, Dot plot showing expression of selected marker genes across DA clusters. f, Dendrogram showing phylogenetic relationships among the five species samples in this study. Red and blue branches denote primate and nonprimate species, respectively. g, UMAP representation of 6,253 DA neuron nuclei (3,400 primate nuclei and 2,853 nonprimate cells), colored by species (left), cluster identity (middle) and primate versus nonprimate (right). h, Stacked bar plot showing the proportion of primate profiles (red bars) in each cluster. i, Heatmap of scaled regulon activity, as determined by SCENIC (Methods), for the top three differentially expressed regulons per DA subtype. Bold indicates those TFs previously identified as important for midbrain DA differentiation.
To identify subtypes of DA neurons, we performed LIGER17 on 5,684 high-quality DA neuron nuclei, a 180-fold increase in absolute numbers over existing datasets of human midbrain DA neurons (Extended Data Fig. 2a). Based on our LIGER-derived, low-dimensional embedding (Extended Data Fig. 2b), we identified ten transcriptionally distinct subpopulations (Methods, Fig. 1d,e and Extended Data Fig. 2c) with strong alignment across all donors (Methods; alignment score, 0.98; Extended Data Fig. 2d). Four DA clusters preferentially expressed SOX6 while the other six expressed CALB1, recapitulating a well-defined developmental axis of variation within midbrain DA neurons (Fig. 1e)24. All of our subtypes showed strong expression of genes that are essential for DA neurotransmission (Extended Data Fig. 2e)23. Previously defined dopaminergic markers20 also showed strong expression across our dataset, with mixed expression of subtype markers previously found that differentiate different rodent populations (Extended Data Fig. 2e)20. Further, the proportions of these broad subtypes generally matched stereotactic estimates of CALB1+ cells from previous immunohistochemical stains of postmortem human nigra21 (Extended Data Fig. 2f), suggesting no intrinsic bias in our tissue sampling method. The broad CALB1–SOX6 axis of variation was consistent across donors (Extended Data Fig. 2g) and clusters were consistently represented across integrative tools (Extended Data Fig. 2h–j and Methods), suggesting that our strategy consistently uncovered and preserved underlying biological states.
Our method for high-throughput profiling of DA subtypes enabled us to make robust comparisons amongst pars compacta DA neurons across species. Although recent profiling studies of primates have shown strong evolutionary conservation of cell types in mice, a few primate-specific specializations have been reported25,26. To investigate the evolutionary conservation of our human DA neuron subtypes, we sampled and integrated, with our human datasets, DA neuron profiles from four additional species spanning three phylogenetic orders: Primate, Scandenti and Rodentia (Fig. 1f). Cross-species analysis (Methods) identified eight clusters (Fig. 1g) that consistently followed the SOX6–CALB1 axis of variation (Extended Data Fig. 3a–c). While some profiles exhibited divergence in cellular proportions, integrative analysis largely maintained the cluster distinctions found in the human-only analysis (Extended Data Fig. 3d). Examining the contributions of each species to each cluster, we found that the DA8 population, composed primarily of the CALB1_GEM human population (Extended Data Fig. 3d), included profiles derived only from humans and macaque (Fig. 1g,h), and expressed a number of highly specific marker genes not found in any one other DA subtype in our integrative analysis (Extended Data Fig. 3e) and absent from a previous analysis of rodent DA subtypes (Extended Data Fig. 3f)23. Using in situ hybridization across the mouse midbrain (Methods), we found no murine DA neurons expressing the marker genes Fam83b and Gem for our DA8 population (Extended Data Fig. 3g–i), further confirming the lack of a cognate population in rodents.
Regulatory element identification in dopaminergic neurons
The identification of regulatory elements that drive the molecular identity of DA neurons can inform differentiation protocols for in vitro studies of DA neurons in PD, as well as drive the refinement of cellular replacement therapies for this disease. To understand the regulatory networks that may drive such transcriptional variation, we used single-cell regulatory network inference and clustering (SCENIC) to identify 84 regulons that were highly specific (P adjusted < 0.05 and AUC > 0.7, Wilcoxon rank-sum test; Methods) to the ten DA subtypes defined in our dataset. The top TFs ranked by AUC per DA subtype contained many TFs previously implicated in specifying DA identity, including those encoded by the genes SOX6, OTX2, SMAD1, PBX1, LMX1B, NFE2L1 and EN2 (Fig. 1i and Extended Data Fig. 4a)27. Even within the more homogeneous SOX6 axis we identified several TFs with differential activity across subtypes, including the TF encoded by SMAD1, as well as some not previously implicated in DA neuron differentiation such as those encoded by CUX2 and ZNF91. The same SCENIC analysis on DA neuron data generated from the macaque midbrain (Extended Data Fig. 4b) identified highly overlapping sets of regulons, further corroborating the identification of selectively active TFs in each DA subtype.
Localization of DA neurons in macaque midbrain by Slide-seq
Dopaminergic neurons in the SNpc comprise the A9 group of catecholaminergic neurons and are divided into dorsal and ventral tiers, with the ventral tier showing greater vulnerability to PD-associated degeneration6,21,28,29,30. To spatially localize the ten DA populations defined in our human analysis (Fig. 1d), we performed Slide-seq31,32 on 27 arrays generated from nine coronal sections spanning the caudal 80% of the rostralcaudal axis of a Macaca fascicularisSNpc (Methods, Fig. 2a and Extended Data Fig. 5a,b). The A9 group was easily identifiable by visualizing the expression of DA neuron markers TH and SLC6A3 (Extended Data Fig. 5c). Using a recently described tool for decomposition of cell type mixtures in spatial transcriptomics data33 (Methods), we localized our ten DA subtypes to 3,206 Slide-seq-defined bead locations in the A9 group (Fig. 2d, Extended Data Fig. 5d and Methods) and positioned each relative to the demarcation between dorsal and ventral tiers (Fig. 2e, dotted line), defined from the expression of CALB1 and ALDH1A1 (Extended Data Fig. 5c–e)21. The SOX6_AGTR1 population was the most strongly enriched in the ventral tier (Fig. 2d,e and Extended Data Fig. 5f–h; mean SOX6_AGTR1 relative distance, +490 μm), consistent with previous marker analyses performed on laser-capture microdissection subsets of A9 DA neurons34, while the CALB1_GEM and CALB1_TRHR populations were strongly enriched in the dorsal tier (Fig. 2d,e and Extended Data Fig. 5f–h; mean CALB1_GEM relative distance, −478 μm; mean CALB1_TRHR relative distance, −288 μm). Single-molecule fluorescence in situ hybridization (smFISH) (Extended Data Fig. 6a and Methods) of the human midbrain confirmed localization of the SOX6_AGTR1 subtype to the ventral tier (Fig. 2f,g and Extended Data Fig. 6b) and types CALB1_GEM and CALB1_TRHR to the dorsal tier (Fig. 2f,g and Extended Data Fig. 6c,d). Additional in situ analyses of two other SOX6+ populations confirmed their lack of selective localization to either tier (Extended Data Fig. 6e–h), consistent with the Slide-seq results (Fig. 2e).

a, Nissl staining of a 10-μm M. fascicularis midbrain slice adjacent to Slide-seq-assayed tissue. Circles indicate approximate location of the placement of the three Slide-seq arrays shown in b–d. RN, red nucleus; CP, cerebral peduncles; SNpcd, substantia nigra pars compacta dorsal; SNpcv, substantia nigra pars compacta ventral. Cartesian arrows indicate orientation of bead arrays in b–d; scale bar, 1 mm. Nissl staining was repeated nine times across macaque brain. b–d, Bead arrays colored by RCTD cell type definitions (Methods) corresponding to major cell type (b), CALB1+ or SOX6+ subtypes (c) and the three most spatially variable DA subtypes (d). e, Ridge plot for aggregated densities of CALB1 and SOX6 subtypes (top) and all ten DA subtypes (bottom) across 27 bead arrays (Methods, also includes definition of midline). f, Tiled image of one 10-μm human midbrain slice. White dotted line indicates the approximate A9 region; scale bar, 1 mm. Experiment was repeated once. g, Scatter plots showing relative location of triple- (yellow) and single-positive cells (Methods) from in situ hybridization of markers: CALB1+/GEM+ (left), CALB1+/TRHR+ (middle) and SOX6+/AGTR1+ DA neurons (right); scale bars, 1 mm. Experiment was repeated five times for SOX6+/AGTR1+ localization and once for CALB1+/GEM+ and CALB1+/TRHR+.
Differentially vulnerable DA neurons in PD
The strong ventral localization of the SOX6_AGTR1 population suggested that it may be especially susceptible to PD-associated degeneration. To identify cell-type-specific molecular alterations in PD, we profiled an additional 202,810 high-quality nuclei (Extended Data Fig. 7a–d; median number of UMIs per individual, 7,177; median number of genes per individual, 3,108; median number of UMIs and genes per cell, 6,939 and 3,076, respectively), including 6,364 DA neurons, from ten age-matched and postmortem-interval-matched (Extended Data Fig. 7e–g) individuals with documented pathological midbrain DA neuron loss, and a clinical diagnosis of either PD or LBD (Supplementary Table 2). Between PD/LBD and neurotypical control tissues there were no significant differences in tissue collection date (Extended Data Fig. 7h), and this covariate had no significant effect on the integrity of capture (P > 0.05; Methods and Extended Data Fig. 7i). Finally, integrative analysis of these donors with our neurotypical controls (Methods) identified 68 transcriptionally defined subpopulations (Extended Data Fig. 7j–o) from our seven major cell classes, with minimal batch-dependent variation (alignment scores: 0.61–1.0; median alignment score across cell types, 0.76; Extended Data Fig. 7p).
We assessed the differential abundance between PD/LBD and aged control samples for both major cell classes and all molecularly defined subtypes. Among major cell classes, DA neurons showed the largest significant decline (P < 0.05, Wilcoxon rank-sum test) as a fraction of cells per individual (Extended Data Fig. 8a). Among the 68 molecularly defined subpopulations, 11 showed significant proportional changes in association with PD/LBD (Fig. 3a; false discovery rate (FDR)-adjusted P < 0.05, absolute log2(odds ratio (OR_) > 0; Methods). One proportionally increased population was a subset of microglia expressing GPNMB (Extended Data Fig. 8b), which has been identified as a marker of disease-associated microglia in transcriptomic studies of Alzheimer’s disease (AD)35,36 and was robust up to one-sixth of the original dataset size (Extended Data Fig. 8c). We also identified an increase in the VIM_LHX2 astrocyte subtype (Extended Data Fig. 8d), similarly robust to large losses in power due to sample size (Extended Data Fig. 8e). The VIM_LHX2 population expresses reactive markers, namely VIM and LHX2 (Extended Data Fig. 8d), suggesting that this population may play a role in responding to degenerative changes in PD/LBD SNpc.

a, Volcano plot showing OR and FDR computed by MASC (Methods) for each of the 68 clusters identified in SNpc snRNA-seq analysis. Labeled clusters are those significantly (FDR-adjusted P < 0.05) increased or depleted in association with PD/LBD. Points and text are colored by major cell type: dark green, DA neurons; yellow, microglia/macrophages; purple, OPCs; light green, endothelial cells/pericytes; pink, astrocytes. b, OR estimate of ten dopaminergic subpopulations as identified by MASC. Center of bar corresponds to OR estimate obtained from MASC, width corresponds to 2.5× s.d. of OR estimate from MASC. Bars that cross zero (dotted line) not statistically significant (FDR-adjusted P > 0.05, n = 22,048 DA neurons sampled across ten PD/LBD donors and eight neurotypical donors). c, Left: disease enrichment score (Methods) overlaid onto a binned UMAP representation of integrative analysis of both PD/LBD and control DA neurons (n = 10 PD/LBD individuals and n = 8 neurotypical controls). Right: expression of selected genes used to validate subtype vulnerability plotted on UMAP representation of DA neurons. d, Representative images of triple-positive cells for a disease-resistant DA population (TH+/CALB1+/TMEM200A+) and a disease-vulnerable population (TH+/AGTR1+/SOX6+, bottom). White/black asterisks indicate neuromelanin-induced autofluorescence while white arrows show lipofuscin-induced autofluorescence; gray arrows indicate RNA puncta. Scale bars, 10 μm. e, Boxplot showing proportions of four DA populations across ten PD and ten control SNpc tissue donors, determined by counting smFISH images from the two staining procedures (3,258 and 2,081 DA neurons counted for first and second assay, respectively) described in d. Center line of the boxplot indicates the median value while upper and lower hinges indicate the first and third quartiles of data, respectively. Whisker distance between upper and lower hinges represent ≤1.5× interquartile range. All dots represent an individual case for each subtype as a fraction of total TH+ cells counted. +, positive for marker; −, negative for marker; NM, not measured; NS, not significant. *P < 0.05 (P = 0.041 for CALB1+/TMEM200A+/TH+ comparison, P = 0.028 for CALB1+/TMEM200A−/TH+ comparison, P = 0.009 for CALB1+/TH+ comparison, P = 0.024 for SOX6+/AGTR1+/TH+ comparison, P = 0.28 for SOX6+/AGTR1–/TH+ experiment and P = 0.015 for SOX6+/AGTR1−/TH+ comparison; Wilcoxon rank-sum two-sided test; Methods).
The largest statistically significant decline was in the SOX6_AGTR1 DA population, while clusters CALB1_GEM and CALB1_TRHR were proportionally increased (Fig. 3b). These proportional changes were robust to differences in absolute numbers of DA neurons sampled per cluster (Supplementary Fig. 1a), clinical diagnosis (Supplementary Fig. 1b) and library quality (Supplementary Fig. 1c,d). We further developed a metric to visualize disease-associated enrichment or depletion within the low-dimensional embedding of jointly analyzed cell profiles, identifying a gradient of susceptibility (Fig. 3c and Methods) that correlated with the expression of AGTR1 and ORs from mixed-effects association of single cells (MASC) (Fig. 3c).
Our flow cytometry procedure to isolate DA nuclei relies on protein expression of NR4A2, which is downregulated in DA neurons in PD37. To address these and other potential confounders, we quantified DA subtype proportions using smFISH, performed on an additional 20 postmortem-frozen midbrains equally divided among neurotypical donors and individuals who had died of PD (with concurrent documented midbrain DA neuron loss) (Supplementary Table 3, Supplementary Fig. 2a–d and Methods). In the first experiment we probed for cells expressing TH, SOX6 and AGTR1 (Fig. 3d); in a second experiment, we identified cells in situ expressing TH, CALB1 and TMEM200A (Fig. 3d), a marker enriched in the CALB1_TRHR, CALB1_GEM and CALB_RBP4 populations (Fig. 1e). We assayed the proportional representations of double- and triple-positive cells in each smFISH experiment and counted a total of 5,339 individual DA neurons (Supplementary Fig. 2e) across 40 full SNpc sections. We confirmed that CALB1+/TMEM200A+ DA cells were selectively enriched in PD (Fig. 3e; Wilcoxon rank-sum test P < 0.05), as were CALB1+/TMEM200A− DA cells, although the log fold change difference was lower (Fig. 3e; log2(fold change 1.13) for the TMEM200A−group versus log2(fold change 1.32) for the TMEM200A+ group; Supplementary Table 5). We also confirmed selective depletion of the SOX6_AGTR1 subpopulation (Fig. 3e; Wilcoxon rank-sum test P < 0.05, log2(fold change −2.1); Supplementary Table 5).
Cellular localization of PD common variants
We next sought to better understand the origins of the selective vulnerability of SOX6_AGTR1 cells to neurodegeneration in PD. One possibility is that the human genetic risk for PD—which is established at birth—selectively acts within the vulnerable population. To test this, we examined the enrichment of expression of genes harboring either familial and common variants associated with PD. A total of 26 genes have been identified that harbor mutations, as ascertained by family studies, that confer substantial risk for PD38. We tested the overlap between these genes and markers specifically expressed in eight major cell classes of the SNpc (Fig. 4a and Methods). The DA neuron gene set was the only one to show significant enrichment (Bonferroni-corrected P < 0.05, Fisher’s exact test; Methods) of genes that contained these familial variants (Fig. 4b), suggesting that a substantial fraction of these genes act within DA neurons to influence neurodegeneration.

a, Heatmap of expression of 26 familial genes, colored by AUC statistic (Presto; Methods). b, Bar plot of −log10-transformed P values from Fisher’s exact test comparing overlap between markers for major cell types (Methods) and familial variant genes. Red dashed line indicates Bonferroni significance threshold (P < 0.05) c, Bar plot of −log10-transformed P values from MAGMA enrichment of AD (left) and PD (right) across 16 cell types from dorsal striatum (caudate) and SNpc. Bars are colored for significantly (Bonferroni-corrected P < 0.05) enriched cell types. d, Dot plot of −log10-transformed P values for MAGMA analysis of PD genetic risk in 68 transcriptionally defined SNpc clusters. Clusters are grouped on the y axis by major cell class. Red dashed line indicates Bonferroni significance threshold (P < 0.05). e, Scatter plot of genes nominated from MAGMA gene-based analysis (y axis) and enriched in the SOX6_AGTR1 set (x axis). Red indicates genes not differentially expressed in any other DA subtype; orange indicates genes enriched within all SOX6+ DA subtypes; yellow indicates genes enriched in SOX6+ or SOX6– DA subtype. #, Loci that have the nominated SNP within a coding region of the nominated gene. f, GO terms enriched among genes differentially expressed within the SOX6+ subtype that also have high (z-score > 4.568) MAGMA z-scores derived from PD GWA study. g, GSEA of TF target sets (Methods) within the SOX6_AGTR1 type (y axis) versus the maximum value of any other DA type (x axis). Dashed red lines indicate FDR-significant TFs. *, TFs with a negative enrichment score. h, GSEA trace plots for three TFs: TP53, NR2F2 and LMX1A. Colors correspond to ORs derived from MASC analysis (Fig. 2b). dSPN, direct spiny projection neuron; iSPN, indirect spiny projection neuron.
We next examined the enrichment of common variant risk of sporadic PD within markers of our SNpc cell classes (Methods)39,40, as well as markers of cell classes defined by the additional profiling of 46,872 nuclei from postmortem dorsal striatum tissue of four neuropathologically normal individuals (Extended Data Fig. 9a–g and Supplementary Table 4). We observed strong, significant enrichment (Bonferroni-corrected P < 0.05) of heritable risk for sporadic PD (Methods) in markers of DA neurons (Fig. 4c, Extended Data Fig. 10a and Supplementary Table 9), in agreement with recent analyses of mouse and human single-cell datasets19,41. In contrast, significant enrichment (Bonferroni-corrected P < 0.05; Supplementary Table 9) of heritable risk for sporadic AD was identified in markers of microglia/macrophage clusters from both SNpc and dorsal striatum (Fig. 4c and Extended Data Fig. 10a), also consistent with previous analyses41,42. Next, we tested the enrichment of PD common variant risk across our 68 transcriptionally defined subpopulations in human SNpc (Methods and Supplementary Table 7). Using two different statistical methods40,43, we found the largest and only statistically significant (Bonferroni-corrected P < 0.05; Methodsand Supplementary Table 9) enrichment of PD genetic risk genes within the SOX6_AGTR1 cell subtype (Fig. 4d and Extended Data Fig. 10b). Relative enrichment by both methods was uninfluenced by the number of nuclei sampled per DA subtype (Extended Data Fig. 10c and Supplementary Table 7), and ordering of the significance of these enrichments was consistent across variations in gene set size (Extended Data Fig. 10d).
To further characterize the genetic loci enriched in SOX6_AGTR1 cells, we identified genes that were assigned high MAGMA z-scores and low P values for DA subtype differential expression, including the SOX6_AGTR1 population (Fig. 4e and Extended Data Fig. 10e). Some prioritized—and well-studied—genes were expressed in multiple SOX6+ and CALB1+ subtypes, including SNCA, MAPT and GAK. Other SOX6_AGTR1-specific genes included the GWA-prioritized genes WNT3 and IGSF9B39. Gene Ontology (GO) enrichment analysis (Methods) of SOX6+-specific genes identified relevant ontologies that included regulation of neuron death and Wnt signaling44,45, reinforcing that the genetic loci identified as being expressed in this subtype probably act cell intrinsically to influence neurodegeneration (Fig. 4f).
Nomination of gene programs altered in dopaminergic neurons
Finally, we sought to nominate gene regulatory programs significantly and specifically altered in the SOX6_AGTR1 population in our PD/LBD tissue donors. Using gene set enrichment analysis (GSEA)46,47 of known TF target sets48 (Methods), we identified a total of 13 TFs whose targets were significantly (FDR significant P < 0.05) enriched in the SOX6_AGTR1 population but not in the other DA subtypes (Fig. 4g,h and Supplementary Fig. 3a). This analysis revealed a depletion of targets of the TF encoded by the gene LMX1A (Methods; normalized enrichment score <0), a TF involved in the developmental specification of midbrain DA neurons49. Transcription factors whose targets were enriched in the SOX6_AGTR1 population included TP53, whose own transcript was also upregulated specifically in the SOX6_AGTR1 population (Supplementary Fig. 3b), as well as NR2F2; both TFs modulate the progression of midbrain DA neuron loss in mouse models of PD50,51,52.
Discussion
In this study we generated a molecular taxonomy of human SNpc DA neurons, spatially localized them within the SNpc and identified one DA subpopulation, SOX6_AGTR1, that is highly susceptible to neurodegeneration in PD. Importantly, across both the substantia nigra and caudate, this population was the most strongly enriched for expression of genes associated with PD by previous GWAS, suggesting that the genetic risk of PD acts preferentially in the most vulnerable neurons to influence their survival. Transcriptional changes within SOX_AGTR1 cells in patients with PD implicated several canonical cell stress pathways—including those regulated by TFs encoded by the genes TP53 and NR2F2—as important to the process of PD-associated neuronal death.
Our snRNA-seq analysis of SNpc DA neurons provides a comprehensive taxonomy of these critically important cells in humans. Our map will help guide bulk transcriptomic studies of PD in localization of disease-associated signals to specific human DA subtypes. Further, DA subtype definitions will allow the refinement of in vitro DA neuron differentiation protocols, which could prove useful in genetic screens of neuronal susceptibility53,54 and the testing of candidate therapeutic molecules. Interestingly, although nine of our ten populations showed homology to rodent DA populations, one cluster of cells, CALB1_GEM, was found only in our snRNA-seq data from macaque and human and not from mouse, rat or tree shrew. We localized CALB1_GEM cells exclusively to the dorsal tier of the SNpc, which is known to be expanded in primates relative to rodents26,27. Indeed, primate dorsal tier neurons have previously been shown to make atypical projections directly to cortex26,27. The possibility that the molecularly distinct CALB1_GEM population is responsible for these projections is intriguing, but will need to be verified directly in nonhuman primate (NHP) models.
The partitioning of heritable disease risk preferentially to the most vulnerable DA population provides evidence that the genetic influences of PD-associated degeneration are preferentially cell intrinsic. This result—which is consistent with previous efforts to partition heritable risk of PD19,41—contrasts with similar analyses performed on late-onset AD genetic risk that particularly implicate microglia and other populations of myeloid origin in nonautonomous neuroimmune mechanisms55. Thus, despite overlapping pathologies and the clinical phenomenon of these two diseases, there exist substantial differences in how genetic risk may manifest in producing the disease, an insight that could prove useful in the advancement of specific therapeutic opportunities and biomarkers.
The heritability enrichment within PD-vulnerable neurons themselves also provides a crucial opportunity to address a longstanding question in PD about the primacy of midbrain DA neuron death relative to neurodegeneration in other regions. For example, one hypothesis of PD pathogenesis posits that PD pathology ascends through the brain (for example, via alpha-synuclein aggregates) from outside the central nervous system, through medullary brainstem structures56. The extension of profiling efforts to these other structures57—and comparison of heritability enrichment in vulnerable cell types—could help to clarify whether these other, vulnerable structures are degenerating due to primary influences of the disease or are secondary to midbrain DA loss.
Our identification of TFs whose activity is up- or downregulated, as nominated by our enrichment of targets in our differential expression, specifically within the vulnerable SOX6_AGTR1 population implicates specific cellular pathways in the process of DA neuron death in PD. The TF encoded by NR2F2, for example, has previously been shown to promote mitochondrial dysfunction in several disease models, including those of heart failure58 and PD52. Upregulation of the TF encoded by TP53 provides a link to other neurodegenerative diseases, such as amyotrophic lateral sclerosis, in which TP53 has been implicated in motor neuron death59,60,61,62. Cross-disorder integrative analyses may reveal conserved molecular processes that are prime candidates for therapeutic intervention.