
Mitochondrial biogenesis, telomere length and cellular senescence in Parkinson’s disease and Lewy body dementia

By Muhammad Asghar, Amani Odeh, Ahmad Jouni Fattahi, Alexandra Edwards Henriksson, Aurelie Miglar, Shervin Khosousi, and Per Svenningsson
Excerpt from the article published in Scientific Reports 12, 17578, 20 October 2022, DOI: https://doi.org/10.1038/s41598-022-22400-z
Editor’s Highlights
- Although Parkinson’s disease (PD) is a complex disease with several causes, including genetic and environmental factors, progressive age remains the single major risk factor for PD.
- Mitochondrial copy number is strongly associated with mitochondrial function, which makes it an important aging marker.
- Mitochondrial dysfunction and cellular senescence might be valuable markers to study neurodegenerative diseases (PD, PDD, DLB)
Abstract
Progressive age is the single major risk factor for neurodegenerative diseases. Cellular aging markers during Parkinson’s disease (PD) have been implicated in previous studies, however the majority of studies have investigated the association of individual cellular aging hallmarks with PD but not jointly. Here, we have studied the association of PD with three aging hallmarks (telomere attrition, mitochondrial dysfunction, and cellular senescence) in blood and the brain tissue. Our results show that PD patients had 20% lower mitochondrial DNA copies but 26% longer telomeres in blood compared to controls. Moreover, telomere length in blood was positively correlated with medication (Levodopa Equivalent Daily Dose, LEDD) and disease duration. Similar results were found in brain tissue, where patients with Parkinson’s disease (PD), Parkinson’s disease dementia (PDD) and Dementia with Lewy Bodies (DLB) showed (46–95%) depleted mtDNA copies, but (7–9%) longer telomeres compared to controls. In addition, patients had lower mitochondrial biogenesis (PGC-1α and PGC-1β) and higher load of a cellular senescence marker in postmortem prefrontal cortex tissue, with DLB showing the highest effect among the patient groups. Our results suggest that mitochondrial dysfunction (copy number and biogenesis) in blood might be a valuable marker to assess the risk of PD. However, further studies with larger sample size are needed to evaluate these findings.
Introduction
Parkinson’s disease (PD) is the second most common age-related neurodegenerative disease, characterized by motor dysfunctions caused by the progressive death of dopaminergic neurons in the substantia nigra, and is often accompanied by non-motor symptoms such as dementia, mood and sleep disorders1,2,3. Although PD is a complex disease with several causes, including genetic and environmental factors, progressive age remains the single major risk factor for PD3.
Aging is characterized by a time-dependent progressive deterioration of an organism’s function, caused by the accumulation of deleterious changes throughout its lifetime4. Cellular aging markers such as mitochondrial dysfunction and telomere shortening have been associated with age related disorders and neurodegenerative diseases5,6,7. Mitochondria are surrounded by double-membranes, which maintain the functional and structural integrity of pre- and post-mitotic cells, through involvement in cellular bioenergetics and the production of reactive oxygen species (ROS)8. Lower blood mitochondrial DNA (mtDNA) copy number has been associated with high mortality, poor health conditions, worse physical performance, and cognitive impairment9. Somatic mtDNA damage and mutations are part of the natural aging process, however, they have also been linked to age associated diseases and neurodegeneration in humans7,10,11,12. Furthermore, increased accumulation of mtDNAmutations and damage has been shown to contribute to impaired mitochondrial respiration12,13. Hence, mitochondrial DNA content and function might represent a valuable biomarker to monitor early changes in different physiological and pathological states.
Telomere shortening is a well-studied hallmark of aging that has been associated with several age-related disorders, infectious diseases and neurodegenerative diseases14,15,16,17. Telomeres are non-coding, ribonucleotide structures composed of highly conserved repetitive hexamer 5′-TTAGGG-3′ and a core of proteins called shelterin. Telomeres maintain chromosome integrity by capping the ends to prevent end-to-end joining of chromosomes and prevent loss of coding DNA sequences during DNA replication. Telomeres shorten progressively over time until reaching a critical length that leads to cell-cycle arrest, senescence, or apoptosis, respectively4,18. Whether telomere shortening also contributes to the pathogenesis of neurodegenerative disorders remains to be understood. Previous studies provide inconclusive findings regarding the association between telomere length and PD, where both shorter and longer telomeres have been identified as a risk factor for PD17,19.
Furthermore, it has been shown that shorter telomeres and dysfunctional mitochondria in turn lead to cellular senescence4, a state of irreversible cell cycle arrest, which is associated with age related pathology and phenotypic alterations20,21. Expression of the cyclin-dependent kinase inhibitor 2A (CDKN2A) gene is positively correlated to cellular senescence and has emerged as a valuable marker of cellular senescence over the last decade21,22. CDKN2A is a cell cycle inhibitor gene encoding for p16INK4a and p14arf20,21. Expression of CDKN2A is positively correlated with 3-repeat TAU (microtubule-associated protein) transcripts in blood and associated with mild cognitive decline in humans23.
This study investigated the telomere-mitochondria axis of aging in PD patients. We investigated the association between PD with cellular aging biomarkers (telomere attrition, mitochondrial copy number) in blood. Furthermore, we investigated the association of PD, Parkinson’s Disease Dementia (PDD) and Dementia with Lewy Bodies (DLB) with cellular aging biomarkers (telomere attrition, mitochondrial dysfunction, and cellular senescence) in postmortem prefrontal cortex tissues.
Results
Senescence biomarkers in whole blood
PD patients had significantly lower number of mitochondria (Est. = 62.74, SE = 27.02, df = 1, t = 2.36, p = 0.020, Fig. 1A,) with no significant effect of age (Est. = − 1.506, SE = 1.764, df = 115, t = − 0.857, p = 0.395) and sex (Est. = − 9.237, SE = 16.42, df = 1, t = − 0.56, p = 0.576). Our results show that PD patients had significantly longer telomeres in blood compared to controls (Est. = − 0.393, SE = 0.176, df = 1, t = − 2.23, p = 0.028, Fig. 1B), with no effect of age (Est. = 0.009, SE = 0.011, df = 115, t = 0.84, p = 0.400) and sex (Est. = 0.188, SE = 0.107, df = 1, t = 1.75, p = 0.083). Overall PD patients had 19.7% lower mtDNA copy number and 26.3% longer telomeres compared to controls (Fig. 1A,B). Mitochondrial DNA copy number and telomere length showed no significant correlation between each other in blood, neither for PD patients nor for controls (all p > 0.05, data not shown).
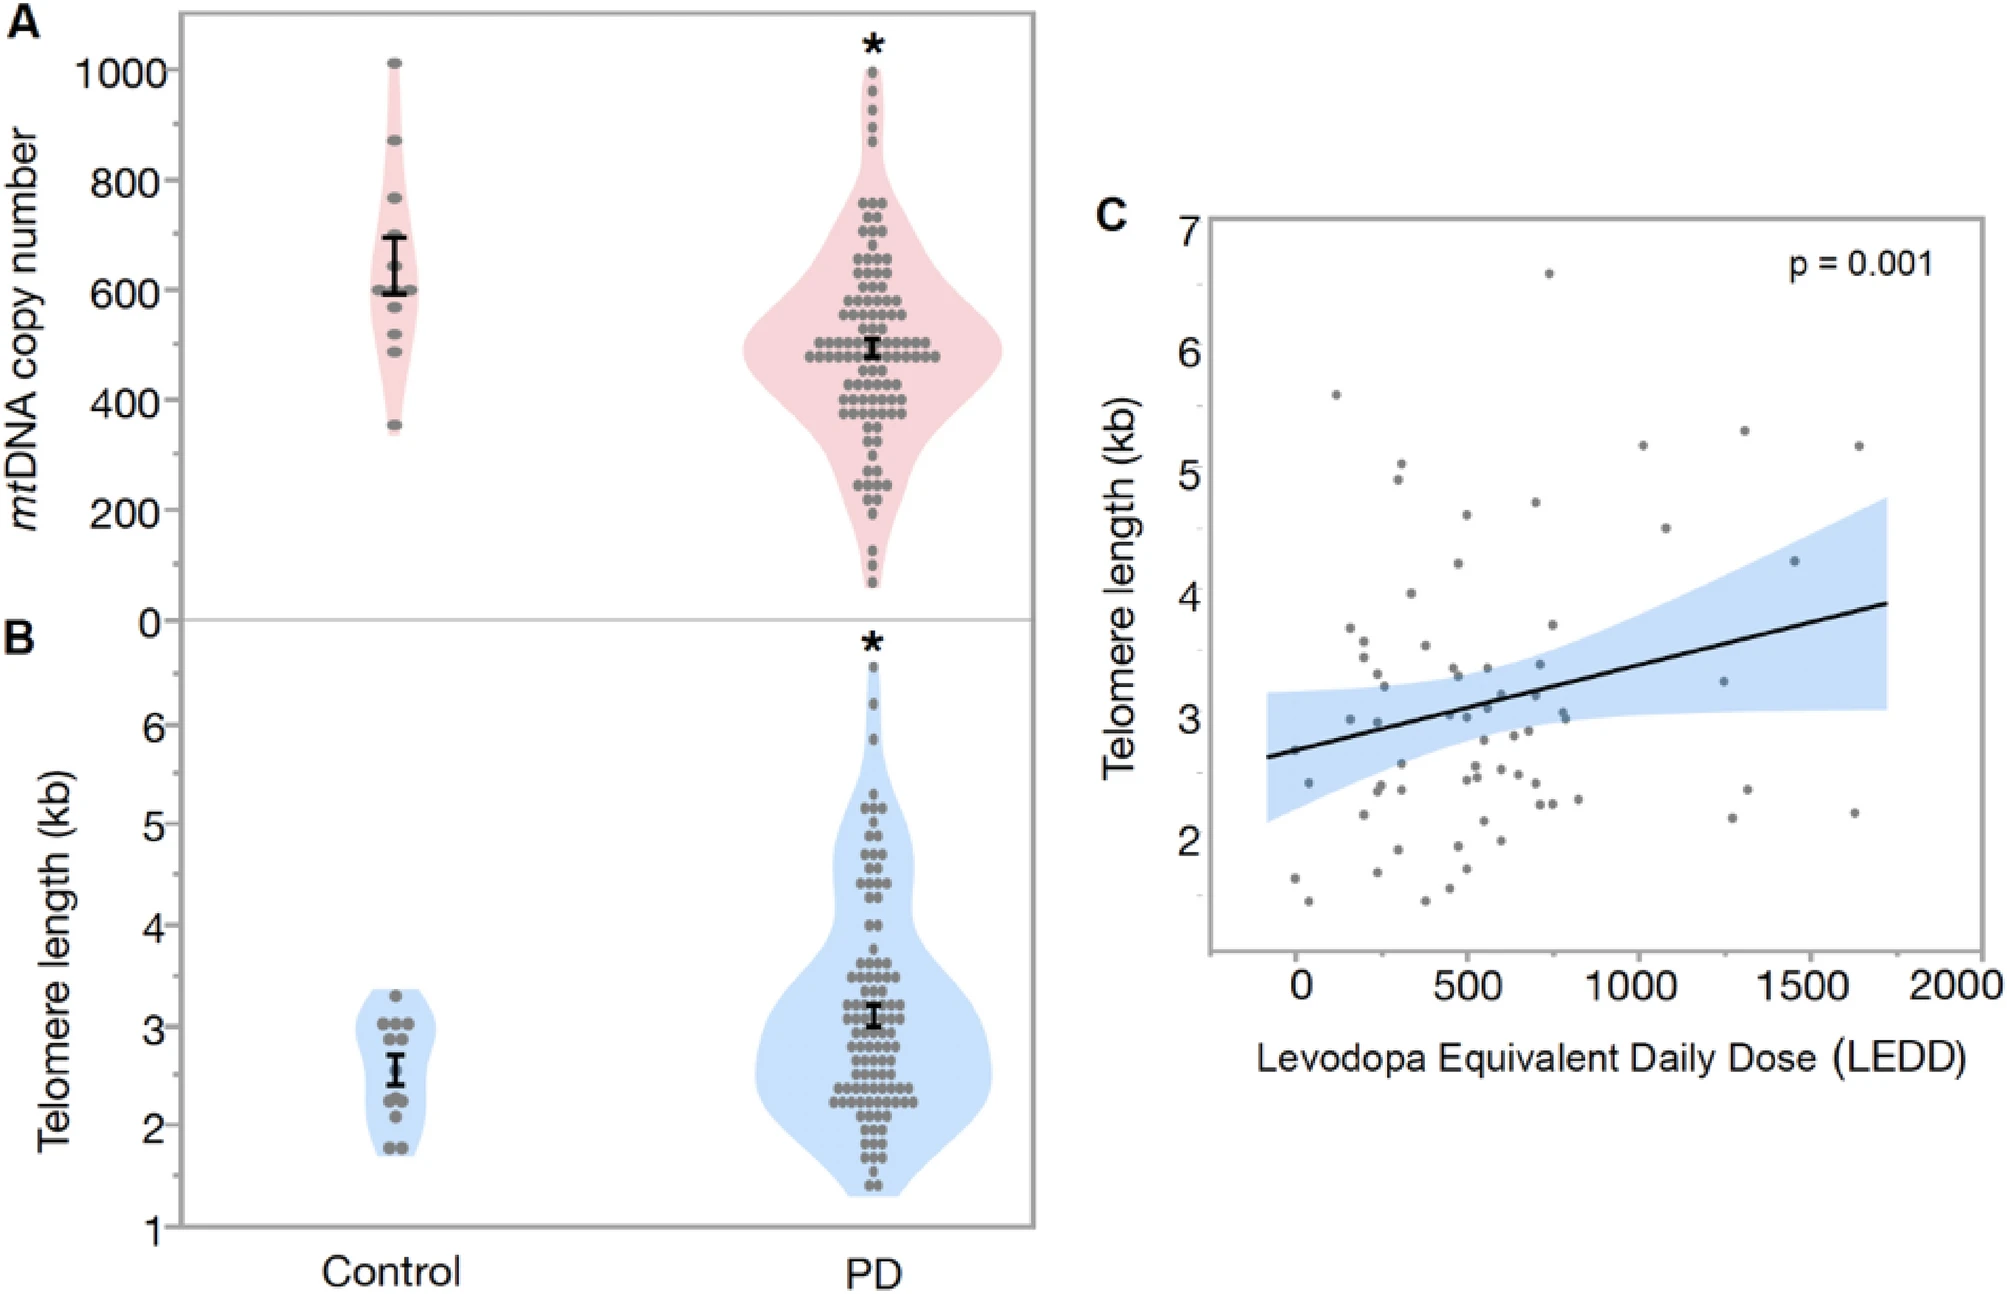
(A) Difference in mtDNA copy number and (B) telomere length between Parkinson’s Disease (PD) patients and controls in blood. Mean mtDNA copy number in PD patients was 505.99 ± 17.68, compared to controls 630.48 ± 52.88, while mean telomere length in PD patients was 3.21 ± 1.12 kb compared to the controls 2.54 ± 0.15 kb (C) Association between telomere length and Levodopa Equivalent Daily Dose (LEDD) in blood (multivariate regression). Data are presented as mean ± SE. *p < 0.05 versus control.
Our multivariate regression analysis showed that telomere length was positively correlated with LEDD in PD patients (p = 0.015, Fig. 1C) with a significant effect of age and sex (all p < 0.05, Table S1), while no such correlation was found for mtDNA copy number and LEDD (Table S1). Furthermore, disease duration (number of years since the PD diagonised) was positively correlated with disease severity measured by Hoehn and Yahr (p = 0,005, Fig. 2), telomere length (p = 0.002) and LEDD (p < 0.001) after accounting for age and sex. However, disease duration was not correlated with mtDNA copy number in PD patients (p = 0.499), when controlling for age and sex (Table S2). However, there was no correlation of mtDNA copy number and telomere length in PD with any studied clinical parameter (MDS-UPDRS III, Hoehn and Yahr, MADRS, HADS-Anxiety, HADS-Depression and MoCA; all p > 0.05, data Table S3).
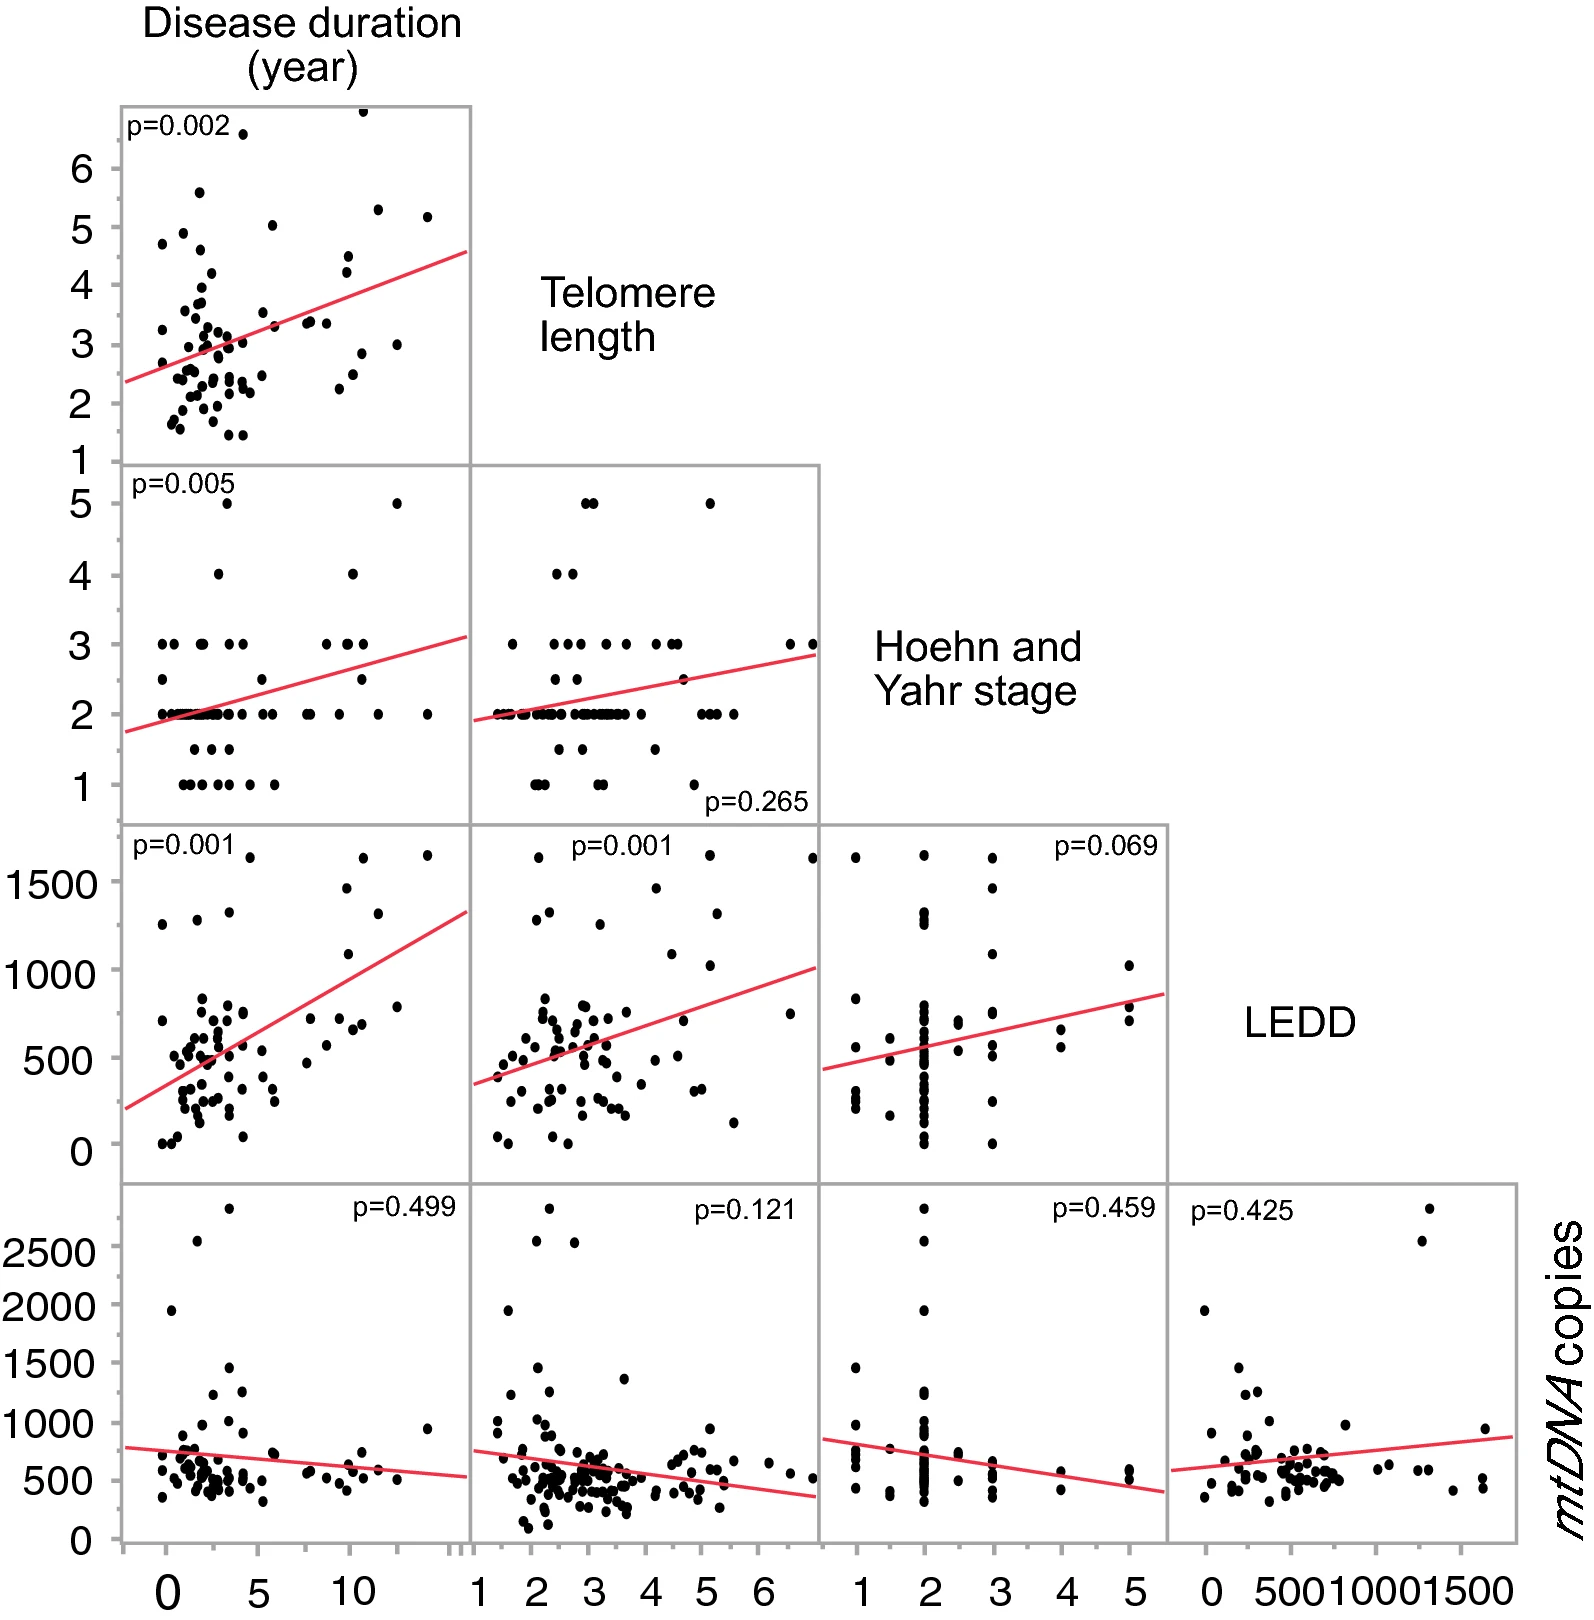
Correlation between Disease duration (number of years since the PD diagnosed), telomere length, disease severity (Hoehn and Yahr), Levodopa Equivalent Daily Dose (LEDD) and mitochondria copy number. P values are reported from multivariate annova, test including age and sex as co-factors in the model.
Senescence biomarkers in brain tissue
To assess whether our findings in whole blood DNA are comparable to patient’s prefrontal cortex tissue, we studied the mtDNA copy number and telomere length in brain tissue from patients with PD, PDD, DLB and healthy controls. Our multivariate regression model shows that patients had significantly lower mtDNA copy number in prefrontal cortex tissue, compared to controls (Est. = 5075.89, SE = 1016.04, df = 3, t = 5.00, p < 0.001, Fig. 3A), with no significant effect of age (Est. = 125.71, SE = 94.54, df = 50, t = 1.33, p = 0.189) and sex (Est. = 155.95, SE = 622.2, df = 1, t = 0.25, p = 0.803). Comparison of the groups was further explored using a multiple comparison test (Tukey’s test), which showed that both PDD and DLB had significantly lower mitochondrial copy number (88.9% and 95.6%, respectively) compared to controls (all p < 0.05, Table 1). Furthermore, mtDNA copy number was 91.8% lower in DLB compared to PD (p = 0.011, Table 1).
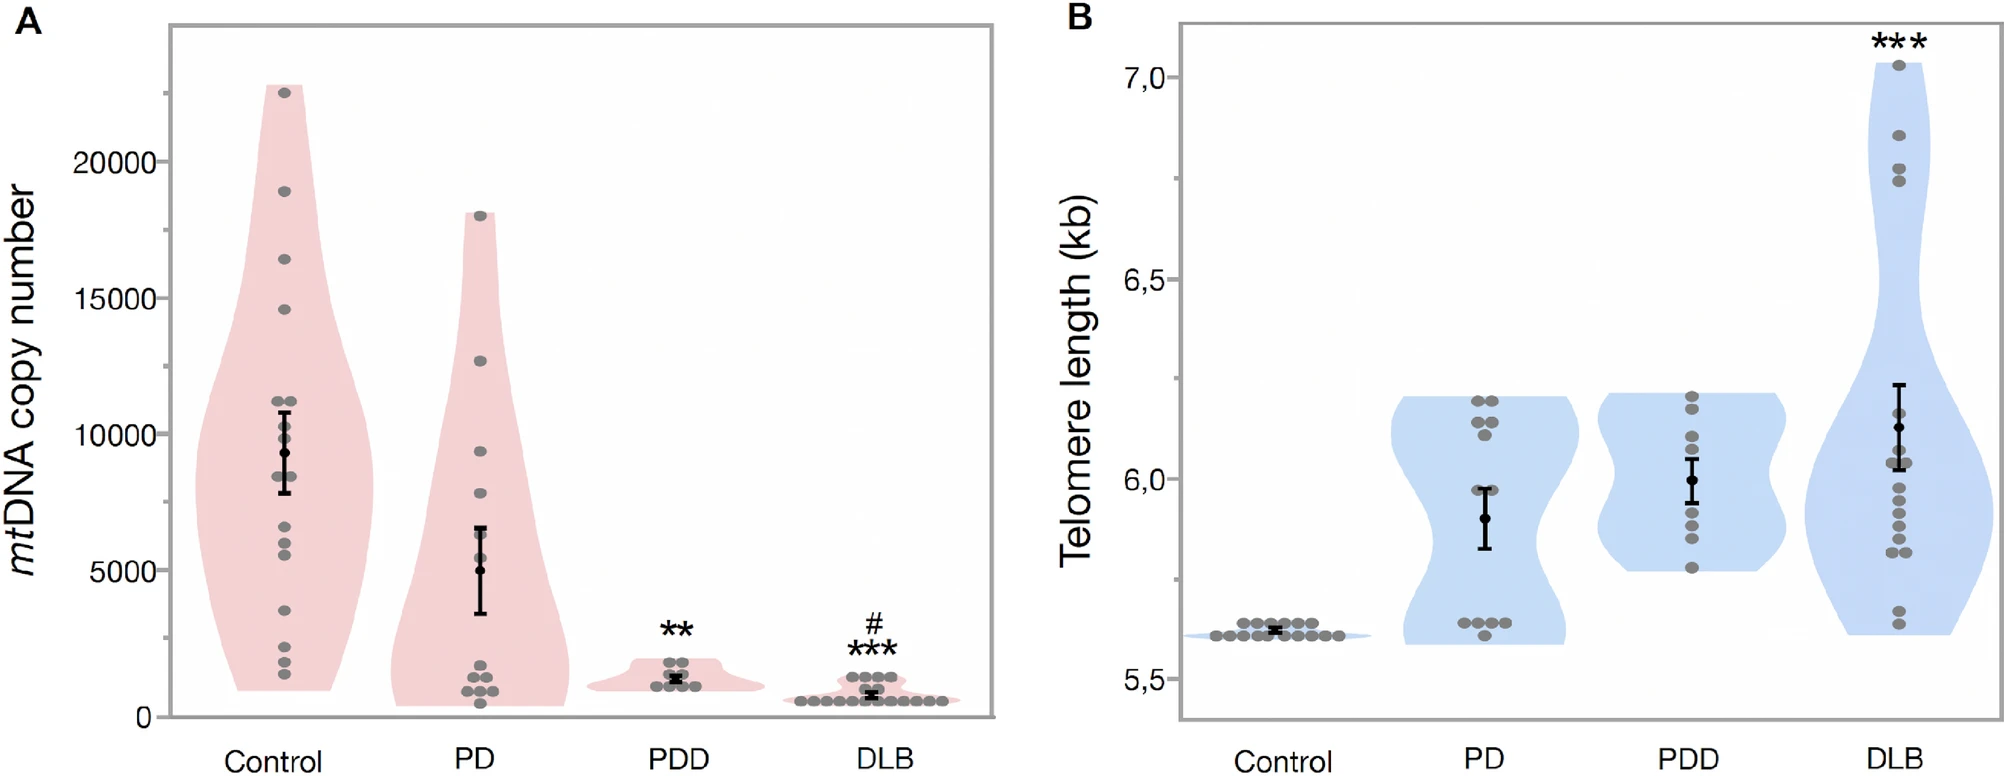
Mitochondrial DNA copy number and telomere length in prefrontal cortex tissue. (A) Mean MtDNA copy number in controls (9357.3 ± 1487.4), PD (5015.5 ± 1578.8), PDD (1036.4 ± 119.3) and DLB (410.7 ± 71.3). (B) Mean telomere length in control (5.60 ± 0.001 kb), PD (5.89 ± 0.07 kb), PDD (5.99 ± 0.01 kb) and DLB (6.12 ± 0.10 kb). Data are presented as mean ± SE. Controls vs patients, p < 0.05 = *, p < 0.005 = **, p < 0.0005 = *** and PD versus PDD/DLB, p < 0.05 = #, p < 0.005 = ##.
| Condition | Condition | Mean diff | SE | t ratio | Adj. p value | Lower 95 | Upper 95 |
|---|---|---|---|---|---|---|---|
| mtDNA copy number | |||||||
| Control | PD | 3584.95 | 1732.17 | 2.07 | 0.177 | 105.79 | 7064.12 |
| Control | PDD | 7471.8 | 1980.2 | 3.77 | 0.002 | 3494.46 | 11,449.16 |
| Control | DLB | 9246.82 | 1498.03 | 6.17 | < 0.001 | 6237.92 | 12,255.73 |
| PD | PDD | 3886.85 | 1962.35 | 1.98 | 0.208 | − 54.64 | 7828.35 |
| PD | DLB | 5661.87 | 1754.23 | 3.23 | 0.011 | 2138.39 | 9185.35 |
| PDD | DLB | 1775.01 | 2012.81 | 0.88 | 0.382 | − 2267.84 | 5817.87 |
| Telomere length | |||||||
| Control | PD | − 0.22 | 0.125 | − 1.76 | 0.303 | − 0.473 | 0.032 |
| Control | PDD | − 0.322 | 0.136 | − 2.37 | 0.097 | − 0.596 | − 0.048 |
| Control | DLB | − 0.514 | 0.101 | − 5.06 | < 0.001 | − 0.718 | − 0.309 |
| PD | PDD | − 0.101 | 0.131 | − 0.77 | 0.866 | − 0.365 | 0.162 |
| PD | DLB | − 0.293 | 0.124 | − 2.35 | 0.100 | − 0.544 | − 0.042 |
| PDD | DLB | − 0.191 | 0.135 | − 1.42 | 0.496 | − 0.464 | 0.08 |
| PGC1 α | |||||||
| Control | PD | 0.463 | 0.257 | 1.8 | 0.282 | − 0.05 | 0.976 |
| Control | PDD | − 0.053 | 0.213 | − 0.25 | 0.994 | − 0.479 | 0.372 |
| Control | DLB | 0.007 | 0.206 | 0.04 | 0.999 | − 0.405 | 0.420 |
| PD | PDD | − 0.516 | 0.226 | − 2.28 | 0.113 | − 0.969 | − 0.063 |
| PD | DLB | − 0.455 | 0.234 | − 1.94 | 0.221 | − 0.924 | 0.013 |
| PDD | DLB | 0.060 | 0.186 | 0.33 | 0.987 | − 0.311 | 0.432 |
| PGC − 1β | |||||||
| Control | PD | 0.531 | 0.182 | 2.91 | 0.024 | 0.166 | 0.895 |
| Control | PDD | 0.395 | 0.149 | 2.65 | 0.048 | 0.097 | 0.694 |
| Control | DLB | 0.355 | 0.147 | 2.41 | 0.085 | 0.060 | 0.649 |
| PD | PDD | − 0.135 | 0.161 | − 0.84 | 0.835 | − 0.457 | 0.186 |
| PD | DLB | − 0.176 | 0.166 | − 1.06 | 0.717 | − 0.509 | 0.156 |
| PDD | DLB | − 0.040 | 0.130 | − 0.31 | 0.989 | − 0.300 | 0.219 |
| CDKN2A | |||||||
| Control | PD | − 0.041 | 0.373 | − 0.11 | 0.999 | − 0.786 | 0.702 |
| Control | PDD | 0.057 | 0.318 | 0.18 | 0.997 | − 0.577 | 0.692 |
| Control | DLB | − 1.012 | 0.301 | − 3.36 | 0.006 | − 1.613 | − 0.411 |
| PD | PDD | 0.099 | 0.327 | 0.30 | 0.990 | − 0.554 | 0.752 |
| PD | DLB | − 0.970 | 0.330 | − 2.94 | 0.022 | − 1.630 | − 0.311 |
| PDD | DLB | − 1.069 | 0.269 | − 3.97 | 0.001 | − 1.607 | − 0.532 |
Multi comparison (post hoc Tukey analysis) of mtDNA copy number, telomere length, PGC1a, PGC1b and CDKN2A between patient and controls in brain tissues.
Significant are in value [bold].
Telomere length in prefrontal cortex tissue was significantly longer in patients than controls (Est. = − 0.264, SE = 0.071, df = 3, t = − 3.68, p < 0.001, Fig. 3B) with no significant effect of age (Est. = − 0.007, SE = 0.006, df = 47, t = − 1.09, p = 0.280) and sex (Est. = 0.022, SE = 0.043, df = 1, t = 0.51, p = 0.611). Further group comparison (Tukey’s test) showed that the DLB group had significantly longer telomere length (9%) compared to controls (p < 0.05, Table 1). However, there was only a tendency of longer telomeres in the PDD group compared to controls (p = 0.097, Table 1).
Next, we studied mitochondrial biogenesis (PGC-1α and PGC-1β) and cellular senescence (CDKN2A) gene expression in prefrontal cortex tissue. Our multivariate analysis did not show a significant difference between patients and controls for PGC-1α gene expression (Est. = 0.014, SE = 0.141, df = 3, t = 0.74, p = 0.464, Fig. 4A) with no significant effect of age (Est. = 0.012, SE = 0.011, df = 64, t = 1.01, p = 0.316) and sex (Est. = 0.041, SE = 0.082, df = 1, t = 0.50, p = 0.620). Further group comparison with Tukey’s test showed similar results (Table 1). PGC-1βexpression was significantly lower in patients (Est. = 0.320, SE = 0.100, df = 3, t = 3.19, p = 0.002, Fig. 4B) with no significant effect of age (Est. = 0.002, SE = 0.008, df = 65, t = 0.34, p = 0.735) and sex (Est. = 0.035, SE = 0.057, df = 1, t = 1.62, p = 0.536, Fig. 3B). Further multi comparison test (Tukey) shows that controls have higher PGC-1β expression when compared to PD (p = 0.024), PDD (p = 0.048) and a tendency for DLB group (p = 0.085), (Table 1).
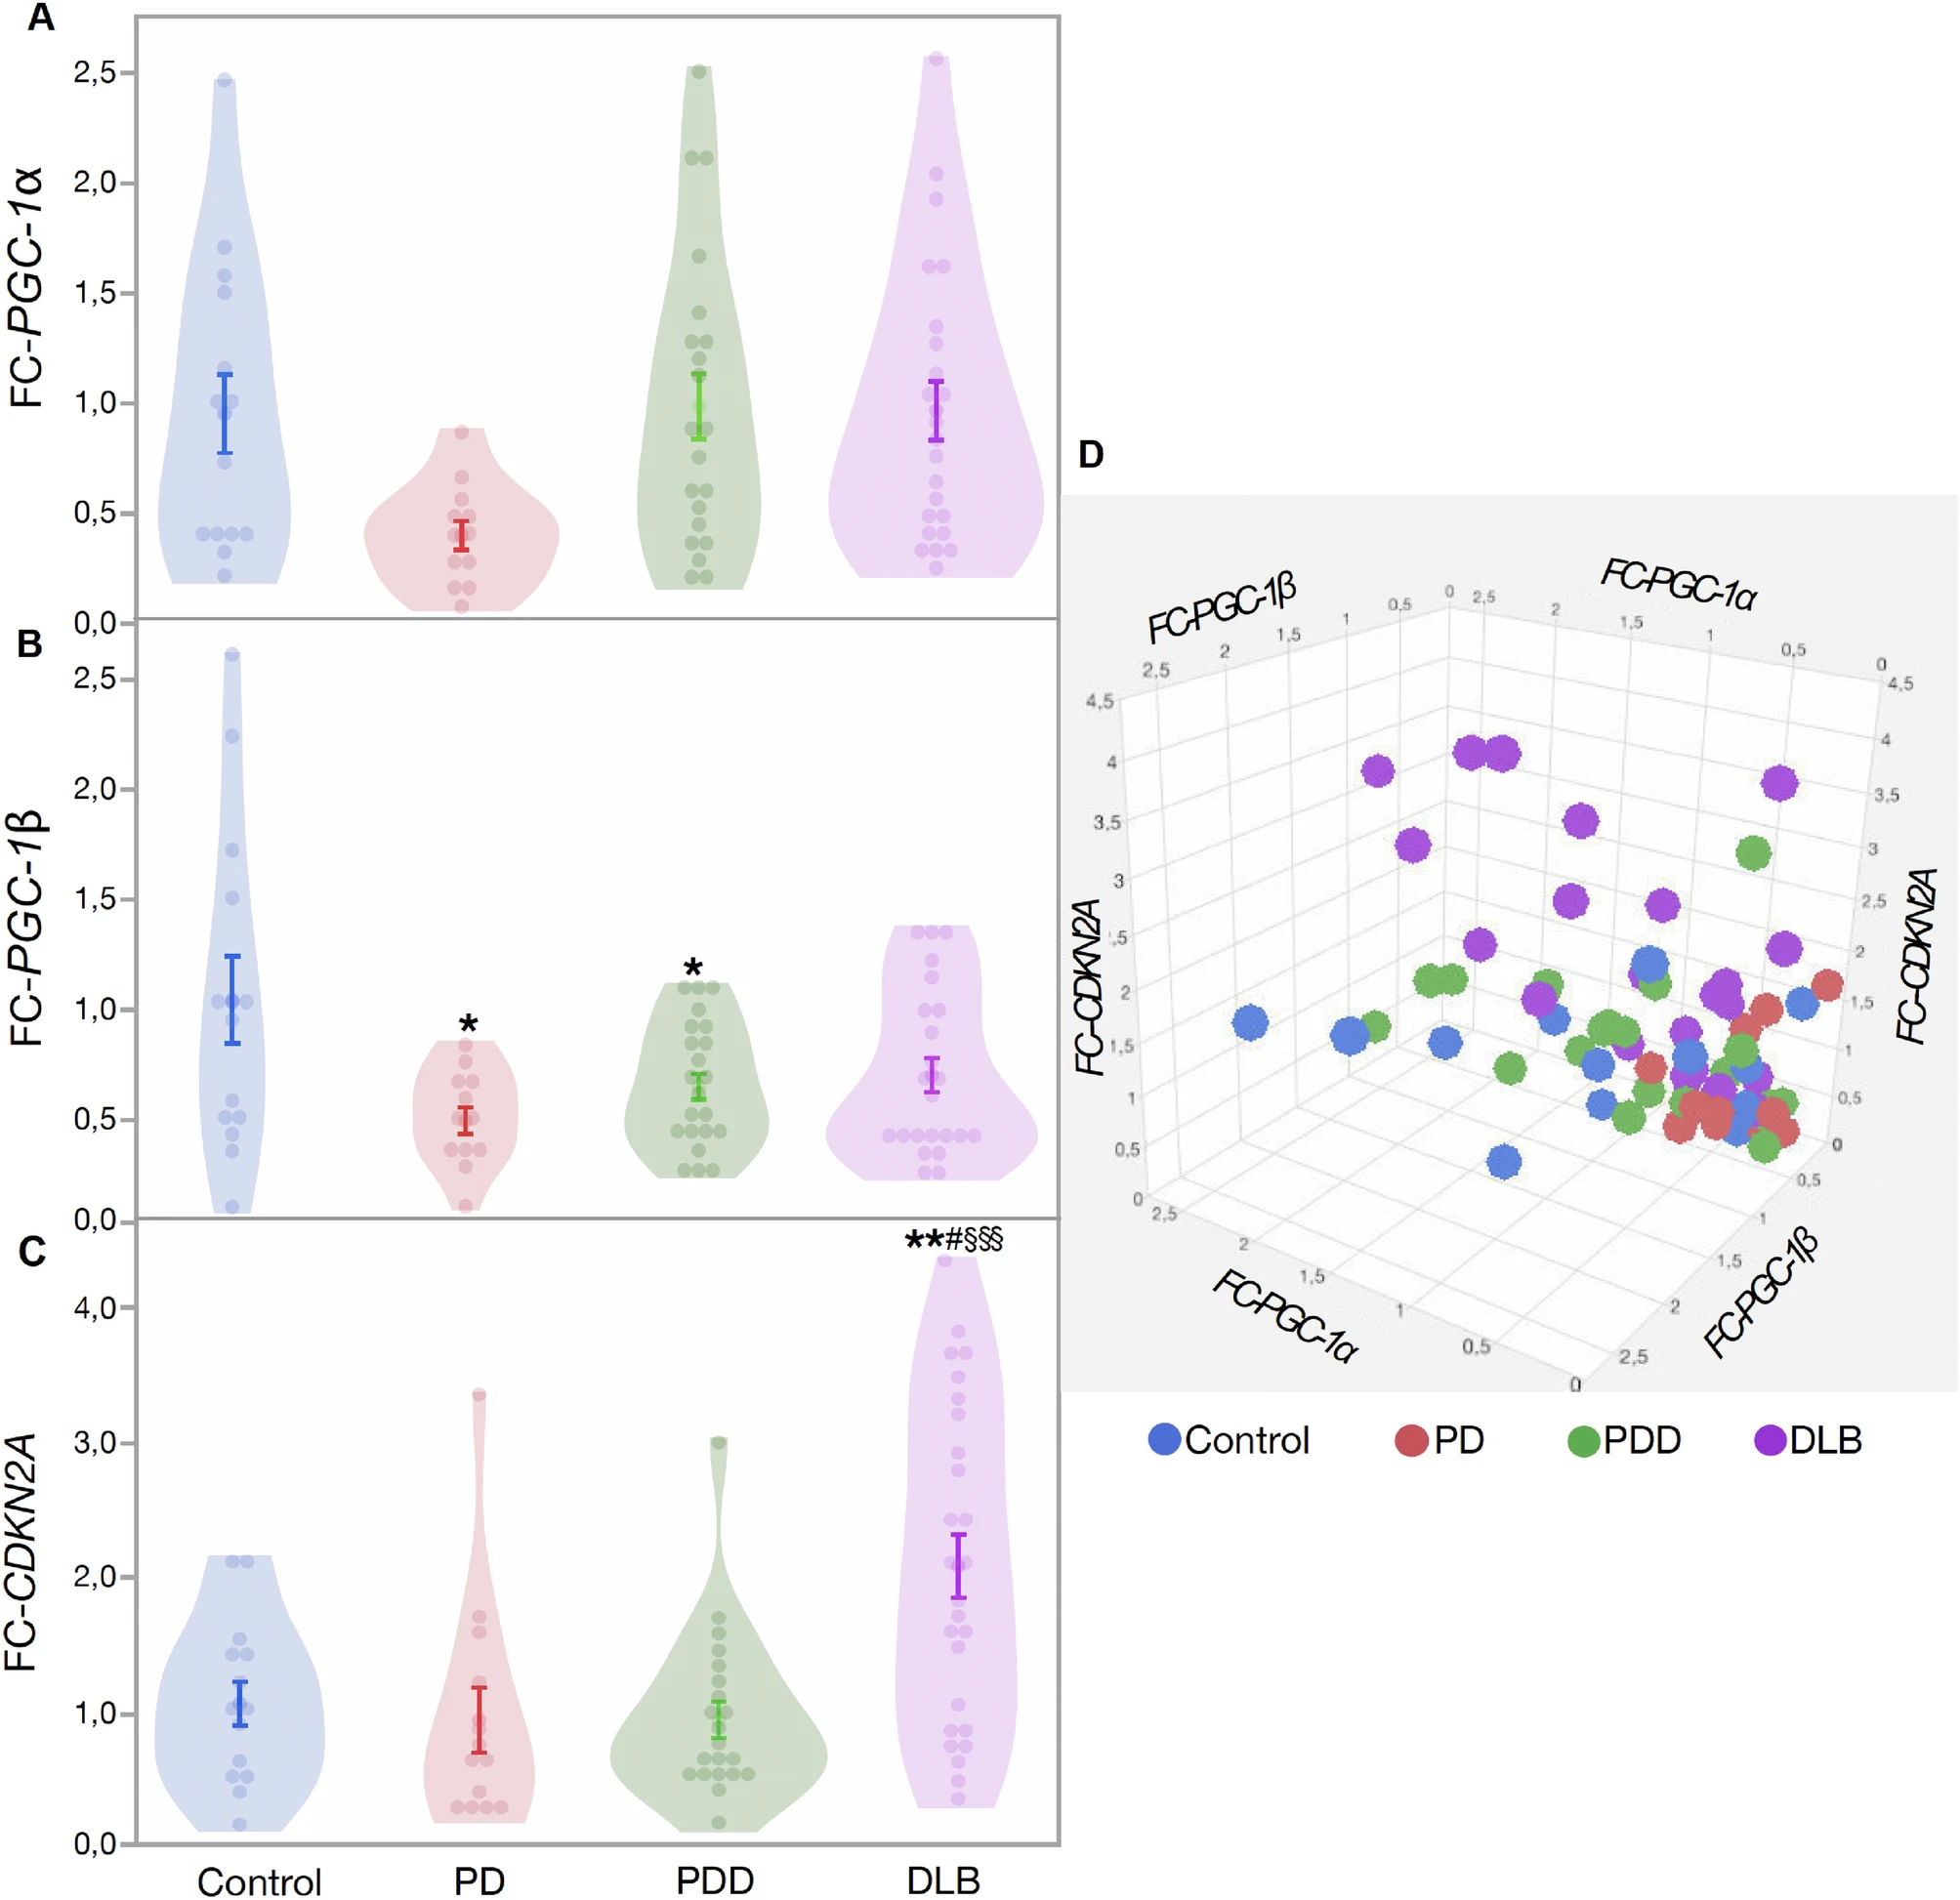
Change in PGC-1α, PGC-1β and CDKN2A gene expression in brain tissues. (A) Fold change of PGC-1α in patients compared to controls, (B) fold change of PGC-1β in patients compared to controls, (C) fold change of CDKN2A in patients compared to controls, (D) 3D graph showing the relation between expression of PGC-1α, PGC-1β and CDKN2A in patients and controls. Data are presented as mean ± SE. Controls versus patients p < 0.05 = *, p < 0.005 = **, p < 0.0005 = ***; PD versus PDD/DLB, p < 0.05 = #, p < 0.005 = ##, p < 0.0005 = ###; PDD versus DLB, p < 0.05 = §, p < 0.005 = §§, p < 0.0005 = §§§.
Overall, CDKN2A expression was not significantly higher in patients compared to controls (Est. = − 0.249, SE = 0.209, df = 3, t = -1.19, p = 0.239, Fig. 4C) with no significant effect of age (Est. = 0.023, SE = 0.017, df = 68, t = 1.35, p = 0.180) and sex (Est. = − 0.008, SE = 0.121, df = 1, t = − 0.07, p = 0.944). When using multiple comparison test (Tukey), the DLB group shows significantly higher CDKN2A expression compared to controls, PD and PDD (all p < 0.05, Fig. 4C, Table 1). Our results show that patient groups (PD, PDD, and DLB) had significantly lower mtDNA copy number and mtDNA biogenesis gene expression levels, but higher cellular senescence gene expression, with DLB showing the strongest effect among all patient groups (Fig. 4D). To further investigate the correlation between different variables, we pooled all the patient data to increase our sample size. In patients, telomere length was negatively correlated with mitochondrial copy number (r2 = 0.167, N = 36, p = 0.012) and positively correlated with CDKN2A expression (r2 = 0.286, N = 18, p = 0.018), while PGC-1α and PGC-1βwere positively correlated with each other (r2 = 0.543, N = 55, p < 0.001).
Discussion
Using blood and prefrontal cortex brain tissues from two different cohorts we show that mitochondrial dysfunction (mtDNA copy number and mitochondria biogenesis gene expression) and cellular senescence, but not telomere shortening is associated with neurodegenerative diseases (PD, PDD and DLB). Our results suggest that mitochondrial dysfunction (copy number and biogenesis) in blood might be a valuable marker to assess the early risk of PD.
A single mitochondrion contains 2–10 copies of mtDNA, depending on the type of cell and tissue24. Under healthy circumstances, human cells contain thousands of copies of mtDNA that are usually identical (homoplasmy). However, during infection or disease settings, mtDNA frequently presents a mixture of wild-type mtDNA within each cell25, therefore, mutant mitochondrial genome accumulates in cells over time4. The number of mtDNA copies increases with age, as a compensatory mechanism, which maintains the amount of wild-type mtDNA and reverses the effect of defective mitochondria accumulation26. However, this compensatory mechanism declines in PD resulting in exhaustion of mtDNA copies, which, in turn, leads to respiratory deficiency in dopaminergic neurons26. Here, we report a significant reduction of mtDNA copy number in both blood and prefrontal cortex brain tissues of PD, PDD and DLB patients, compared to healthy controls (Figs. 1A, 2A). In accordance, previous studies have shown that PD patients have lower mtDNA copy number in blood compared to healthy controls27,28,29. We found similar mitochondrial reduction (20%) in whole blood in PD patients compared to 19.6% in PBMC previously reported by Pyle et al.28. However, we found lower mtDNA copy numbers (46.4%) in prefrontal cortex tissues, while Pyle et al. showed no significant difference of mtDNA copy numbers between PD patients and controls in frontal cortex28. Overall, our results are also in agreement with findings from other neurodegenerative diseases including Alzheimer’s disease (AD) and Huntington’s disease, where mitochondrial dysfunction is observed28,30,31.
Mitochondrial copy number is strongly associated with mitochondrial function, which makes it an important aging marker32. MtDNA mutation and mitochondrial dysfunction, respectively, have been associated with neurodegenerative diseases such as PD and AD5,33,34. Our study also shows lower expression of PGC-1β gene (master regulators of mitochondrial biogenesis) in brain tissues of PD, PDD and DLB patients compared to healthy controls (Fig. 4B), However, the expression level of PGC-1α was similar between patients and controls. A recent study by Dölle et al. 2016 also showed no difference in PGC-1α between PD patients and controls35. Lack of of PGC-1α correlation could be explained due to the fact that PGC-1α also influences the expression of several other genes involved in metabolic pathways36, and therefore its expression might be highly regulated to avoid its deleterious side effects. Our study suggests that both lower mtDNA copy number and expression of PGC-1β in PD, PDD and DLB might indicate dysfunctional mitochondria in patients. An alternative explanation of low mitochondrial content could be due the presence a of high proportion of mutant mitochondrial genome. Future studies characterizing the mitochondrial genome into mutant and wild-type can further explain the mitochondrial role in neurodegenerative diseases.
Our results show that PD patients have longer telomeres in blood compared to healthy controls (Fig. 1B). We found similar results in brain tissues where PD, PDD and DLB patients show longer telomeres compared to healthy controls (Fig. 3B). These results were contrary to our expectations as we expected that patients would show shorter telomeres compared to controls. So far, previous literature has shown mixed results, no association of telomere length with PD in blood37,38,39,40,41 and brain tissue42. However, a study by Maeda et al., 2012, from Japanese women reported shorter blood telomere length in PD patients43. Similarly, DLB patients have been shown to have shorter telomeres compared to controls44. However, a recent nested case control study showed a positive association between PD and longer telomere length in leukocytes and PBMCs, where men with shorter telomere length were of lower risk of getting diagnosed with PD45. Furthermore, Degerman et al. 2014 reported that PD patients who developed dementia within three years after diagnosis had longer telomere length at diagnosis compared to the other PD patients without early development of dementia37.
Contradictory results of telomere association with PD could be due to the heterogeneity of the study setup (cross sectional vs nested case control), sample heterogeneity, quality and cell composition within each tissue, or differential methods for assessing telomere length. An alternative explanation could be the effect of PD medication on telomere length. Interestingly, our results show that blood telomere length was significantly positively correlated with Levodopa Equivalent Daily Dose (LEDD) medication in PD patients. Furthermore, we found a positive correlation of telomere length with disease duration (years since PD diagnosis) in PD patients, which may further reflect the cumulative effect of LEDD on telomere length. Previously it has been shown that Levodopa moderately induces nerve growth factor and growth hormone46. In addition, Levodopa increased homocysteine, which in turn may accelerate aging processes, such as neuropathy and dementia47. Our results show that disease duration is positively correlated with Levodopa Equivalent Daily Dose LEDD, which in turn positively correlated with telomere length in blood in PD patients. Our results show that DLB patients have longer telomeres in brain tissue than controls and other patient groups. We did not have Levodopa Equivalent Daily Dose (LEDD) nor other clinical information for the brain tissues as we did for the blood samples. We were, therefore, unable to investigate whether this was an effect of the medication, as generally DLB patients are treated with lower LEDD than PD patients. Our study is also limited in terms of varying cell composition within each brain tissue which might also affect our results. Nevertheless, to elucidate the relationship between neurodegenerative diseases and telomere length, and to pinpoint whether short/long telomeres are the cause or consequence of neurodegenerative diseases, a longitudinal study set-up is needed, with well-defined samples.
Here, we show a significantly higher expression of cyclin dependent kinase inhibitor 2A (CDKN2A) in prefrontal cortex brain tissue of DLB patients compared to healthy controls. CDKN2A reflects the increased load of cellular senescence and has been shown to be negatively associated with telomere length15,21,22. A previous study showed that expression of CDKN2A has been associated with mild cognitive decline in aging humans, where CDKN2A expression was positively associated with 3 repeat TAU (microtubule-associated protein) in blood23. However, contrary to previous findings we found a positive correlation between telomere length and CDKN2A expression in PD patients. Mechanisms behind such association are yet to be investigated. One strength of the study is that different tissues were compared (blood vs brain) in Parkinson’s disease (PD). However, it is difficult to obtain large sample sizes when using brain tissue and therefore results should be taken with cautions.
Our results show that mitochondrial DNA copy number and telomere length are not correlated in blood. However, in a previous study with healthy individuals we showed that these two markers were positively correlated48. Telomere-mitochondria axis is argued to compromise metabolism and organ function, where telomere dysfunction triggers P53 and P16, which in turn affect mitochondrial biogenesis49. We show a negative correlation of CDKN2A (P16) expression with mitochondrial copy number in brain tissues. Lack of correlation between telomere length and mitochondria in brain tissues could depend upon frequent mtDNA mutation due to disease, which accumulate over the time25. Hence our primers only capture wild type mitochondria and not all mitochondrial DNA.
In conclusion, our results indicate that mitochondrial dysfunction and cellular senescence might be valuable markers to study neurodegenerative diseases (PD, PDD, DLB). Follow-up studies were more individuals, particularly healthy controls, are important to perform. The identification of blood biomarkers in neurodegenerative diseases could potentially facilitate the drug development process, as the utility of measuring such markers in the brain is limited. Our findings further extend our knowledge that mitochondrial copy number and function could be a viable biomarker in blood as an early indicator for the risk of neurodegenerative diseases.