
Excessive proteostasis contributes to pathology in fragile X syndrome

By Susana R. Louros, Sang S. Seo, Beatriz Maio, Cristina Martinez-Gonzalez, Miguel A. Gonzalez-Lozano, Melania Muscas, Nick C. Verity, Jimi C. Wills, Ka Wan Li, Matthew F. Nolan, and Emily K. Osterweil
Excerpt from the article published in Neuron, 9 December 2022, ISSN 0896-6273,
DOI: https://doi.org/10.1016/j.neuron.2022.11.012.
Editor’s Highlights
- Fragile X syndrome (FX) is a neurodevelopmental disorder that arises from transcriptional silencing of the FMR1 gene and subsequent loss of the RNA-binding protein fragile X messenger ribonucleoprotein (FMRP).
- Studies of Fmr1 mutant animal models have identified alterations in plasticity and excitability in a number of different brain circuits, with several studies identifying excessive protein synthesis as a key contributor.
- Increased protein synthesis seen in Fmr1−/y brain does not result in a general accumulation of proteins at synapses.
- Increased activity of the ubiquitin proteasome system (UPS) is a pathological adaptation that accompanies excess protein synthesis in FX, and this can be targeted to correct multiple deleterious changes.
Authors’ Highlights
- Elevated UPS activity drives excessive protein degradation in Fmr1−/y synapses
- Excessive protein synthesis and degradation are coupled in Fmr1−/y neurons
- Normalizing UPS activity corrects hyperexcitability in Fmr1−/yinferior colliculus
- Pharmacological or genetic UPS reduction prevents audiogenic seizures in Fmr1−/y mice
Summary
In fragile X syndrome (FX), the leading monogenic cause of autism, excessive neuronal protein synthesis is a core pathophysiology; however, an overall increase in protein expression is not observed. Here, we tested whether excessive protein synthesis drives a compensatory rise in protein degradation that is protective for FX mouse model (Fmr1−/y) neurons. Surprisingly, although we find a significant increase in protein degradation through ubiquitin proteasome system (UPS), this contributes to pathological changes. Normalizing proteasome activity with bortezomib corrects excessive hippocampal protein synthesis and hyperactivation of neurons in the inferior colliculus (IC) in response to auditory stimulation. Moreover, systemic administration of bortezomib significantly reduces the incidence and severity of audiogenic seizures (AGS) in the Fmr1−/y mouse, as does genetic reduction of proteasome, specifically in the IC. Together, these results identify excessive activation of the UPS pathway in Fmr1−/yneurons as a contributor to multiple phenotypes that can be targeted for therapeutic intervention.
Graphical abstract

Introduction
Fragile X syndrome (FX) is a neurodevelopmental disorder affecting 1:4,000 males and 1:8,000 females that arises from transcriptional silencing of the FMR1 gene and subsequent loss of the RNA-binding protein fragile X messenger ribonucleoprotein (FMRP).2,3,4,5 It is associated with a variety of symptoms including intellectual disability, hypersensitivity, ADHD, and epilepsy, and it is the most commonly identified monogenic cause of autism.6,7 Studies of Fmr1 mutant animal models have identified alterations in plasticity and excitability in a number of different brain circuits,8,9,10 with several studies identifying excessive protein synthesis as a key contributor.10,11,12,13,14,15 This has led to the development of therapies that normalize protein synthesis, including metabotropic glutamate receptor 5 (mGlu5) antagonists and inhibitors of the extracellular regulated kinase (ERK) and mammalian target of rapamycin (mTOR) signaling pathways.16,17,18,19
FMRP localizes to polyribosome complexes and has a well-described role in the repression of translation.20,21,22,23 There are over 1,000 identified targets of FMRP, including many that encode critical synaptic proteins, so a key question is whether the phenotypes in FX arise because of an excessive accumulation of proteins encoded by these targets.24,25,26 While previous studies have shown that select targets are overexpressed in Fmr1−/y brain,27,28,29 recent evidence shows that the majority of FMRP target mRNAs are less abundant in the ribosome-bound population and underexpressed in the synapse-enriched proteome of Fmr1−/yhippocampus.25,1,30,31,32 Moreover, proteomics analyses of juvenile and adult Fmr1−/y brain have not identified a global change in protein accumulation to match the 15%–20% increase in protein synthesis.1,33,34,35 This suggests that the increased protein synthesis seen in Fmr1−/y brain does not result in a general accumulation of proteins at synapses.
One possibility for the lack of protein accumulation in Fmr1−/y neurons is that there is a compensatory increase in protein degradation in response to the elevation of protein synthesis, which keeps the steady-state proteome in balance. The major pathway responsible for targeted protein degradation is the ubiquitin proteasome system (UPS), which is composed of a series of ubiquitin ligases that covalently attach ubiquitin molecules to proteins targeted for degradation and the 26S proteasome complex that enzymatically digests these targets.36 The UPS is also a critical regulator of cytoskeletal proteins that regulates dendritic spine morphology, as well as postsynaptic receptors and presynaptic vesicle proteins.37,38,39 As such, it is essential for multiple synaptic and circuit functions including the long-term potentiation and depression (LTP/D) of synaptic strength and the maintenance of homeostatic plasticity.40,41
Here, we show that activity of the proteasome is elevated in Fmr1−/y hippocampal neurons, with a concomitant increase in UPS components observed in neuron-specific translating ribosome affinity purification and RNA sequencing (TRAP-seq) datasets from Fmr1−/y mice. Proteomics analysis of hippocampal slices treated with the proteasome inhibitor MG132 reveals an increase in protein degradation. Pharmacological UPS inhibition normalizes excessive protein synthesis, showing that manipulation of protein degradation can beneficially impact the elevation in translation. Furthermore, systemic administration of the proteasome inhibitor bortezomib (BTZ) normalizes proteasome activity in neurons of the Fmr1−/y inferior colliculus (IC) and prevents the hyperactivation of these neurons in response to sound. Consequently, this treatment significantly reduces the incidence and severity of audiogenic seizures (AGS) in Fmr1−/y mice, as does Psmb5 short hairpin RNA (shRNA) expression in Fmr1−/y IC. Together, these results define excessive protein degradation as a novel cellular pathology that can be targeted for therapeutic intervention in FX.
Results
Proteasome activity and UPS expression are increased in Fmr1−/y neurons
To investigate UPS function in Fmr1−/y neurons, we designed a hippocampal slice assay to measure proteasome activity under the same conditions where excess protein synthesis and electrophysiological changes are observed.11 Hippocampal slices were prepared from littermate Fmr1−/y and wild-type (WT) mice and proteasome activity measured in slice lysates using a fluorescence assay that reports chymotrypsin-like activity with the fluorogenic substrate Suc-LLVY-AMC (Figure 1A).42 Our results show a significant increase in proteasome activity in Fmr1−/y hippocampal slices versus WT (Figure 1B). Incubating slices in the proteasome inhibitor MG132 for 1 h results in a significant reduction in fluorescence in both genotypes, validating this assay as a faithful reflection of the basal proteasome activity in acute brain slices (Figure 1B). Next, to confirm whether the increase in proteasome activity could be localized to synapses where many FX phenotypes are expressed, we performed the same proteasome activity assay on synaptoneurosome fractions isolated from Fmr1−/y versus WT hippocampal slices (Figure 1C). Our results confirm elevated proteasome activity exists in Fmr1−/ysynapses (Figure 1D).

The UPS is elevated in Fmr1−/y neurons
(A) Schematic of proteasome activity assay.
(B) Proteasome activity is increased in Fmr1−/y hippocampal slices and significantly reduced with 1 μM MG132 for 1 h (WT-veh: 100% ± 10%, KO-veh: 134% ± 9.4%; WT-MG: 25.4% ± 1.9%; KO-MG: 30.7% ± 2.3%; ANOVA treatment ∗p < 0.0001; WT-veh vs. KO-veh ∗p = 0.0108, KO-veh vs. KO-MG ∗p < 0.0001, WT-veh vs. WT-MG ∗p < 0.0001; n = 11).
(C) Immunoblot shows enrichment of synaptophysin 1 and PSD95 in synaptoneurosome fractions.
(D) Proteasome activity is increased in Fmr1 −/y synaptoneurosomes (paired t test p = 0.0094, N = 11)
(E) Increased expression of proteasomal subunits Psmb5 and Rpt6 in Fmr1−/y hippocampal slice homogenates (Psmb5: WT: 100% ± 8.7%, KO: 138.4% ± 10.9%, paired t test ∗p = 0.0270, N = 8. 20S: WT: 100% ± 7.1%, KO: 137.5% ± 10.6%, paired t test ∗p = 0.0270, N = 8. 20S: paired t test ∗p = 0.033, N = 9. Rpt6: WT: 100% ± 7.2%, KO: 133.6% ± 6.4%, paired t test ∗p = 0.0175, n = 7).
(F) Increased expression of Psmb5 and Rpt6 in Fmr1−/y synaptoneurosomes (Psmb5: WT: 100% ± 7.1%, KO: 119.7% ± 8.2%, paired t test ∗p = 0.0225, N = 7. Rpt6: WT: 100% ± 6.3%, KO: 128.3% ± 15.9%, paired t test ∗p = 0.0361, N = 6).
(G) Schematic representation of TRAP assay shows isolation of translating ribosomes (IP) from Input using anti-GFP-coated beads.
(H) IP shows enrichment of Snap25 and depletion of Gfap versus Input fraction. (Gfap: IN: 1 ± 0.1, IP: 0.14 ± 0.04, paired t test ∗p < 0.0001, Snap25: ∗paired t test p = 0.006).
(I) Differential expression analysis shows significant upregulation of many transcripts in Fmr1−/y neuron-specific TRAP (red), including UPS-related targets.
(J) GSEA shows upregulation of several UPS terms in the Fmr1−/y neuronal TRAP population.
(K) Examples of UPS-related GO terms show robust population changes of the transcripts involved in the term (Proteasome complex GSEA ∗padj = 0.0008, Protein polyubiquitination GSEA ∗padj = 0.0005).
(L) Significantly upregulated targets include proteasome subunits (e.g., Psmc6, Psmb5, Psmc2), E3 ubiquitin ligases (e.g., Arel1, Rnf114, Rnf180), and related UPS pathway members (e.g., Yod1, Fbxo2).
(M) Excessive protein synthesis in Fmr1−/y hippocampus is corrected with inhibition of the mGlu5-Ras-ERK1/2 pathway.
(N) mGlu5 negative allosteric modulator CTEP (10 μM) significantly reduces proteasome activity in Fmr1−/y slices (WT-veh: 100% ± 4.5%, WT-CTEP: 110.2% ± 5.6%, KO-veh: 125.4% ± 5.3%, KO-CTEP: 96.8% ± 5.5%, ANOVA F(1,10) = 8.71, treatment x genotype ∗p = 0.0145, WT-veh vs. KO-veh ∗p = 0.0211, KO-veh vs. KO-CTEP ∗p = 0.0117, n = 11).
(O) Ras-ERK inhibitor lovastatin (50 μM) significantly reduces proteasome activity in Fmr1−/yslices (WT-veh; 100% ± 4%, WT-lova: 114.4% ± 7.7%, KO-veh: 127.2% ± 5.6%, KO-lova: 106.7% ± 3.1%, ANOVA F(1,10) = 17.93, treatment x genotype ∗p = 0.0017, WT-veh vs. KO-veh ∗p = 0.0009, WT-veh vs. WT-lova ∗p = 0.0326, KO-veh vs. KO-lova ∗p = 0.0056, n = 11).
(P) Protein synthesis inhibitor cycloheximide (60 μM) significantly reduces proteasome activity in Fmr1−/y slices (WT-veh; 100% ± 4.5%, WT-CHX-30’: 93.6% ± 3.3%, WT-CHX-60’: 87.8% ± 3%, KO-veh: 112% ± 3.5%, KO-CHX-30’: 102.9% ± 3.1%, KO-CHX-60’: 88.8% ± 1.7%, ANOVA treatment F(2,10) = 13.08, ∗p = 0.0002, genotype F(1,10) = 14.72, ∗p = 0.0033, treatment x genotype F(2,10) = 3.85, ∗p = 0.0386, WT-veh vs. KO-veh ∗p = 0.0005, WT-CHX-30′ vs. KO-CHX-30’ ∗p = 0.0046, WT-veh vs. WT-CHX-30’ ∗p = 0.0399, WT-veh vs. WT-CHX-60’ ∗p = 0.0005, KO-veh vs. KO-CHX-30’ ∗p = 0.0054, KO-veh vs. KO-CHX-60’ ∗p < 0.0001, n = 11). N = number of littermate pairs. Data presented as mean ± SEM. All immunoblot samples loaded on the same gel but not side-by-side (see STAR Methods). See also Figure S1 and Table S1.
Our next question was whether the proteasome or other members of the UPS system were upregulated in Fmr1−/y neurons. The 26S proteasome is a macromolecular complex with two regulatory complexes (19S) and a cylindrical 20S core composed of multiple subunits, including three that confer catalytic activity (β1, β2, and β5).43 To investigate whether the proteasome was overexpressed, we immunoblotted for the 20S complex as well as the key catalytic subunit Psmb5 (β5) and Rpt6 (encoded by Psmc5), an ATPase subunit of the 19S regulatory particle that has emerged as an important site for regulation of 26S proteasome function in neurons.39,44 Our results show that these proteasome components are significantly overexpressed in Fmr1−/y hippocampus (Figures 1E and S1). To determine whether these changes were localized to synapses, we repeated our immunoblotting on Fmr1−/y synaptoneurosome fractions. These results show the same overexpression of Psmb5 and Rpt6 proteasome subunits in Fmr1−/y synapses (Figures 1F and S1).
We next asked whether the increase in proteasome expression could be seen specifically in neurons and whether this expanded to other UPS pathway members. To answer these questions, we investigated the expression of transcripts encoding UPS components in Fmr1−/y hippocampal neurons by analyzing our recently published TRAP-seq dataset (Figures 1G, 1H, and S1).1 This dataset was generated using littermate WT and Fmr1−/y mice bred to be heterozygous for Snap25-EGFP/Rpl10a, resulting in a pan-neuronal expression of EGFP-tagged ribosomes. RNA-sequencing was performed on transcripts isolated from EGFP-tagged ribosomes in WT and Fmr1−/y animals, and DESeq2 analysis showed that 57 of the 640 transcripts upregulated at p < 0.05 in the Fmr1−/y fraction were UPS components1 (Figure 1I). Furthermore, a gene set enrichment analysis (GSEA) showed that 20 out of the 122 gene sets significantly upregulated in Fmr1−/y TRAP are related to proteasome and ubiquitin ligase function (p value adjusted [padj] < 0.1) (Figures 1J–1L and Table S1).1 A similar upregulation of UPS terms was seen in a CA1-specific TRAP-seq dataset from Fmr1−/y hippocampus published in Thomson et al.30 Indeed, 13 of the 19 UPS-related gene sets significantly upregulated in the Fmr1−/y Snap25-TRAP dataset were also increased in the Fmr1−/yCA1-TRAP dataset (Figure S1). These results indicate a general upregulation of the UPS pathway in Fmr1−/y neurons in the hippocampus.
Increased proteasome activity is downstream of excessive protein synthesis in Fmr1−/y hippocampus
A major function of the UPS is in co-translational quality control to prevent the creation of misfolded or otherwise malfunctional proteins.45,46,47 We therefore wondered if the elevated proteasome activity we observed in Fmr1−/y neurons was related to the increased rate of protein synthesis. To test this possibility, we examined the impact of multiple compounds that normalize translation in the Fmr1−/y hippocampus. Previous studies have shown that inhibition of mGlu5corrects hippocampal protein synthesis in the Fmr1−/y mouse (Figure 1M).11,17,48 To investigate whether this treatment normalized proteasome activity, we incubated WT and Fmr1−/y slices in 10 μM of the mGlu5 negative allosteric modulator CTEP for 1 h, a treatment previously shown to correct protein synthesis.17 Our results reveal that inhibition of mGlu5 corrects the elevated proteasome activity in the Fmr1−/y hippocampus (Figure 1N). Next, we tested the statin drug lovastatin, which has been shown to normalize protein synthesis in FX animal models via reduction of Ras-ERK signaling.18,49 Our results show that incubation of 50 μM lovastatin, a dose that corrects protein synthesis, is sufficient to normalize proteasome activity in the Fmr1−/y to WT levels (Figure 1O).
Both CTEP and lovastatin have a selective impact on protein synthesis in the Fmr1−/yhippocampus because of a hypersensitivity to the mGlu5-ERK pathway.11 However, these compounds impact more than translation, and we therefore tested whether incubation with the protein synthesis inhibitor cycloheximide (CHX) would similarly correct the elevated proteasome activity. Our results show that 60 μM CHX reduces proteasome activity in both genotypes; however, the effect is greater in the Fmr1−/y hippocampus (Figure 1P). This results in a normalization of proteasome activity in Fmr1−/y hippocampus to WT levels by 60 min. Together, these results show that the elevation in proteasome activity is downstream of the excessive synthesis of new proteins in Fmr1−/y neurons.
Synaptic proteins are excessively degraded in Fmr1−/y neurons
A predicted consequence of an increased rate of degradation in the Fmr1−/yhippocampus, where protein synthesis is similarly increased, is that there should be an accumulation of proteins upon application of a proteasome inhibitor. To test this, we prepared hippocampal slices from WT and Fmr1−/y littermates and incubated in vehicle or 1 μM of the proteasome inhibitor MG132 for 90 min (Figure 2A). Although this timescale could lead to the identification of proteins with a relatively fast turnover, proteasome inhibition on this timescale has been shown to significantly alter the mGluR-LTD and epileptiform activity that are exaggerated in Fmr1−/y hippocampus.50,51 Post-nuclear P2 fractions were prepared from treated hippocampal slices to enrich for changes at synapses, and these samples were then processed for label-free mass spectroscopy (MS) (Figures 2A and S2). Synaptic enrichment was confirmed by the increased expression of PSD95 and exclusion of nuclear marker histone H3 in these fractions (Figure S2). Immunoblotting for K48 ubiquitin, which is specifically associated with targets bound for proteasomal degradation, confirmed a significant build-up in MG132-treated slices (Figure S2).
Protein degradation is excessive in Fmr1−/y hippocampal synapses
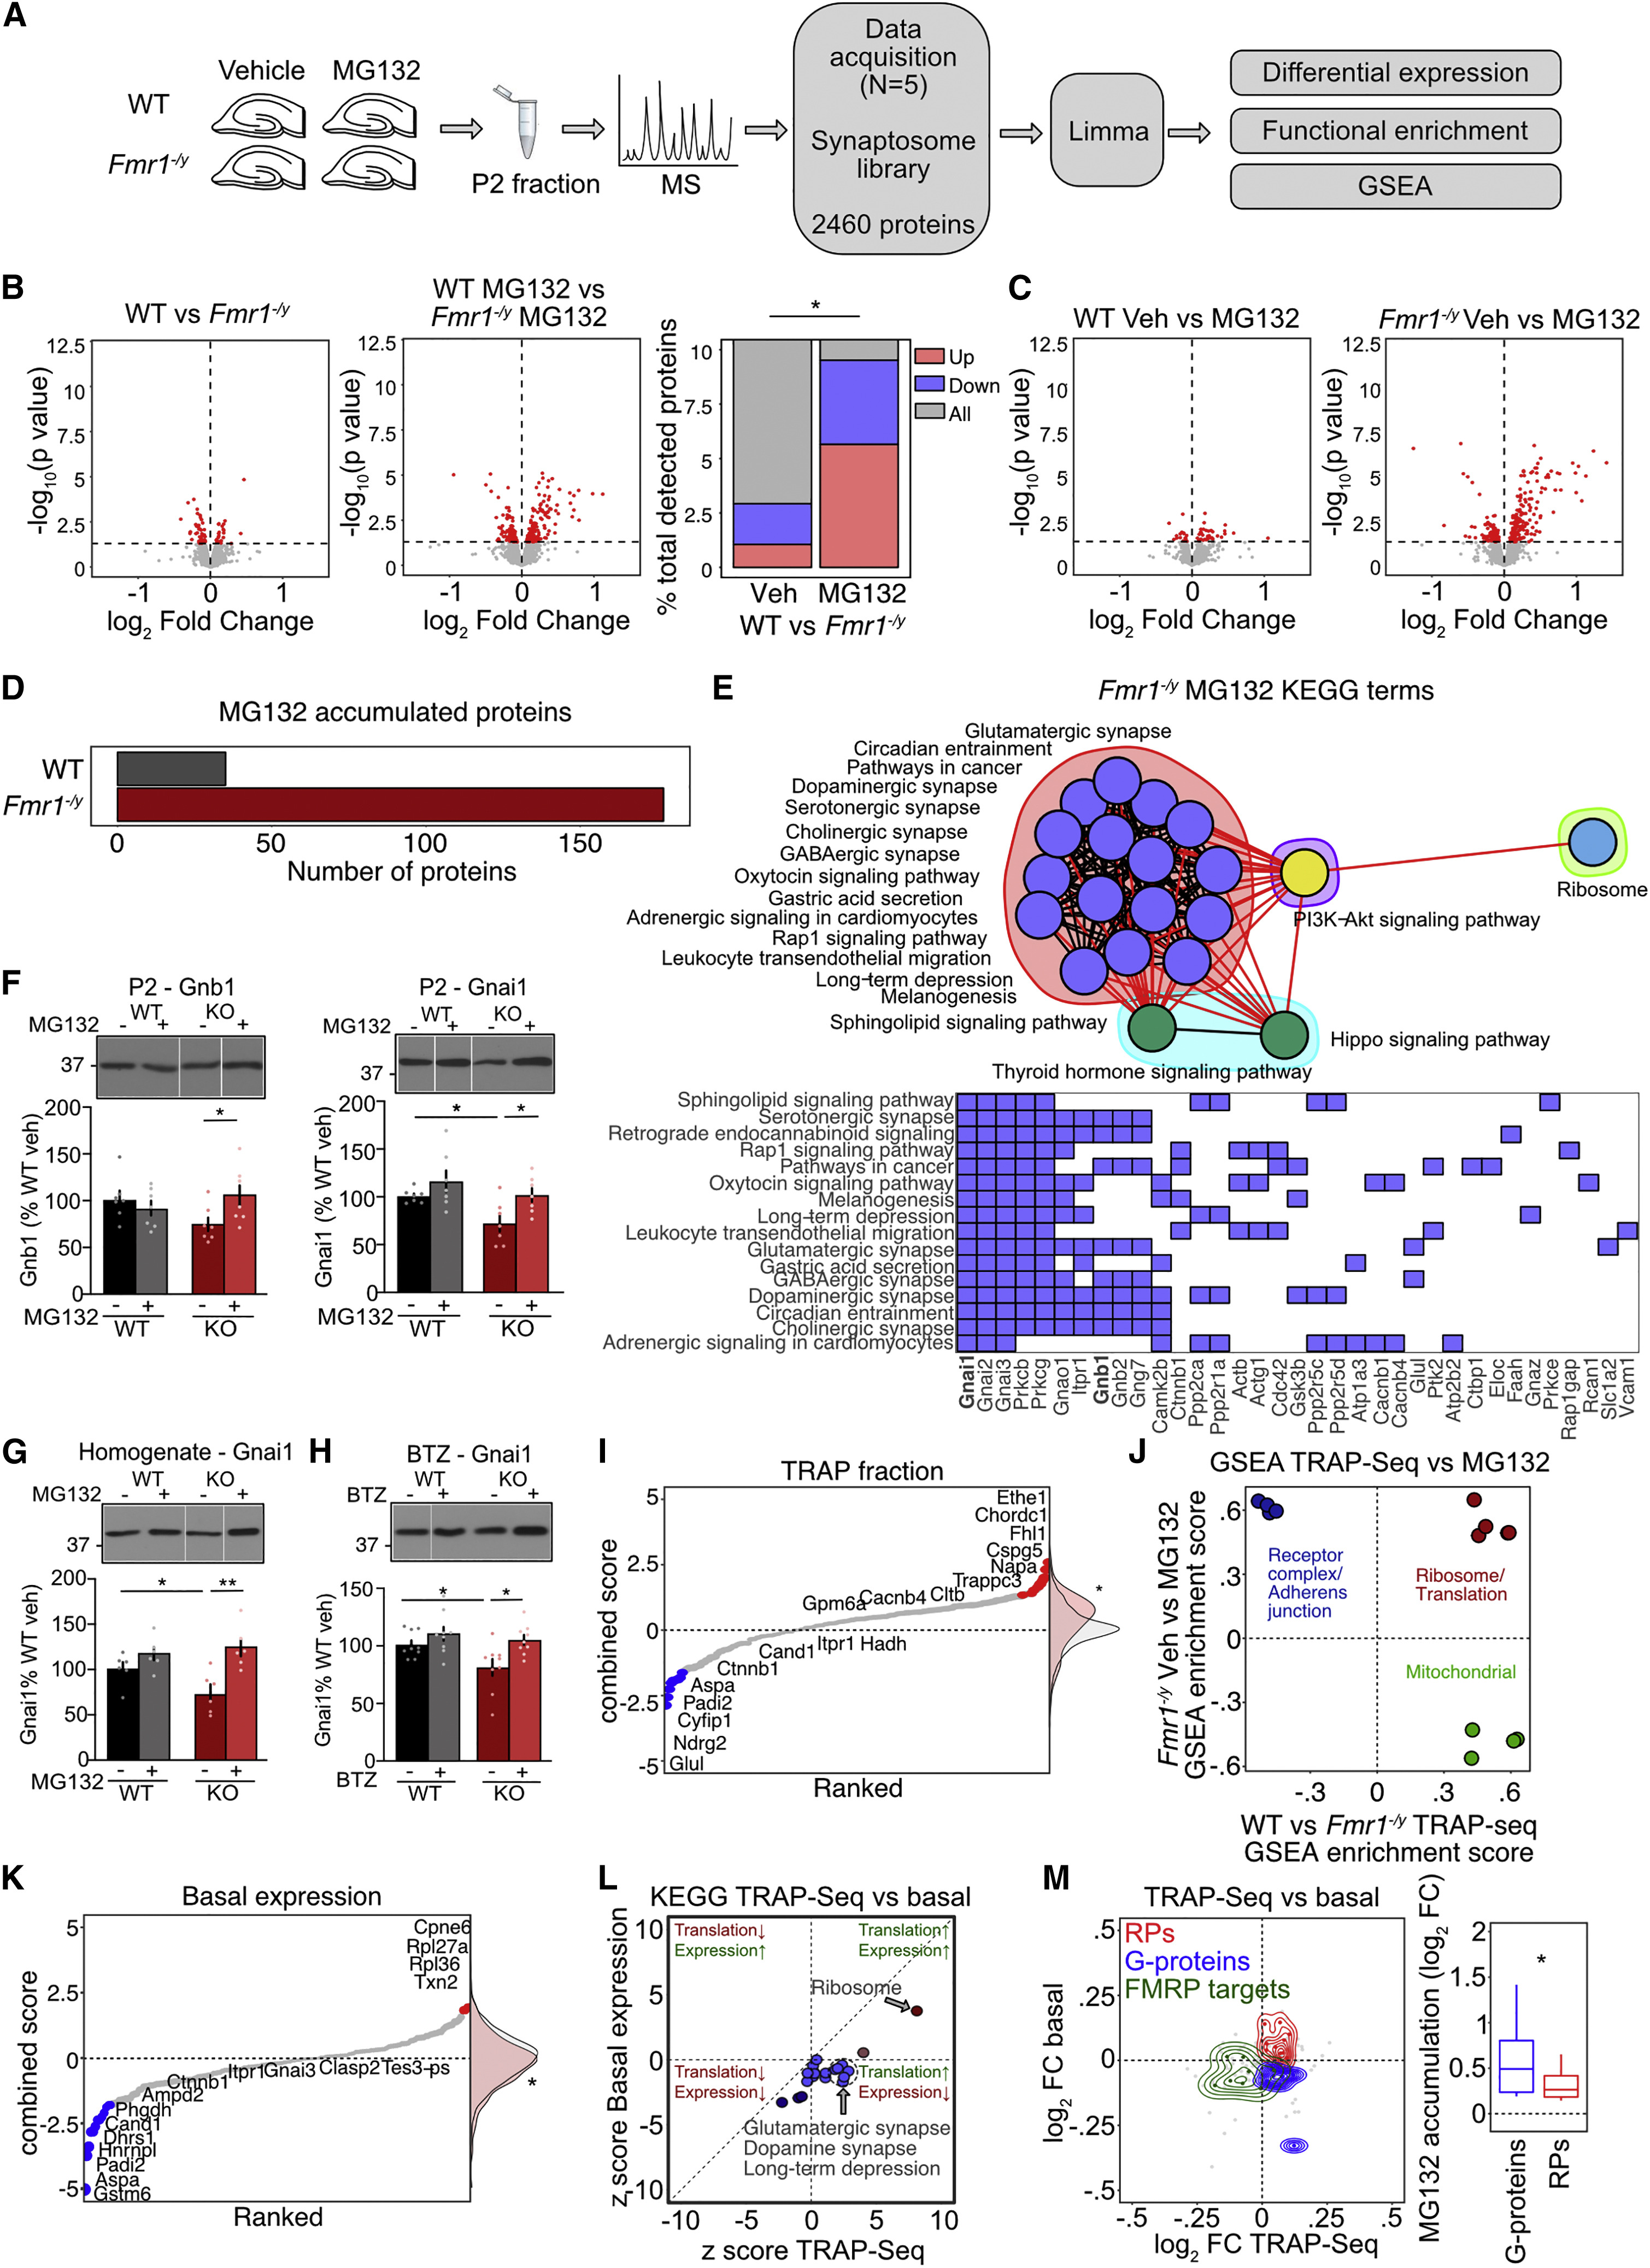
(A) Hippocampal slices from 5 Fmr1−/y/WT littermate pairs were incubated in proteasome inhibitor MG132 for 90 min and synapse-enriched P2 fractions isolated submitted for MS.
(B) Volcano plots showing differential expression with significantly changed proteins (p < 0.05) in red. The accumulation of proteins with MG132 in Fmr1−/y is significantly greater than WT (χ2 = 100.1, ∗p < 2.2 × 10⁻¹⁶).
(C) Volcano plots showing differential expression with significantly changed proteins (p < 0.05) in red.
(D) MG132 treatment results in significant buildup of more proteins in Fmr1−/y vs. WT (WT = 35, Fmr1−/y = 177).
(E) A cluster analysis of enriched KEGG pathways in the MG132-accumulated population in the Fmr1−/y (i.e., degrading population) shows 4 distinct clusters: Synaptic, Hippo/Thyroid signaling, PI3K-Akt signaling, and Ribosome. Red lines denote inter-cluster connections and black lines denote intra-cluster connections. Significantly changed genes that identify individual KEGG pathways are shown.
(F) Immunoblotting confirms that Gnb1 is significantly accumulated in Fmr1−/y with MG132 treatment (WT-veh 100% ± 8.1%, KO-veh: 74.6% ± 6.6%; WT-MG: 90.8% ± 7.3%; KO-MG: 105.9% ± 10.6%, ANOVA genotype x treatment F(1,6) = 7.52, ∗p = 0.0336; KO-veh vs. KO-MG ∗p = 0.0242; n = 7 littermate pairs), as is Gnai1 (WT-veh 100% ± 2.7%, KO-veh 71.8% ± 8.5%; WT-MG: 115.5% ± 11.1%; KO-MG: 101.2% ± 7.2%, ANOVA genotype F(1,6) = 6.297, ∗p = 0.0459; WT-veh vs. KO-veh ∗p = 0.0174, KO-veh vs. KO-MG ∗p = 0.0148; n = 7).
(G) Gnai1 accumulation with MG132 treatment is similarly seen in homogenate fractions from Fmr1−/y slices (WT-veh 100% ± 7.3%, KO-veh: 72.1% ± 9.6%; WT-MG: 117.1% ± 7.5%; KO-MG: 124.1% ± 9.98%, ANOVA genotype x treatment F(1,5) = 8.12, ∗p = 0.0358; WT-veh vs. KO-veh ∗p = 0.0465, KO-veh vs. KO-MG ∗p = 0.0037; n = 6).
(H) Hippocampal slices were treated with 3 nM BTZ and homogenates immunoblotted for Gnai1. Results show BTZ results in a significant accumulation of Gnai1 in Fmr1−/y slices, similar to what is seen with MG132 (WT-veh 100% ± 3.7%, KO-veh: 79.6% ± 7.1%; WT-BTZ: 109.3% ± 5.8%; KO-BTZ: 103.1% ± 4.2%, ANOVA treatment F(1,8) = 5.45, ∗p = 0.0479, genotype F(1,8) = 6.23, ∗p = 0.0371; WT-veh vs. KO-veh ∗p = 0.0299, KO-veh vs. KO-BTZ ∗p = 0.0163; n = 9).
(I) Expression of proteins in the degrading population were identified in neuron-specific TRAP-seq. T-statistic values (combined score) show expression of the degrading population is significantly elevated vs. the mean distribution (Z test, Z = 3.6741, ∗p = 0.00023).
(J) A comparison of all GSEA categories significantly enriched in both the degrading population and the Fmr1−/y TRAP population shows a functional divergence in proteins over-translated and over-degraded (ribosomes), under-translated over-degraded (synaptic), and over-translated but not degrading (mitochondria).
(K) Comparison of combined score shows a significant decrease of the degrading population from the mean distribution (Z test, Z = −3.375, ∗p = 0.00075).
(L) TRAP-seq (translation) changes and basal protein expression changes of the degrading population were compared. Most KEGG pathways significantly enriched in the degrading population are decreased in the basal population, with the exception of Ribosome.
(M) Density plot reveals different functional groups that are over-translated/overexpressed (ribosomal proteins), over-translated/underexpressed (G protein subunits), or under-translated and underexpressed (FMRP targets). G protein subunits show more accumulation upon MG132 compared to RPs. (Wilcoxon rank sum test, G proteins vs. total ∗p = 0.0337, RPs vs. total ∗p = 0.3162). N = number of littermate pairs. Data presented as mean ± SEM. All immunoblot samples loaded on the same gel but not side-by-side (see STAR Methods). See also Figures S2and S3 and Tables S2, S3, and S4.
Similar to previous studies in adult Fmr1−/y brain, our differential expression analysis revealed few changes in WT versus Fmr1−/y vehicle-treated slices at p < 0.05 (Figure 2B and Table S2).33 However, a comparison of MG132-treated slices reveals significantly more upregulated proteins between WT and Fmr1−/y (vehicle (veh): 26 proteins, MG132: 139 proteins). MG132 had little effect on protein accumulation in WT slices, most likely due to the short incubation time, resulting in only 35 proteins increased. In contrast, MG132 treatment in Fmr1−/y slices caused an upregulation of 177 proteins. Interestingly, 18 of the 35 proteins significantly upregulated in WT are also elevated in Fmr1−/y, suggesting that the population excessively degrading in the Fmr1−/y is at least in part an amplification of the population undergoing basal turnover in WT (Figures 2C and 2D and Table S2).
To further investigate the protein population accumulated with MG132 in Fmr1−/yhippocampus, we performed pathway enrichment analyses. GSEA revealed a significant upregulation of gene sets involved in cytoskeleton regulation, translation, cell adhesion, and synaptic vesicle exocytosis, suggesting proteins involved in multiple pathways are degrading faster in Fmr1−/y synapses (padj < 0.1) (Figure S2 and Table S3). A Kyoto Encyclopedia of Genes and Genomes (KEGG) pathway analysis of the most significantly changed population identified several pathways involved in synaptic function (Figure 2E). Interestingly, these pathways were identified by significant increases in α and β subunits of Gi/o, a small heterotrimeric G-protein that is an essential mediator of adenylate cyclase signaling and cyclic AMP (cAMP) production downstream of multiple synaptic receptors (Figures 2E and S2).52 Immunoblotting on P2 fractions from additional sets of slices validated a significant increase in both Gnb1 and Gnai1 subunits in Fmr1−/yslices treated with MG132 (Figures 2F and S3). Gnai1 expression is also constitutively reduced in vehicle-treated Fmr1−/y P2, consistent with accelerated degradation in the Fmr1−/y hippocampus. To determine whether these changes are restricted to the P2 fraction, which could suggest a change in trafficking to the synapse, we repeated our experiments and examined whole homogenates. Our results show the same increase in Gnai1 in Fmr1−/y homogenates, with MG132 incubation indicating a cell-wide change in degradation (Figures 2G and S3). As MG132 has additional activity on calpain cleavage and pathways involved in autophagy, we performed additional experiments with BTZ, a specific inhibitor of the β5-mediated catalytic activity of the proteasome.53,54 These results show a similar increase in Gnai with BTZ treatment in Fmr1−/y slices (Figures 2H and S3). Together, these results confirm an accelerated degradation of proteins, including Gi/o subunits, in Fmr1−/y hippocampal synapses.
Given our results showing that proteasome activity in the Fmr1−/y hippocampus is normalized with protein synthesis inhibitors, we wondered whether there was an overlap between the excessively degrading and newly synthesized populations in Fmr1−/y neurons. To investigate this, we compared the proteins accumulated with MG132 in the Fmr1−/y synaptic proteome to the ribosome-bound mRNAs in our recently published neuron-specific TRAP-seq dataset.1 Although this analysis does not allow for a direct comparison of translation and degradation in the same fraction, we reasoned that the neuron-specific information provided by TRAP-seq would be the most relevant to the changes seen in the synapse-enriched proteome. A population analysis shows that the group of 177 proteins upregulated with MG132 in Fmr1−/y is elevated in the Fmr1−/y TRAP-seq population (Figure 2I and Table S4). This indicates that the population of proteins excessively degraded in Fmr1−/y hippocampus is overlapping with the over-synthesizing population in Fmr1−/y neurons. However, a GSEA comparison between Fmr1−/y MG132-accumulated and Fmr1−/y TRAP-seq populations reveals that certain gene sets enriched in the degrading population are not similarly enriched in the translating population, suggesting an incomplete overlap (padj < 0.1) (Figure 2J).
To further investigate the impact of degradation on the basal synaptic Fmr1−/yproteome, we asked whether the over-degrading population was expressed at WT levels. Analysis of the expression of the MG132-accumulated population in the basal Fmr1−/y synaptic proteome reveals a significant reduction (Figure 2K and Table S4). This is reflected in the steady-state downregulation of most over-degrading synaptic KEGG pathways including “Glutamatergic synapse,” “Dopaminergic synapse,” and “Long-term depression” (Figure 2L). Interestingly, “Ribosomes” is the only category significantly elevated at steady-state, which is due to an increased expression of ribosomal proteins (RPs). In contrast, G protein subunits are significantly downregulated as a group at steady state (Figure 2M). Together, our results suggest that excessive degradation is linked to excessive synthesis in the Fmr1−/yhippocampus; however, an imbalance in the favor of degradation may result in an underrepresentation of regulatory proteins in the synaptic proteome.
Inhibiting UPS activity normalizes protein synthesis in Fmr1−/yhippocampus
Our proteomics experiments identified an overlap between TRAP-seq and MG132-accumulated proteomic datasets that points to a coupling between excessive synthesis and degradation phenotypes in the Fmr1−/y hippocampus. Previous studies have shown that proteasome inhibition reduces new protein synthesis in neurons.55,56,57 We therefore wondered whether UPS inhibitors could reverse excessive protein synthesis in Fmr1−/y neurons, which is thought to contribute to several pathological changes in plasticity and excitability.
To test whether UPS inhibition could normalize protein synthesis, we used BTZ, a specific inhibitor of the catalytic activity of the proteasome that is bioavailable and is currently used as a chemotherapeutic agent (Figure 3A).54 Our goal was to lower proteasome activity to WT levels rather than completely inhibit activity so that cytotoxic effects could be avoided. We therefore performed a dose-response experiment, which identified 3 nM BTZ as a treatment that would have the maximum impact on proteasome activity in Fmr1−/y hippocampus without altering WT hippocampus (Figures 3B and 3C). Using this concentration, we performed metabolic labeling on hippocampal slices prepared from littermate WT and Fmr1−/ymice. Our results show that 3 nM BTZ significantly lowers protein synthesis in the Fmr1−/y hippocampus without altering levels in WT, indicating a correction of the excess protein synthesis phenotype in Fmr1−/y hippocampus (Figure 3D).

Inhibiting the UPS normalizes protein synthesis in Fmr1−/y hippocampus
(A) Schematic of the UPS system showing which steps are inhibited by PYR-41, bortezomib (BTZ), and IU1.
(B) Dose response to BTZ on WT hippocampal slices shows a significant decrease in proteasome activity for concentrations higher than 10 nM (WT-veh; 100% ± 3.6%, WT-BTZ-1: 97.3% ± 3.8%, WT-BTZ-10: 76.6% ± 4.4%, WT-BTZ-100: 34.7% ± 2.7%, ANOVA F = 60.97, ∗p < 0.0001, WT-veh vs. WT-BTZ-10 ∗p = 0.0089, WT-veh vs. WT-BTZ-100 ∗p < 0.0001, n = 7).
(C) Bortezomib (3 nM) significantly reduces proteasome activity in Fmr1−/y slices to WT levels (WT-veh: 100% ± 2.5%, WT-BTZ: 101.6% ± 3.3%, KO-veh: 112.2% ± 3.5%, KO-BTZ: 96.6% ± 2.1%, ANOVA treatment x genotype F(1,8) = 17.32, ∗p = 0.0032, WT-veh vs. KO-veh ∗p = 0.0031, KO-veh vs. KO-BTZ ∗p = 0.0007, n = 9).
(D) Bortezomib (3 nM) normalizes protein synthesis in Fmr1−/y slices to WT levels (WT-veh; 100% ± 2.4%, WT BTZ: 97.3% ± 3%, KO-veh: 114.4% ± 2.3%, KO BTZ: 101.2% ± 2%, ANOVA treatment F(1,10) = 6.15, ∗p = 0.0325, genotype F(1,10) = 8.39, ∗p = 0.0159, treatment x genotype F(1,10) = 11.66, ∗p = 0.0066, WT-veh vs. KO-veh ∗p < 0.0001, KO-veh vs. KO-BTZ ∗p = 0.0001, n = 11).
(E) Inhibiting E1 ligase with PYR-41 (50 μM) restores proteasome activity in Fmr1−/y slices (WT-veh; 100% ± 5%, WT-PYR-41: 94.4% ± 5.3%, KO-veh: 120% ± 4.1%, KO-PYR-41: 98.1% ± 4.4%, ANOVA: genotype F(1,9) = 11.39, ∗p = 0.0082, WT-veh vs. KO-veh ∗p = 0.0034, KO-veh vs. KO-PYR-41 ∗p = 0.0043, n = 10).
(F) PYR-41 (50 μM) significantly reduces protein synthesis rates in Fmr1−/y slices (WT-veh; 100% ± 3%, WT-PYR-41: 95.4% ± 4%, KO-veh: 113.6% ± 4.4%, KO-PYR-41: 102.4% ± 4.3%, ANOVA mixed effect analysis: treatment F(1,9) = 5.54, ∗p = 0.0430, WT-veh vs. KO-veh ∗p = 0.0204, KO-veh vs. KO-PYR-41 ∗p = 0.0190, n = 10).
(G) UPS activator IU1 (60 μM) significantly increases protein synthesis in WT but not Fmr1−/y(WT-veh; 100% ± 1.8%, WT-IU1: 126.8% ± 3.3%, KO-veh: 117.2% ± 3.2%, KO-IU1: 119.7% ± 4%, ANOVA treatment F(1,7) = 20.41, ∗p = 0.0027, treatment x genotype F(1,7) = 9.69, ∗p = 0.0170, WT-veh vs. KO-veh ∗p = 0.0169, WT-veh vs. WT-IU1 ∗p = 0.0018, n = 8). N = number of littermate pairs. Data presented as mean ± SEM.
Protein degradation by the UPS begins with the activation of ubiquitin by E1 ligases, which is subsequently conjugated to E2 ligases and then E3 ligases, which ultimately tag proteins for degradation.58 To test whether inhibition of E1 ligase activity would have an impact on the Fmr1−/y hippocampus, we incubated Fmr1−/yand WT littermate slices in 50 μM PYR-41, previously shown to inhibit 95% of E1 activity by 15 min after application.59 First, to confirm this treatment had an impact on UPS activity, we measured proteasome activity in Fmr1−/y and WT hippocampus. Our results show that a 1 h incubation with 50 μM PYR-41 significantly reduces proteasome activity in Fmr1−/y slices (Figure 3E). Next, we tested whether this treatment could similarly normalize protein synthesis. Metabolic labeling experiments show that PYR-41 corrects the excessive protein synthesis phenotype in Fmr1−/y hippocampus (Figure 3F).
Given the relationship between the proteasome and protein synthesis phenotypes, we next asked whether raising proteasome activity would exacerbate the protein synthesis phenotype in Fmr1−/y hippocampus or whether this response would be occluded. To do this, we tested the impact of the drug IU1. This drug inhibits Usp14, a proteasome-associated deubiquitinating enzyme (DUB) that reduces proteasome activity by trimming ubiquitin chains from substrates before degradation. By inhibiting Usp14 activity, IU1 activates the proteasome.60,61 To test whether raising proteasome activity using this compound changes protein synthesis, we performed metabolic labeling on WT and Fmr1−/y slices in 60 μM IU1 or veh. These results show that IU1 causes a significant increase in protein synthesis in WT but not Fmr1−/y slices, indicating the saturation of protein synthesis occludes further increases in response to UPS activation (Figure 3G). Together, our results show that proteasome activity exists in a feedback loop with protein synthesis in the Fmr1−/y hippocampus and that reducing UPS activity is a new approach to correcting excessive protein synthesis in FX.
Normalizing proteasome activity in Fmr1−/y IC neurons corrects hyperresponsiveness to sound
Our experiments showing that lowering UPS activity is beneficial for Fmr1−/yhippocampus led us to ask whether excessive proteasome activity was involved in other Fmr1−/y phenotypes. One of the most robust behavioral phenotypes in the Fmr1−/y mouse is an increased susceptibility to AGS,62,63,64,65,66 which models the hypersensitivity to sensory stimuli in FX patients.7,67,68,69,70 Recent evidence implicates neurons of the IC in the expression of the AGS phenotype.71,72 The IC is a subcortical structure that acts as a major relay for auditory information and processes multi-sensory information related to sound.73 Recent investigations of the Fmr1−/y mouse reveal that exposure to sound results in greater activation of IC neurons as assessed by c-Fos immunostaining or by in vivo single-unit recordings.71Additionally, replacement of Fmr1 in glutamatergic IC neurons, but not cortical neurons, is sufficient to block AGS in Fmr1−/y mice.72 To investigate the role of the UPS in IC neurons, we measured proteasome activity in IC isolated from Fmr1−/yand WT littermates (Figure 4A). Our results revealed a significant elevation of proteasome activity in the Fmr1−/y IC, similar to what was observed in Fmr1−/yhippocampus (Figure 4B). These results were similarly observed in Fmr1−/y mice reared on the FVB strain. Next, to investigate whether UPS pathway components were upregulated at IC synapses, we isolated P2 fractions from Fmr1−/y IC and performed label-free quantitative MS analysis. Differential expression analyses revealed 73 proteins significantly upregulated and 67 proteins significantly downregulated in Fmr1−/y versus WT IC (p < 0.05) (Figures 4C and S4 and Table S5). Similar to what was observed in the hippocampus, the upregulated population was enriched for UPS components including proteasome complex subunits and several ubiquitin ligase subunits. GSEA revealed that 6 of the 38 significantly upregulated categories are UPS-related, with “Proteasome complex” as the most upregulated term (padj < 0.1) (Figures 4D and S4 and Table S6). These results show that UPS pathway members are upregulated in synaptically enriched fractions of Fmr1−/y IC.

Normalizing proteasome activity in IC of Fmr1−/y mice with bortezomib reduces hyperexcitability in IC
(A) Inferior colliculi from WT and Fmr1−/y mice were processed for proteasome activity assay or MS analysis.
(B) Proteasome activity is significantly increased in Fmr1−/y IC when reared on either FVB or C57BL6 background strains (FVB: WT: 100% ± 1.3 %, KO: 115.6% ± 4.2%. paired t test ∗p = 0.0158. N = 7; C57: WT: 100% ± 4.7%, KO: 112.1% ± 6.2%. paired t test ∗p = 0.0412. N = 10).
(C) Volcano plot shows differentially expressed proteins in WT and Fmr1−/y IC with significantly changed proteins in red (p < 0.05). Upregulated proteasome complex (dark red) and ubiquitin ligase (green)-related proteins are highlighted.
(D) GSEA of significantly enriched categories (padj < 0.1) in the Fmr1−/y IC show upregulation of 6 UPS-related categories.
(E) WT and Fmr1−/y mice were injected with vehicle or BTZ (5 mg/kg), and the inferior colliculi were dissected either 1 h post injection (naïve) or after exposure to AGS stimulation (AGS) for proteasome activity and western blot (WB) analysis.
(F) Proteasome activity is reduced in IC by BTZ (WT-HC: 11.59% ± 2.7%, WT-HC-BTZ: 15.05% ± 1.7%, WT-AGS: 16.4% ± 2.5%, WT-BTZ-AGS: 15.35% ± 0.6%, KO-HC: 15.81% ± 2%, KO-HC-BTZ: 14.87% ± 2.5%, KO-AGS: 23.47% ± 2%, KO-BTZ-AGS: 15.56% ± 1.2%, 3-ANOVA treatment F(1,12) = 9.72, ∗p = 0.0089; genotype x treatment F(1,12) = 5.32, ∗p = 0.0397. KO-HC-vs. KO-HC-BTZ ∗p = 0.0322, KO-AGS vs. KO-AGS-BTZ ∗p = 0.0119, n = 7).
(G) BTZ administration causes significant accumulation of K48 ubiquitinated proteins in Fmr1−/y IC (WT-veh: 100% ± 16.8%, KO-veh: 79.6% ± 4%; WT-BTZ: 95.8% ± 13.9%; KO-BTZ: 112% ± 6.6%, ANOVA treatment F(1,4) = 21.84, ∗p = 0.0095, genotype x treatment F(1,4) = 14.21, ∗p = 0.0196; KO-veh vs. KO-BTZ ∗p = 0.0092; n = 5).
(H) WT and Fmr1−/y mice were injected with vehicle or BTZ (5 mg/kg), and after 1 h mice were either stimulated with AGS or kept in home cage (HC). After 45 min mice were perfused and brains processed for c-Fos immunostaining. Scale bars: left: 500 μm, right: 100 μm.
(I) Representative sections from Fmr1−/y and WT brains immunostained for c-Fos in IC (scale bar, 200 μm). Full IC image for each condition is shown in Figure S4.
(J) c-Fos+ cell density is significantly increased by AGS stimulation in both genotypes, and this effect is greater in the Fmr1−/y. BTZ eliminates the increase in c-Fos+ cell density in the Fmr1−/yIC (WT: HC: 11.59% ± 2.7%, HC-BTZ: 15.05% ± 1.7%, AGS: 16.4% ± 2.5%, AGS-BTZ: 15.35% ± 0.6%, KO: HC: 15.81% ± 2%, HC-BTZ: 14.87% ± 2.5%, AGS: 23.47% ± 2%, AGS-BTZ: 15.56% ± 1.2%, 3-ANOVA AGS F(1,3) = 12.8, ∗p = 0.0373; Genotype x treatment F(1,3) = 20.8, ∗p = 0.0197; AGS x treatment F (1,3) = 15.4, ∗p = 0.0293; WT-HC vs. WT-AGS ∗p = 0.03, WT-AGS vs. KO-AGS ∗p = 0.0105, KO-HC vs. KO-AGS ∗p = 0.0041, KO-AGS vs. KO-BTZ-AGS ∗p = 0.0334, n = 4).
(K) AGS stimulation increases c-Fos+ cell density in the lemniscal (CIC) and non-lemniscal (DCIC + ECIC) regions of the Fmr1−/y IC (CIC: WT-HC 11.1 ± 5.8: WT-AGS 18.4 ± 4.1, KO-HC 15.3 ± 7.2, KO-AGS 32.1 ± 6.2; DCIC+ECIC: WT-HC 7.8 ± 3.2; WT-AGS 16.6 ± 1.7, KO-HC 12.6 ± 4.03, KO-AGS 31.5 ± 3.6, 3-ANOVA AGS F(1,3) = 60.29, ∗p = 0.0044, Genotype F(1,3) = 27.88, ∗p = 0.0132; CIC: KO-HC vs. KO-AGS ∗p = 0.0341, DCIC + ECIC: KO-HC vs. KO-AGS ∗p = 0.0246, WT-AGS vs. KO-AGS ∗p = 0.0461; n = 4).
(L) BTZ causes a significant reduction in AGS-induced c-Fos labeling in both lemniscal and non-lemniscal regions of the Fmr1−/y IC (CIC: WT-AGS 18.4 ± 4.1, WT-AGS-BTZ 15.9 ± 4.8, KO-AGS 32.1 ± 6.2, KO-AGS-BTZ 13.5 ± 2.2; DCIC+ECIC: WT-AGS 16.6 ± 1.7, WT-AGS-BTZ 12.2 ± 2.8, KO-AGS 31.5 ± 3.6, KO-AGS-BTZ 12.1 ± 1.2, 3-ANOVA treatment F(1,3) = 12.73, ∗p = 0.0039, genotype x treatment F(1,3) = 6.06, ∗p = 0.030; CIC: WT-AGS vs. KO-AGS ∗p = 0.0438, KO-AGS vs. KO-AGS-BTZ ∗p = 0.009; DCIC + ECIC WT-AGS vs. KO-AGS ∗p = 0.0346, KO-AGS vs. KO-AGS-BTZ ∗p = 0.009; n = 4). N = number of mice per group. Data presented as mean ± SEM. All immunoblot samples loaded on the same gel but not side-by-side (see STAR Methods). Mouse silhouettes illustrated in panels A and E were sourced from https://scidraw.io and adapted from https://doi.org/10.5281/zenodo.3925903 and https://doi.org/10.5281/zenodo.3925901. See also Figure S4 and Tables S5 and S6.
Previous mouse studies testing BTZ treatment for cancer show that i.p. injection leads to an accumulation in CNS tissue and a significant reduction in proteasome activity by 1 h.74,75 We therefore tested whether BTZ administration could normalize proteasome activity in Fmr1−/y IC. WT and Fmr1−/y littermates were injected with BTZ (5 mg/kg) or veh, returned to the HC for 1 h, and IC tissue isolated and processed for proteasome activity (Figure 4E). In order to ensure that any effects of BTZ would be seen under stimulated conditions, we isolated IC tissue from both naïve animals and those exposed to a 120 dB stimulus that induces AGS. Our results show that BTZ significantly reduces proteasome activity in IC isolated from Fmr1−/y mice under both naïve and stimulated conditions (Figure 4F). To confirm the impact of BTZ on proteasome activity in vivo, we measured the accumulation of proteins tagged with K48 ubiquitin that are readily degraded by the proteasome. Immunoblotting of IC tissue shows a significant accumulation of K48 ubiquitinated proteins in the Fmr1−/y IC at 1 h post injection with BTZ (Figures 4G and S4). Together, these results confirm BTZ injection corrects excessive proteasome activity in Fmr1−/y IC.
Our next question was whether normalizing UPS activity could reduce the hyperactivation of Fmr1−/y IC neurons in response to auditory input. To test this, we performed c-Fos immunostaining to measure neuron activation in the IC of Fmr1−/yand WT mice exposed to an AGS stimulation. To isolate the effect of sound from subsequent seizure activity, we performed pilot experiments to determine a level of stimulation that would stop short of AGS expression (Figure S4).
Animals were injected with BTZ or veh and after 1 h either exposed to 45 s of AGS stimulus at 116 dB or left in the HC for an identical time period. After stimulation, mice were returned to the HC for 45 min to allow for sufficient c-Fos expression in activated neurons (Figure 4H). Immunostaining for c-Fos was performed on IC sections and the density of labeled cells quantified in z stacks acquired with confocal imaging. Consistent with previous work, our results show that auditory stimulation results in an increased density of c-Fos positive (c-Fos+) neurons in Fmr1−/y versus WT IC (Figures 4I and 4J). A stimulated increase was observed in both WT and Fmr1−/y IC; however, this response was significantly greater in Fmr1−/y mice. Furthermore, BTZ treatment resulted in a striking correction of auditory-induced hyperactivation in Fmr1−/y IC (Figures 4I and 4J). To confirm these results, c-Fos+ cell density was re-analyzed using a separate analysis package, which revealed a similar significant increase in neuron activation in the Fmr1−/y IC that is blocked with BTZ treatment (Figure S4). These results suggest that excessive UPS activity contributes to the hyperresponsiveness of Fmr1−/y IC neurons to sound.
Interestingly, studies of AGS in seizure-prone rats have indicated a regional difference in the activation of neurons in the IC central core (CIC), a major relay of sound information via the lemniscal pathway, and the external capsule (ECIC) and dorsal capsule (DCIC) regions, which receive input from the CIC via the non-lemniscal pathway.73,76,77 We therefore investigated changes specific to these regions. Analysis of c-Fos+ neuron density reveals increased sound-driven activation of neurons in both lemniscal and non-lemniscal subregions of the Fmr1−/y IC (Figure 4K). Furthermore, BTZ prevents the hyperactivation in both IC subregions (Figure 4L). These results show that sound exposure results in hyperactivation of neurons throughout the Fmr1−/y IC, and this is prevented by BTZ.
Proteasome inhibition with bortezomib prevents AGS in Fmr1−/y mice
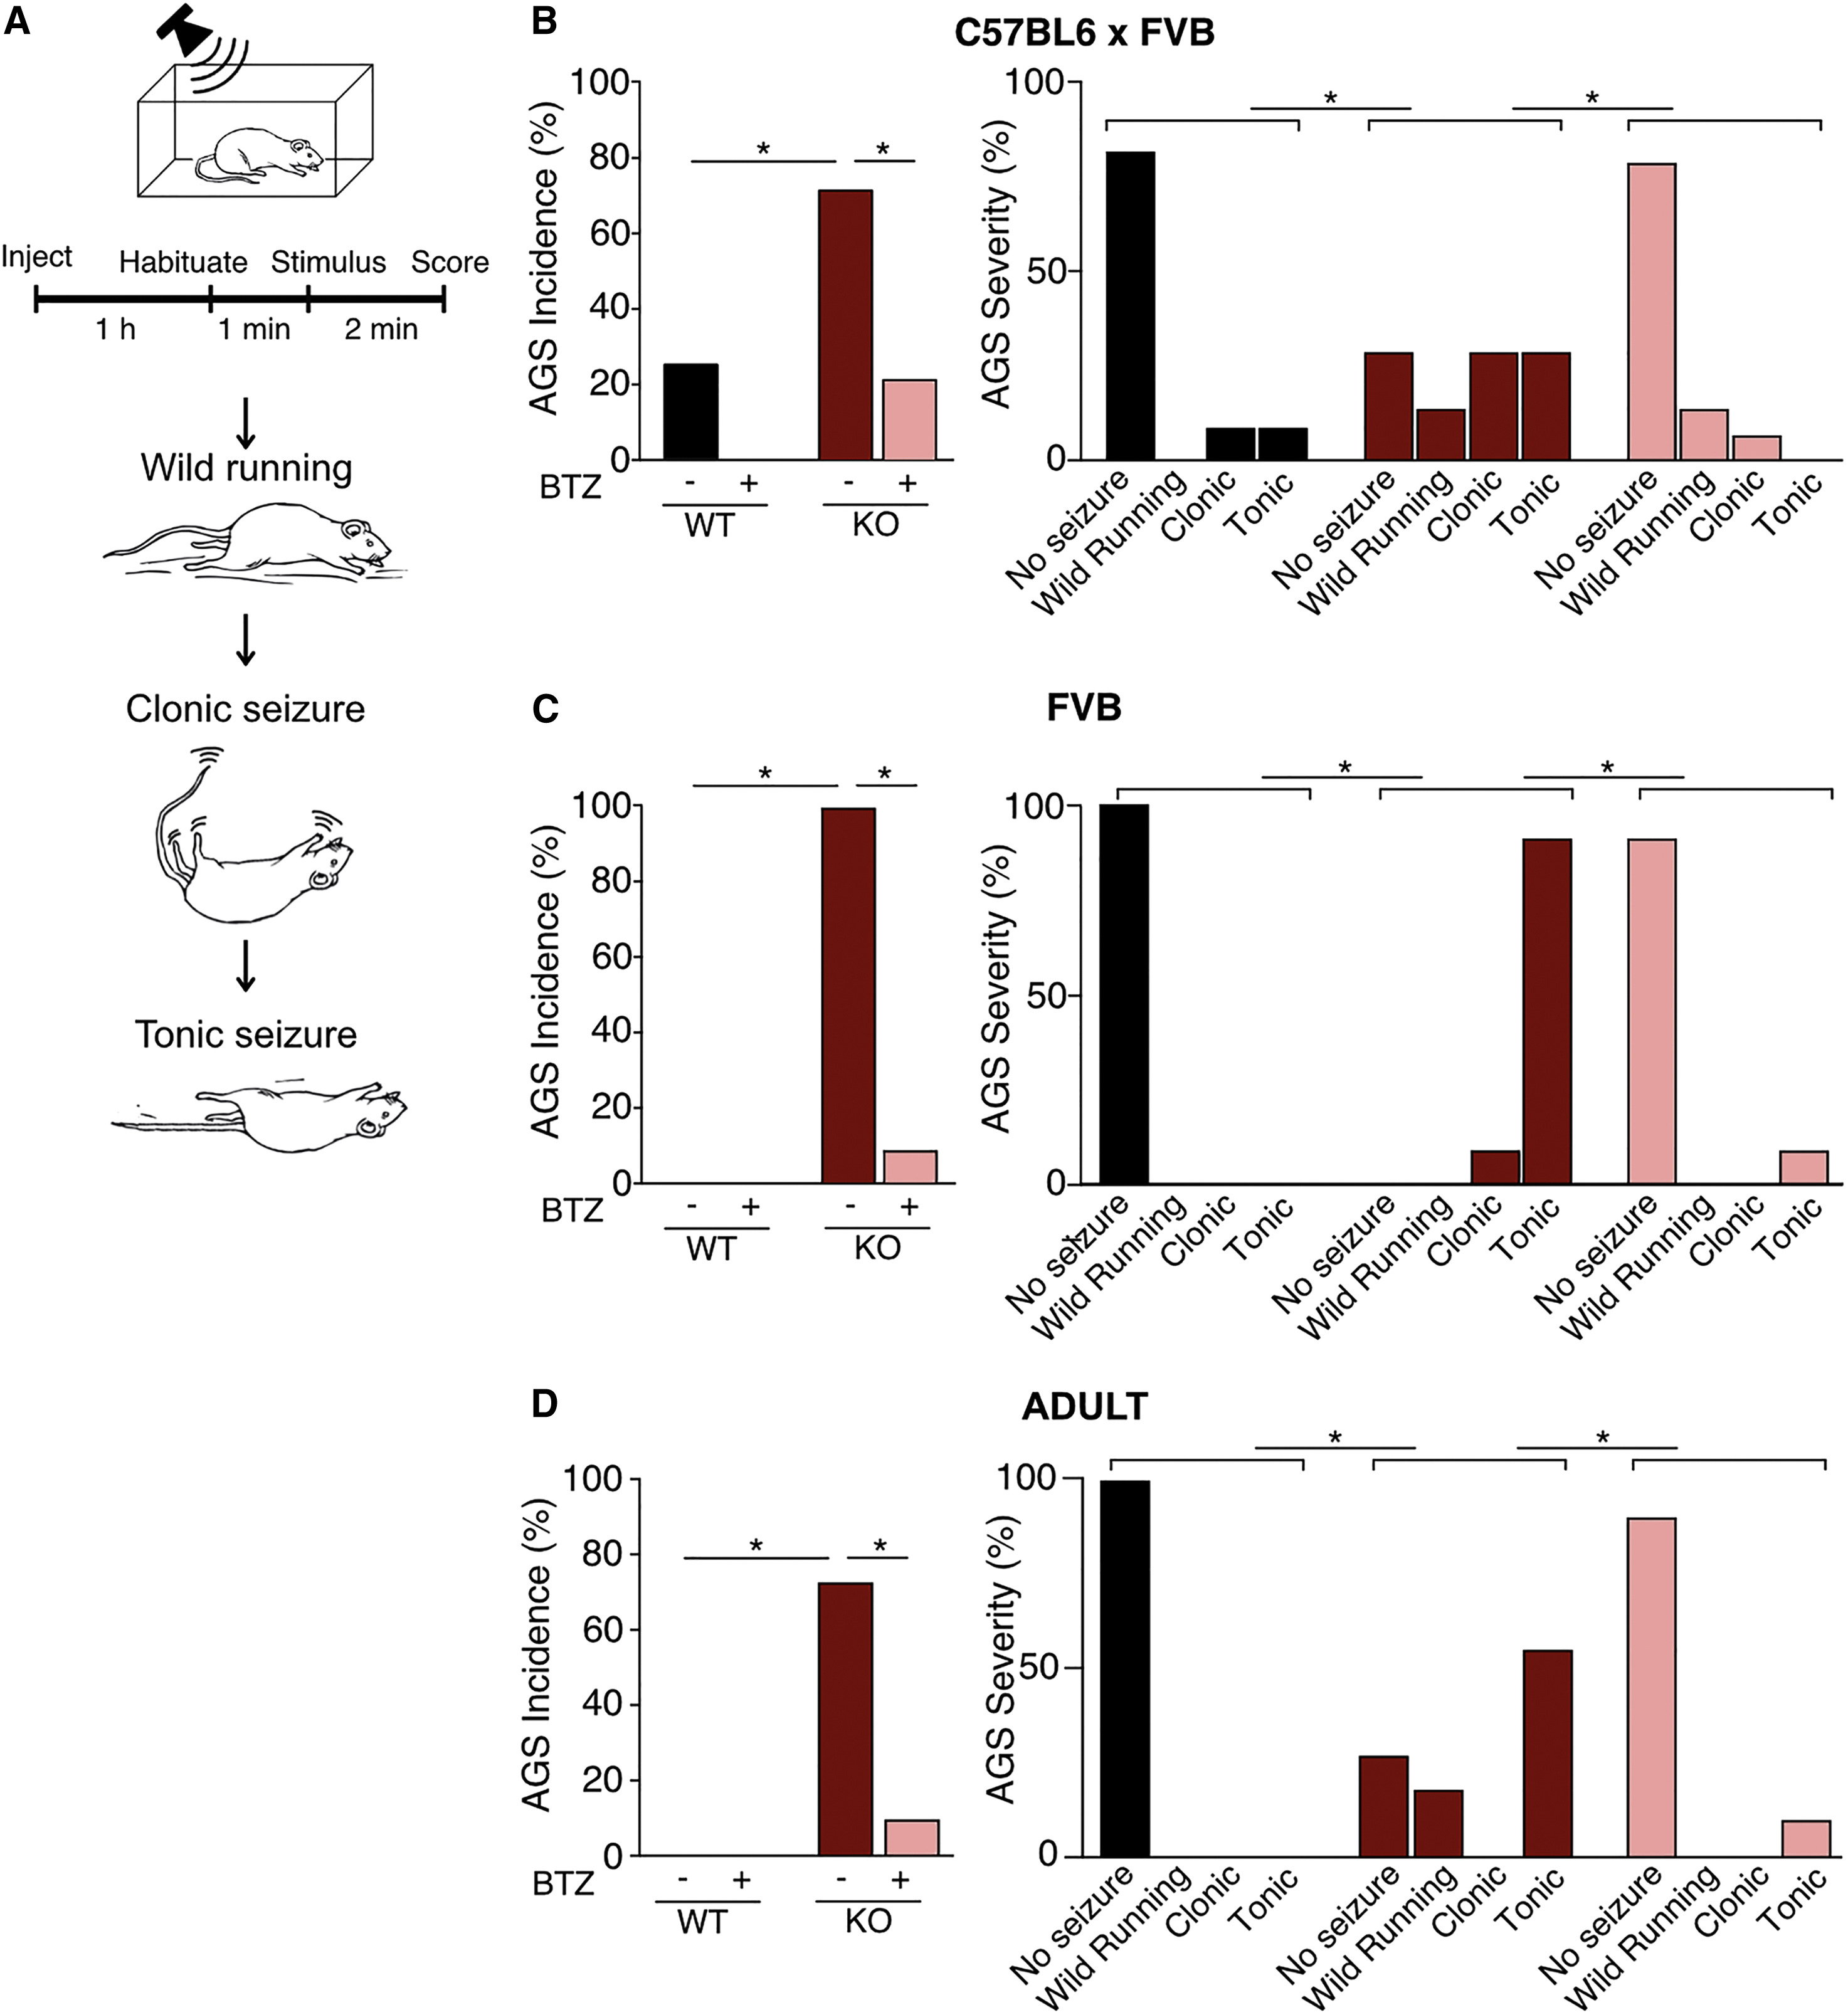
The correction of neuronal activity in the Fmr1−/y IC with BTZ prompted us to investigate whether this treatment could correct the enhanced susceptibility to AGS. The AGS phenotype is one of the most reliable behavioral alterations observed in Fmr1−/y mice.78 Multiple therapeutic strategies that alleviate AGS have gone on to be tested in clinical studies, suggesting this assay has predictive value.17,18,79,80 To measure AGS, we performed the same assay published in previous studies.30,81Fmr1−/y and WT littermates were injected with vehicle or 5 mg/kg BTZ, with the experimenter blind to both genotype and treatment. After 1 h, animals were transferred to a test chamber where they were habituated for 1 min then exposed to a 2-min sampling of a defined mixture of frequencies played at 120 dB. Seizures were scored on a 1–3 scale of increasing severity: (1) wild running, (2) clonic seizure, and (3) tonic seizure (Figure 5A and Videos S1, S2, S3, and S4).
Pharmacological inhibition of the proteasome prevents AGS in juvenile and adult Fmr1−/y mice
(A) Fmr1−/y and WT mice on the C57BL/6 x FVB (B) or FVB/N (C and D) backgrounds were injected with 5 mg/kg bortezomib (BTZ) or vehicle and tested for AGS after 1 h. Increasing severity was scored as wild running, clonic seizure, and tonic seizure.
(B) BTZ reduces the incidence of AGS in juvenile Fmr1−/y mice on the C57BL/6 x FVB background (Fisher’s exact test, WT vs. KO-veh ∗p = 0.0154, KO-veh vs. KO-BTZ ∗p = 0.0213, n = 11–14). Comparison of AGS scores shows BTZ reduces seizure severity (Mann–Whitney WT vs. KO-veh ∗p = 0.0189, KO-veh vs. KO-BTZ p = 0.0040, n = 11–14).
(C) BTZ reduces the incidence of AGS in juvenile Fmr1−/y mice on the FVB/N background (Fisher’s exact test WT-veh vs. KO-veh ∗p < 0.0001, KO-veh vs. KO-BTZ ∗p < 0.0001, n = 11–12). Comparison of AGS scores shows BTZ reduces seizure severity (Mann–Whitney WT-veh vs. KO-veh ∗p < 0.0001, KO-veh vs. KO-BTZ ∗p < 0.0001, n = 11–12).
(D) BTZ reduces the incidence of AGS in adult Fmr1−/y mice on the FVB/N background (Fisher’s exact test WT-veh vs. KO-veh ∗p = 0.0014, KO-veh vs. KO-BTZ ∗p = 0.0075. n = 9–11). Comparison of AGS scores shows BTZ reduces seizure severity (Mann–Whitney WT-veh vs. KO-veh ∗p = 0.0026, KO-veh vs. KO-BTZ ∗p = 0.0094, n = 9–11). N = number of mice per group. Data presented as mean ± SEM. See also Videos S1, S2, S3, and S4.
We first tested mice at a young age (P19–22) at which the AGS phenotype is most readily apparent. We used cohorts raised on a C57BL6/J x FVB hybrid background, which shows an increased susceptibility to AGS versus pure C57BL6/J.62 Our results show the expected increase in both AGS incidence and severity in vehicle-treated Fmr1−/y mice versus vehicle-treated WT. Consistent with the elimination of hyperactivity in IC neurons, BTZ treatment caused a striking reduction in the incidence and severity of AGS in Fmr1−/y mice (Figure 5B). Next, we repeated our experiments using Fmr1−/y and WT littermates raised on a pure FVB background.82Our results show a similar significant increase in AGS incidence and severity that is corrected with BTZ in Fmr1−/y mice (Figure 5C). On the FVB background, Fmr1−/ymice exhibit the AGS phenotype into adulthood, and we therefore repeated our experiments on adult (>P60) Fmr1−/y and WT littermate mice. AGS testing reveals that there is a significant increase in AGS incidence and severity in Fmr1−/y adult mice that is eliminated with BTZ (Figure 5D). These results show that normalizing proteasome activity is sufficient to correct AGS in Fmr1−/y mice raised on multiple background strains and at different developmental ages.
Genetic reduction of proteasome activity in the IC prevents AGS in Fmr1−/ymice
Considering the pivotal role of IC in AGS and our novel observation that proteasome activity is elevated in this region, we wondered if specific reduction of proteasome activity in IC neurons would be sufficient to reduce AGS in Fmr1−/ymice. To test this, we reduced proteasome activity selectively in the IC through genetic reduction of Psmb5 (Figure 6A). The Psmb5 subunit is required for chymotrypsin-like enzymatic activity of the 26S proteasome, and previous studies have demonstrated that manipulation of this subunit alone is sufficient to change overall proteasome activity.83,84 To reduce levels of Psmb5 specifically in IC, we performed stereotaxic injections of AAV9 carrying Psmb5 shRNA and allowed for 1 week of expression. Fmr1−/y and WT animals were injected with vector expressing either Psmb5 shRNA or a scrambled shRNA sequence under the control of a U6 promoter, followed by an mCherry tag driven by a hSYN1 promoter (Figure 6A). Confocal imaging shows selective expression of virus in the IC, with good infectivity of neurons (Figure 6B). A qPCR analysis of dissected IC confirms a significant reduction of Psmb5 transcript in animals injected with AAV9-shRNA versus AAV9-scrambled after 1 week of expression (Figure 6C). Immunoblotting reveals a similar significant reduction in Psmb5 protein levels in shRNA-expressing Fmr1−/y IC (Figure S4). Importantly, this reduction in Psmb5 is sufficient to normalize the elevated proteasome activity seen in Fmr1−/y IC (Figure 6D).

Genetic reduction of proteasome activity in inferior colliculus prevents AGS in Fmr1−/y mice
(A) Fmr1−/y and WT mice were injected with AAV9-Psmb5 shRNA-mCherry or AAV9-scramble-mCherry, tested for AGS after 6–8 days, and IC tissue analyzed for Psmb5 knockdown and proteasome activity.
(B) Confocal imaging shows mCherry expression is specific for IC and is well expressed in neurons (identified by EGFP expression) (scale bars, 500 and 50 μm).
(C) qPCR shows injection of AAV9-Psmb5 shRNA significantly reduces Psmb5 expression in Fmr1−/y IC. A significant increase in Psmb5 expression in Fmr1−/y vs. WT expressing control AAV9-scramble control is consistent with the basal increase seen in Fmr1−/y hippocampus (WT-scr: 100% ± 23.4%, KO-scr: 212.3% ± 17.5%, KO-shRNA: 33.49% ± 7.2%, ANOVA ∗p < 0.001; WT-scr vs. KO-scr ∗p = 0.0001, KO-scr vs. KO-shRNA ∗p < 0.0001; n = 8–16).
(D) Proteasome assays show injection of AAV9-Psmb5 shRNA is sufficient to reduce proteasome activity in the Fmr1−/y IC (WT-scr: 100% ± 5.1%, KO-scr: 124.8% ± 5.9%, KO-shRNA: 86.5% ± 4.7%, ANOVA F = 14.82, ∗p = 0.0002; WT-scr vs. KO-scr ∗p = 0.0123; KO-scr vs. KO-shRNA ∗p < 0.0001; n = 6–8).
(E) AGS assays of WT and Fmr1−/y injected animals shows that expression of AAV9-Psmb5shRNA in the IC is sufficient to significantly reduce the incidence of seizures in Fmr1−/y mice (Fisher’s exact test WT-scr vs. KO-scr ∗p = 0.0062, KO-scr vs. KO-shRNA ∗p = 0.0032; n = 8–16). A comparison of AGS scores shows that expression of AAV9-Psmb5 shRNA in the IC is also sufficient to significantly reduce seizure severity (Mann–Whitney WT-scr vs. KO-scr ∗p = 0.0357, KO-scr vs. KO-shRNA p = 0.0193).
(F) In the Fmr1−/y animals expressing AAV9-Psmb5 that go on to have seizures, the average latency to the first seizure is longer than those expressing AAV9-scramble, indicating a reduced susceptibility to seizure generation (WT-scr: 43.5 ± 9.5 s, KO-scr: 23.7 ± 6.4 s, KO-shRNA: 61.2 ± 17.9 s, t test KO-scr vs. KO-shRNA ∗p = 0.0226).
(G) A model of excessive proteostasis in FX proposes that excess mGlu5-ERK mediated protein synthesis causes a compensatory increase in protein degradation that contributes to pathological changes such as AGS. Importantly, the correction of neuropathology with bortezomib or Psmb5 shRNA suggests that inhibition of the UPS is a novel therapeutic strategy for FX. N = number of mice per group. Data presented as mean ± SEM. Mouse head silhouette illustrated in panel A was sourced from https://scidraw.io and adapted from https://doi.org/10.5281/zenodo.3925903. See also Videos S5, S6, and S7.
To test whether Psmb5 knockdown in the IC was sufficient to correct AGS, Fmr1−/yand WT mice injected with either shRNA or scrambled control were tested in groups counterbalanced for genotype and treatment. As expected, our results show a significant increase in incidence and severity in Fmr1−/y versus WT scrambled-treated mice (Figure 6E). Remarkably, Psmb5 shRNA-treated Fmr1−/y mice showed a significant reduction in AGS incidence and severity (Figure 6E and Videos S5, S6, and S7). A significant increase in latency to first seizure also indicates a positive impact of Psmb5 knockdown, even in the mice expressing seizures (Figure 6F). These results confirm that selective reduction of proteasome activity in IC neurons is sufficient to correct AGS in the Fmr1−/y mouse.
Discussion
This study identifies excessive activity of the UPS as a novel cellular phenotype contributing to pathological changes in the Fmr1−/y brain. We find that proteasome activity is elevated in Fmr1−/y neurons, consistent with an upregulation of proteasome subunits and UPS pathway members seen by neuron-specific TRAP-seq. As a consequence, protein degradation is excessive in Fmr1−/y hippocampal synapses. Furthermore, the proteasome inhibitor BTZ and the upstream E1 ubiquitin ligase inhibitor PYR-41 normalize excessive protein synthesis in the Fmr1−/y hippocampus, suggesting that excessive protein degradation is tightly linked to excessive protein synthesis. In addition to hippocampus, we show that UPS activity is elevated in the Fmr1−/y IC, which contributes to a hyperactivation of neurons in response to auditory stimulation. Consistent with these results, systemic administration of BTZ significantly reduces the incidence and severity of AGS in Fmr1−/y mice. The same reduction in seizures is seen with viral injection of Psmb5shRNA in Fmr1−/y IC, verifying the importance of UPS activity in this brain region for the expression of the AGS phenotype. Together, these results show that excessive activity of the UPS contributes to FX neuropathology, and this pathway can be targeted to correct multiple phenotypes in the Fmr1−/y mouse (Figure 6G).
We were motivated to investigate protein breakdown based on an absence of protein accumulation despite an increase in protein synthesis in juvenile Fmr1−/yhippocampus. Our results show that not only is protein degradation excessive, but it is dynamically linked to the elevation in protein synthesis. Recent work implicates FMRP in ribosome stalling and shows that translation elongation is elevated in Fmr1−/y neurons.24,25,31,85,86 Interestingly, the newly synthesized protein population is targeted for degradation by the UPS at a greater rate than that for existing proteins, which is mainly due to the high error rate that occurs during translation.45,46,47 It is therefore possible that the elevated proteasome activity seen in Fmr1−/y neurons is a compensatory response to the proportional increase in the newly synthesized fraction. This is consistent with our results showing that protein synthesis inhibitors have a greater impact on proteasome activity in the Fmr1−/yhippocampus (Figures 1N–1P) and that the excessively degrading population is upregulated in the translating fraction of Fmr1−/y neurons (Figure 2I).
If increased protein degradation compensates for the increase in mRNA translation, why would inhibition of UPS activity be beneficial? One possibility is that the reduction of proteasome activity normalizes protein synthesis, which ultimately resolves phenotypes that are driven by exaggerated translation (Figures 3D–3F). Indeed, a reduction in translation has been shown to be beneficial for myriad phenotypes in the Fmr1−/y mouse and in other FX models.14,16,87 It is also possible that reducing proteasome activity prevents the aberrant breakdown of existing proteins that contribute to altered synaptic function (Figures 2K–2M). Interestingly, the over-degrading population is enriched for G-protein subunits, including the alpha subunit of Gi/o. The activation of Gi/o is generally linked to an inhibition of adenylate cyclase activity and cAMP production.52 It is therefore interesting that deficient cAMP production in neurons is seen in several FX models, including mice, fly, and human,88,89,90 which has stimulated clinical trials for PDE4-D inhibitors that raise cAMP levels in FX patients.91 It is interesting to speculate that the increased turnover in Gi/o may shift the proportion of active versus inactive populations, altering cAMP production downstream of G-protein coupled receptors (GPCRs). It is also interesting to note that decreased activity of Gi/o-linked GABAB receptors (GABA-BRs) has been implicated in hyperexcitability in Fmr1−/y brain, and the GABA-BR positive allosteric modulator R-baclofen ameliorates many pathological phenotypes in the Fmr1−/y mouse.79,92,93 Whether reduction of UPS activity beneficially impacts Gi/o-linked receptor functioning or signaling is an important next question for future studies.
We find that exposure to a stimulus that elicits AGS causes a hyperactivation of neurons in the Fmr1−/y IC, which is eliminated with BTZ (Figure 4). Furthermore, selective reduction of proteasome activity in the IC through expression of Psmb5shRNA is sufficient to reduce AGS in the Fmr1−/y mouse (Figure 6). These results are consistent with previous work indicating that the IC is a critical mediator of AGS in the Fmr1−/y mouse.66,71,72 It has been shown that deletion of Fmr1 from vglut2+neurons is necessary to elicit AGS in otherwise WT mice and that re-expression of Fmr1 in Ntsr1+ neurons in the IC is sufficient to prevent AGS in otherwise Fmr1−/ymice.72 This indicates that Fmr1 loss in excitatory IC neurons is critical. However, it is not clear whether these are the same neurons responsible for seizure generation. Indeed, evidence from somatosensory cortex indicates loss of Fmr1 from excitatory neurons reduces feed-forward inhibition, ultimately resulting in an increase in firing.94 Future work is therefore needed to identify which cell population is responsible for initiating seizure activity and investigate how reduced UPS activity prevents this response.
Our results show that BTZ causes a striking reduction of hyperactivity in IC and blocks AGS in the Fmr1−/y mouse. Although the molecular mechanisms contributing to this rescue are not clear, there are many ways in which UPS activity contributes to neuronal excitability. The ubiquitination of GluA1 and GluA2 subunits contributes to the recycling of AMPARs at excitatory synapses, and major scaffolding proteins that impact receptor function such as PSD95, AKAP, and Shank are targets for the UPS.38,41 Multiple presynaptic proteins are also targeted for ubiquitination, and inhibition of the UPS alters the size of the recycling vesicle population at presynaptic terminals.95 The expression of GABA-ARs is also regulated by ubiquitination and degradation, which are enhanced in postmortem brain tissue from autism spectrum disorder (ASD) patients. Interestingly, inhibition of the ERAD pathway can reduce seizures in mice expressing GABA-A misfolding mutations simply by increasing surface expression.96,97 Many ion channels that regulate neuronal excitability and are involved in epilepsy are also regulated by the UPS, including large-conductance potassium (BK) channels and voltage-independent Ca2+-activated K+ (SK2) channels, both of which are deficiently activated in Fmr1−/y neurons.98,99,100 Moreover, studies of Fmr1−/y hippocampal neurons reveal a dysregulation in the expression of the E3 ligase Nedd4-2, which modifies AMPAR trafficking and targets several ion channels involved in excitability.101,102 Future work determining the targets of enhanced UPS activity that underlie increased excitability in IC neurons will be important for determining the mechanistic cause of AGS in the Fmr1−/y mouse and for identifying further therapeutic targets.
Our results provide important new information relevant to therapeutic strategies in FX. Original experiments identifying excessive protein synthesis downstream of mGlu5 led to the development of multiple treatments that are being tested in clinical trials.103 However, there is still no targeted treatment approved for FX, and novel strategies are urgently needed. In this study, we show that increased activity of the UPS is a pathological adaptation that accompanies excess protein synthesis in FX, and this can be targeted to correct multiple deleterious changes. This is particularly advantageous in light of the numerous UPS inhibitors that have been developed for the treatment of cancer and other disorders.54,58 Although our study is focused on the question of FX, several mutations that alter UPS function have been linked to autism, intellectual disability (ID), and epilepsy.104,105,106 It is therefore possible that our results will be relevant to other neurodevelopmental disorders.