
Aβ efflux impairment and inflammation linked to cerebrovascular accumulation of amyloid-forming amylin secreted from pancreas
By Nirmal Verma, Gopal Viswanathan Velmurugan, Edric Winford, Han Coburn, Deepak Kotiya, Noah Leibold, Laura Radulescu, Sanda Despa, Kuey C. Chen, Linda J. Van Eldik, Peter T. Nelson, Donna M. Wilcock, Gregory A. Jicha, Ann M. Stowe, Larry B. Goldstein, David K. Powel, Jeffrey H. Walton, Manuel F. Navedo, Matthew A. Nystoriak, Andrew J. Murray, Geert Jan Biessels, Claire Troakes, Henrik Zetterberg, John Hardy, Tammaryn Lashley, and Florin Despa
Excerpt from the article published in Communications Biology 6, 2 (2023), 03 January 2023, DOI: https://doi.org/10.1038/s42003-022-04398-2
Editor’s Highlights
- Type-2 diabetes mellitus (type-2 DM) and Alzheimer’s disease (AD), two growing global health threats, appear linked through complex mechanisms possibly involving amyloid-forming amylin as a molecular factor beyond glucose and insulin dysregulation.
- Impaired executive function and working memory are common in persons with type-2 diabetes without dementia, and amylin dysregulation is associated with type-2 diabetes.
- Pancreatic amyloid-forming amylin accumulates in brain capillaries and may affect expression of P-gp and LRP1, proteins that mediate Aβ transport across the BBB.
- Although APOE/LRP1-regulated pathways have a well-established role in brain Aβ clearance the possibility that LRP1 expression can be downregulated by amylin from the luminal side of the blood vessel may represent a novel therapeutic target to reduce AD pathology.
- Inhibiting systemic and cerebrovascular inflammation caused by pancreatic amyloid-forming amylin could reduce brain Aβ accumulation.
Abstract
Impairment of vascular pathways of cerebral β-amyloid (Aβ) elimination contributes to Alzheimer disease (AD). Vascular damage is commonly associated with diabetes. Here we show in human tissues and AD-model rats that bloodborne islet amyloid polypeptide (amylin) secreted from the pancreas perturbs cerebral Aβ clearance. Blood amylin concentrations are higher in AD than in cognitively unaffected persons. Amyloid-forming amylin accumulates in circulating monocytes and co-deposits with Aβ within the brain microvasculature, possibly involving inflammation. In rats, pancreatic expression of amyloid-forming human amylin indeed induces cerebrovascular inflammation and amylin-Aβ co-deposits. LRP1-mediated Aβ transport across the blood-brain barrier and Aβ clearance through interstitial fluid drainage along vascular walls are impaired, as indicated by Aβ deposition in perivascular spaces. At the molecular level, cerebrovascular amylin deposits alter immune and hypoxia-related brain gene expression. These converging data from humans and laboratory animals suggest that altering bloodborne amylin could potentially reduce cerebrovascular amylin deposits and Aβ pathology.
Introduction
Alzheimer disease (AD) is characterized by overexpression and/or impaired clearance of Aβ that can be related to an early-onset genetic predisposition to Aβ pathology (familial AD) or occur sporadically with age (sporadic AD)1. The factors that balance effective elimination versus accumulation of Aβ have not been fully defined. Well-established pathways of brain Aβ clearance include the interstitial fluid drainage along the walls of cerebral blood vessels, transport across the blood-brain barrier (BBB), and metabolism by microglia and perivascular macrophages2,3,4.
Amylin (also known as islet amyloid polypeptide) is a pancreatic β-cell hormone co-released with insulin5, crosses the BBB6, and is involved in the central regulation of satiation7. In persons with type-2 diabetes mellitus (type-2 DM), amylin forms pancreatic amyloid8,9,10(>95% prevalence at autopsy)10 and is associated with pancreatic inflammation11,12,13. Data from different research teams show that amylin synergistically co-aggregates with Aβ within brain parenchymal tissue and also deposits within brain arterioles and capillaries, in the settings of both sporadic and familial AD14,15,16,17,18,19,20,21,22,23,24. Higher concentrations of pancreas-derived amylin in the central nervous system are associated with an increased frequency of cognitive impairment21,22,23,24. In APPswe/PS1dE9 (APP/PS1) rats, pancreatic expression of human amylin (rodent amylin is non-amyloidogenic) accelerates behavior deficits and brain Aβ deposition21. In rats without Aβ pathology (the HIP rat), pancreatic expression of amyloid-forming human amylin promotes cerebrovascular amylin deposits leading to neuroinflammation18,25,26 and neurological deficits18,21,25. These data form the basis of our hypothesis that increased concentrations of amyloid-forming amylin in the blood promote cerebrovascular amylin deposition and are critical contributing factors to perivascular inflammation and disrupted Aβ clearance in AD. To determine a potential association between pancreas-derived amylin in blood and impaired brain Aβ clearance, we measured amylin concentrations in blood from humans with AD-type dementia versus cognitively unimpaired individuals and assessed the relationships with brain parenchymal and vascular Aβ. To understand the mechanism and uncover novel therapeutic targets for reducing/preventing the development of brain Aβ pathology, we performed comparative pathophysiological characterizations of brain Aβ clearance pathways in transgenic rats expressing amyloid-forming human amylin in the pancreas versus control rats that express endogenous, non-amyloidogenic rat amylin. The results of this study could help better understanding of how altering bloodborne amylin may be used as a therapeutic strategy to potentially reduce cerebrovascular amylin deposits and Aβ pathology.
Results
Pancreatic amyloid-forming amylin accumulates in blood and circulating monocytes
The overall hypothesis tested in our study along with work flow and methods are graphically described in Fig. 1a, b. Using ELISA, we measured amylin concentrations in blood samples collected from cognitively unimpaired individuals (CU; n = 42) and persons with sAD-type dementia (DEM; n = 19) or mild cognitive impairment (MCI; n = 19) (see Table 1 for summary statistics for age and sex). Groups had similar blood glucose concentrations (112.9 ± 5.71 mg/dL vs. 119.1 ± 9.43 mg/dL vs. 113.2 ± 5.10 mg/dL; one-way ANOVA, P = 0.79) and age (79.35 ± 2.18 years vs. 81.35 ± 1.78 years vs. 77.60 ± 0.66 years; one-way ANOVA, P = 0.14). Descriptive statistics of blood amylin concentrations are shown in Supplemental Fig. S1a. Blood amylin concentrations were higher in DEM vs. CU groups (Fig. 1c) (Kruskal-Wallis one-way analysis of variance, P < 0.001). In groups divided based on type-2 DM status, blood amylin concentrations were highly variable (Supplemental Fig. S1b), which may reflect effects of anti-diabetic drugs. A potential link between increased blood amylin concentrations and diabetes was further assessed by measuring the amylin-insulin relationship in the same blood samples as in Fig. 1c. Insulin and amylin ELISAs show that increased blood insulin concentrations are associated with greater blood amylin concentrations (r = 0.52; P < 0.0001) (Fig. 1d and Supplemental Fig. S1c). The pairwise correlation coefficient demonstrates that hyperamylinemia and hyperinsulinemia are correlated in AD.
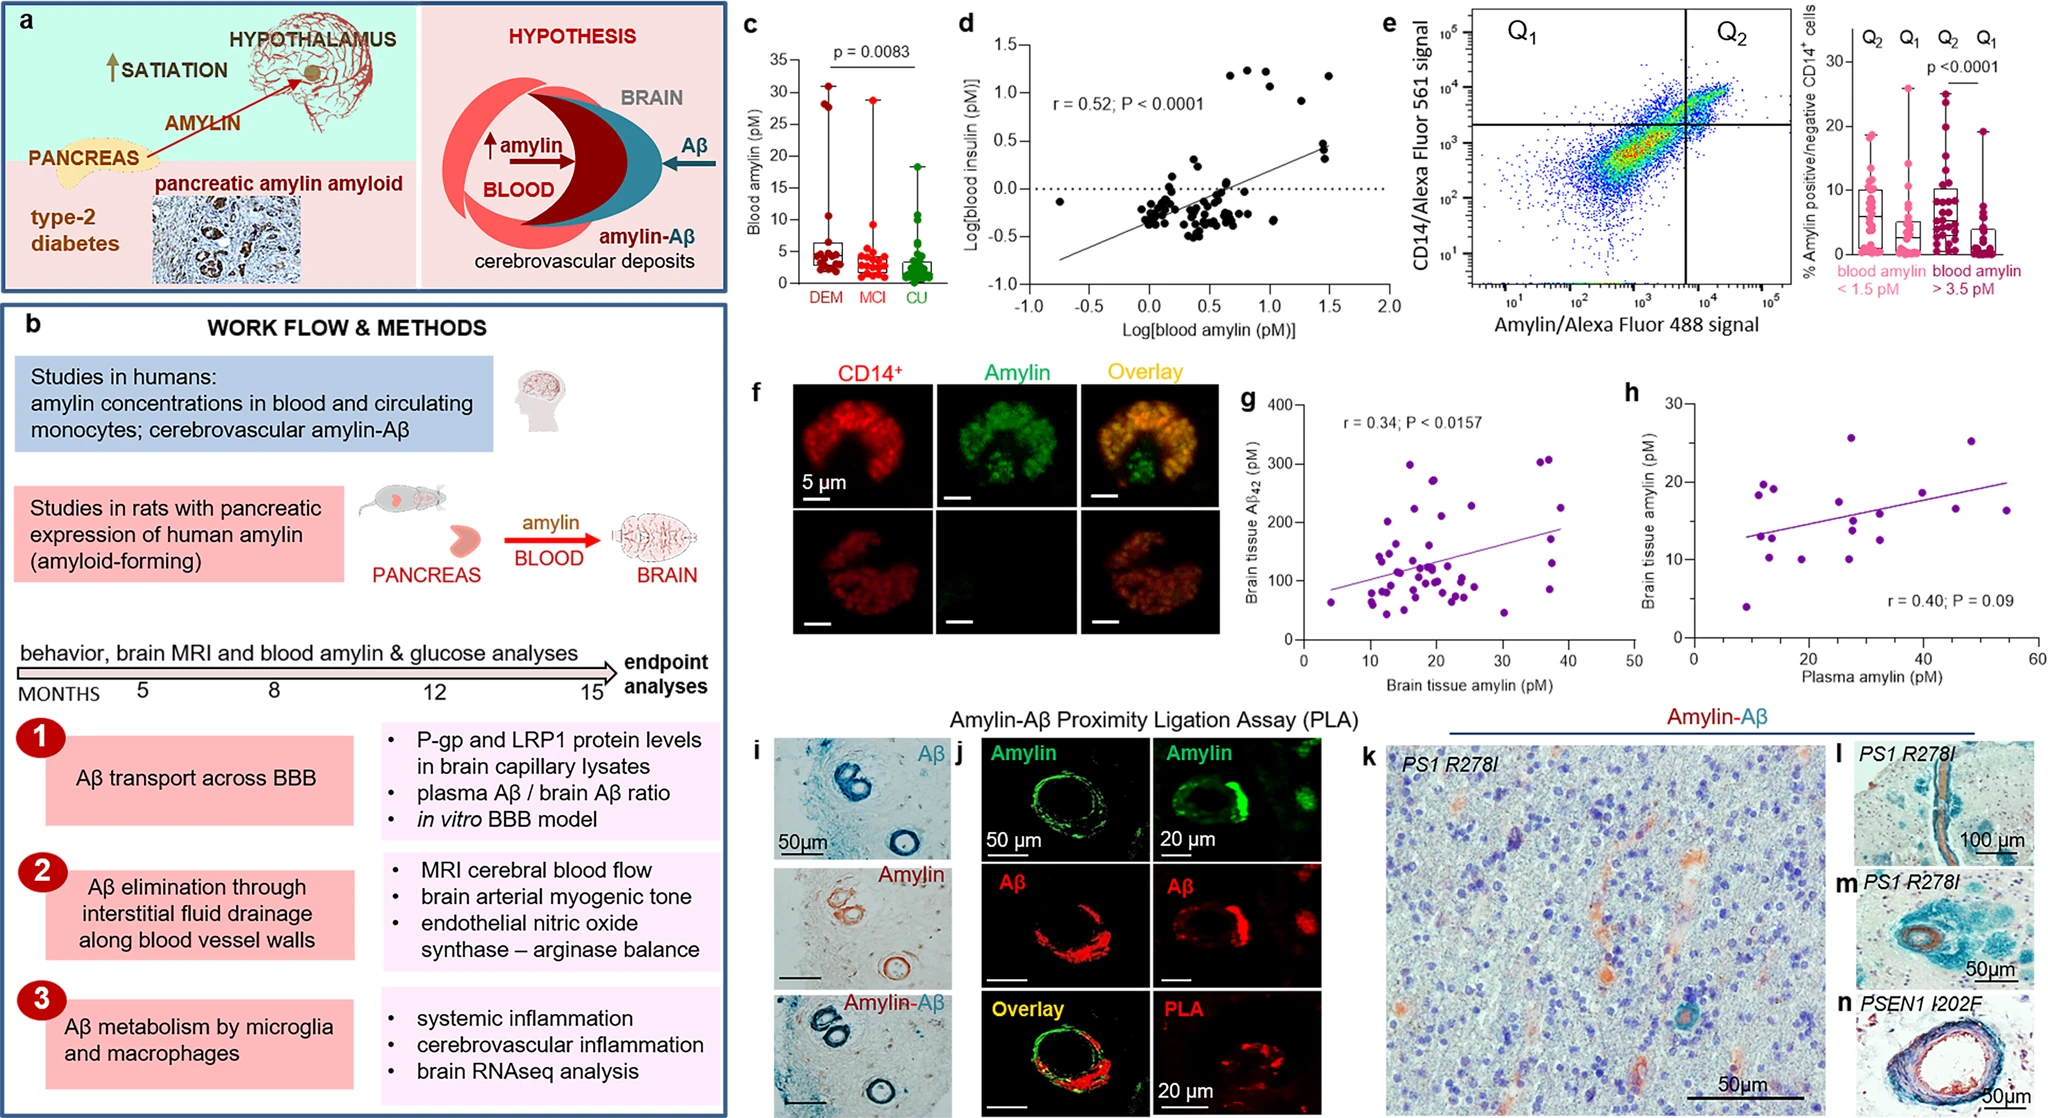
The hypothesis of amylin-induced impairment of brain Aβ clearance.
Putative amylin function (green panel) and pathology (red panels) (a) along with work flow and methods (b). c Blood amylin concentrations in dementia (DEM; n = 19), mild cognitive impairment (MCI; n = 19), and cognitively unimpaired (CU; n = 42) individuals. d Pairwise correlation coefficient (r) between amylin and insulin concentrations in same blood samples as in (c). e Flow cytometry sorting of amylin positive (Q2) or negative (Q1) circulating CD14+monocytes in blood with lower quartile vs. upper quartile amylin concentrations. f Confocal microscopic images showing amylin engulfed in CD14+monocytes (n = 3). Pairwise correlation coefficient (r) between amylin and Aβ42 concentrations in human brains, including persons with sAD (n = 42) and without AD (n = 18) (g), and between matched antemortem plasma amylin concentration and amylin concentration in autopsied brain tissue, including persons with sAD (n = 12) and without AD (n = 8) individuals (h) (potential outliers were removed from the analysis; shown in Supplemental Fig. S1e). i IHC analysis using anti-amylin (brown) and anti-Aβ (green) antibodies on serial sections from a sAD brain (n = 18). j Confocal microscopic analysis and amylin-Aβ proximity ligation assay (PLA) showing vascular amylin-Aβ deposits in a sAD brain. IHC analysis of fAD brains showing Aβ deposits in perivascular spaces and vessel walls with amylin accumulation within the lumen (k, l), and amylin deposits in the vessel wall (m) or vessel wall (n), and Aβ deposits in perivascular spaces (n = 32). Data are presented as box and whiskers or correlation analyses; Kruskal–Wallis one-way of variance, Data are means ± SEM.
| DEM | MCI | CU | |
|---|---|---|---|
| Blood samples | n = 19 | n = 19 | n = 42 |
| Sex, female/male (% female) | 9/10 (47.4%) | 14/4 (77.8%) | 20/21 (48.8%) |
| Age at collection (avg ± SEM) | 79.35 ± 2.18 | 81.35 ± 1.78 | 77.60 ± 0.66 |
| Type-2 diabetes | 6 (28.5%) | 5 (25%) | 6 (14.28%) |
| DEM | CU | ||
| Frozen brain tissue | n = 42 | n = 18 | |
| Sex, female/male (% female) | 25/17 (59.5%) | 14/4 (77.8%) | |
| Age at collection (avg ± SEM) | 85.65 ± 7.04 | 87.22 ± 7.3 | |
| Type-2 diabetes | 22 (52.4%) | 6 (33.3%) |
Summary statistics for age, sex and type-2 DM status in individuals included in the cross-sectional analyses of: 1, amylin in blood and circulating monocytes; and 2, brain amylin and Aβ42 concentrations by using ELISA.
Because increased secretion of amyloid-forming amylin promotes amylin accumulation in macrophages and dendritic cells within pancreatic islets11,12,13, we hypothesized that chronically elevated blood amylin levels trigger systemic inflammation. Using flow cytometry, we sorted fractions of circulating CD14+ monocytes positive for amylin. We quantified fractions of circulating monocytes positive for amylin (Q2) and those negative for amylin (Q1) in blood samples with amylin concentrations in the upper quartile (>3.5 pM) and in those with amylin concentrations in the lower quartile (<1.5 pM). Blood samples with amylin concentrations in the upper quartile (>3.5 pM) contained increased fractions of CD14+monocytes positive for amylin (Q2) (Fig. 1e). Confocal microscopic imaging confirmed amylin inclusions in circulating CD14+ monocytes (Fig. 1f).
Amylin and Aβ co-aggregate within the brain microvasculature, in persons with AD
We next aimed to delineate possible associations between increased blood amylin concentration and amylin and Aβ accumulation in the brain. Using ELISA, we measured concentrations of amylin and Aβ42 in temporal cortex homogenates from persons with sAD identified by well-established neuropathological characteristics27,28,29,30,31 (n = 42; n = 22 with type-2 DM) and from individuals without sAD pathology (n = 18; n = 6 with type-2 DM) (see Table 2 for clinical data). Individuals are age-similar (85.65 ± 7.04 years vs. 87.22 ± 7.30 years), in the sAD vs. non-AD groups. Brain amylin concentrations were higher in persons from the sAD compared to those in the control group (unpaired t test, P < 0.01) (Supplemental Fig. S1d), consistent with previous results from other cohorts15,21. There was no difference in brain amylin levels between those with type-2 DM versus those without (Supplemental Fig. S1e); however, the analysis did not control for the potential effects of glycemic drugs nor for medications given to individuals with cognitive impairment. Increased brain amylin concentrations were associated with greater Aβ42 concentrations (r = 0.34; P < 0.05) (Fig. 1g), consistent with the amylin-Aβ42 relationship recently identified in fAD brains21. Using matched plasma and brain tissue homogenates that were available in this cohort (n = 12 in the sAD group n = 8 controls), we assessed the relationship between antemortem plasma amylin concentrations and amylin concentrations in autopsied brain tissue. The pairwise correlation coefficient suggests a possible relationship between circulating amylin levels and the propensity of amylin to accumulate in the brain (r = 0.40; P = 0.09) (Fig. 1h) (analysis excluded potential outliers of brain tissue amylin concentrations; Supplemental Fig. S1e). The small sample size of matched plasma and brain samples is a limitation.
| # | Sex | Age | Type-2 DM | Braak stage | Amyloid Angiopathy | MMSE | CERAD |
|---|---|---|---|---|---|---|---|
| 1 | F | 95 | NO | 0 | NO | 26 | A=CERAD possible |
| 2 | F | 97 | NO | 4 | NO | 24 | A=CERAD possible |
| 3 | M | 92 | NO | 0 | NO | 30 | NO |
| 4a | F | 90 | NO | 3 | NO | 29 | NO |
| 5 | F | 75 | NO | 1 | NO | 23 | NO |
| 6 | F | 84 | NO | 0 | NO | 30 | NO |
| 7 | F | 84 | NO | 1 | NO | 29 | NO |
| 8a | F | 85 | NO | 4 | MILD | 23 | NO |
| 9 | F | 93 | NO | 2 | NO | 30 | NO |
| 10 | F | 96 | NO | 2 | MODERATE | 30 | NO |
| 11a | F | 90 | NO | 2 | MILD | 30 | NO |
| 12a | F | 80 | NO | 1 | NO | 28 | NO |
| 13 | M | 87 | YES | 2 | NO | 27 | NO |
| 14a | F | 84 | YES | 1 | MILD | 26 | NO |
| 15 | F | 92 | YES | 2 | NO | 29 | NO |
| 16a | F | 87 | YES | 3 | NO | 28 | NO |
| 17a | F | 90 | YES | 2 | NO | 29 | NO |
| 18a | F | 69 | YES | 1 | NO | 29 | NO |
| 19 | F | 87 | NO | 4 | MILD | 30 | C=Definite AD |
| 20 | F | 78 | NO | 6 | MILD | 0 | C=Definite AD |
| 21a | F | 91 | NO | 2 | MODERATE | 29 | B=CERAD probable |
| 22 | M | 78 | NO | 6 | MILD | 15 | C=Definite AD |
| 23a | M | 85 | NO | 6 | MODERATE | 16 | B=CERAD probable |
| 24a | F | 93 | NO | 2 | NO | 29 | B=CERAD probable |
| 25a | M | 84 | NO | 4 | MODERATE | 24 | B=CERAD probable |
| 26 | M | 89 | NO | 1 | MILD | 26 | C=Definite AD |
| 27 | M | 73 | NO | 6 | NO | 16 | C=Definite AD |
| 28 | F | 88 | NO | 3 | NO | 28 | C=Definite AD |
| 29a | M | 75 | NO | 6 | SEVERE | 5 | C=Definite AD |
| 30 | F | 101 | NO | 4 | NO | 26 | B=CERAD probable |
| 31a | M | 98 | NO | 2 | SEVERE | 24 | B=CERAD probable |
| 32a | F | 92 | NO | 5 | MILD | 19 | C=Definite AD |
| 33 | M | 79 | NO | 6 | MILD | 6 | C=Definite AD |
| 34a | F | 91 | NO | 5 | MILD | 13 | C=Definite AD |
| 35 | M | 67 | NO | 6 | MILD | 11 | C=Definite AD |
| 36a | F | 87 | NO | 3 | MILD | 30 | B=CERAD probable |
| 37 | F | 98 | NO | 4 | NO | 13 | B=CERAD probable |
| 38 | M | 91 | NO | 1 | SEVERE | 28 | NO |
| 39 | F | 79 | YES | 6 | SEVERE | 19 | C=Definite AD |
| 40 | F | 86 | YES | 2 | NO | 30 | B=CERAD probable |
| 41 | F | 91 | YES | 3 | MILD | 25 | B=CERAD probable |
| 42 | F | 91 | YES | 5 | MODERATE | 9 | C=Definite AD |
| 43 | M | 87 | YES | 3 | NO | 21 | A=CERAD possible |
| 44 | M | 75 | YES | 5 | MILD | 28 | C-Definite AD |
| 45 | F | 86 | YES | 6 | MILD | 14 | C-Definite AD |
| 46a | M | 77 | YES | 4 | MILD | 30 | B=CERAD probable |
| 47a | M | 86 | YES | 2 | NO | 28 | A=CERAD possible |
| 48a | M | 81 | YES | 1 | NO | 26 | A=CERAD possible |
| 49 | M | 86 | YES | 6 | MODRATE | 29 | C-Definite AD |
| 50 | F | 93 | YES | 4 | MODERATE | 28 | B=CERAD probable |
| 51 | M | 96 | YES | 4 | MILD | 21 | B=CERAD probable |
| 52 | M | 89 | YES | 4 | MODERATE | 26 | B=CERAD probable |
| 53 | M | 85 | YES | 6 | SEVERE | 4 | C-Definite AD |
| 54 | F | 83 | YES | 4 | MODERATE | 23 | B=CERAD probable |
| 55 | F | 81 | YES | 5 | MILD | 14 | C-Definite AD |
| 56 | F | 85 | YES | 2 | NO | 24 | B=CERAD probable |
| 57 | F | 84 | YES | 6 | SEVERE | 7 | C-Definite AD |
| 58 | F | 81 | YES | 5 | MODERATE | 13 | C-Definite AD |
| 59 | F | 88 | YES | 6 | MODERATE | 29 | C-Definite AD |
| 60 | M | 85 | YES | 3 | NO | 30 | A=CERAD possible |
| # | Sex | Age | Type-2 Diabetes | AD | Amyloid Angiopathy | Clinical finding | |
| 1b | M | 77 | YES | No | NO | MCI | |
| 2b | M | 82 | YES | No | Severe | MCI | |
| 3b | M | 83 | YES | Yes | Severe | DEMENTED | |
| 4b | F | 77 | YES | No | NO | DEMENTED | |
| 5b | M | 90 | NO | Yes | Severe | DEMENTED | |
| 6b | F | 91 | NO | No | Severe | NORMAL | |
| 7b | M | 93 | NO | Yes | Severe | DEMENTED | |
| 8b | F | 77 | YES | No | NO | NORMAL | |
| 9b | M | 88 | NO | No | Severe | DEMENTED | |
| 10b | M | 91 | NO | Yes | Severe | DEMENTED | |
| 11b | M | 84 | NO | No | NO | NORMAL | |
| 12b | M | 95 | NO | No | NO | MCI | |
| 13b | F | 81 | YES | No | NO | NORMAL | |
| 14b | F | 90 | NO | Yes | Severe | DEMENTED | |
| 15b | F | 87 | YES | Yes | NO | DEMENTED | |
| 16b | M | 87 | NO | Yes | Severe | DEMENTED | |
| 17b | F | 77 | YES | Yes | Severe | DEMENTED | |
| 18b | M | 79 | YES | yes | Severe | DEMENTED |
Clinical and neuropathological information, age and sex of each individual included in the plasma amylin and brain amylin and Aβ analyses by ELISA, and in the IHC analysis of cerebrovascular amylin-Aβ co-localization.
The absence/presence of diabetes was determined during life (at longitudinal clinical visits) by patient or caregiver self-report and the use of diabetic medications. The assessment of clinical dementia and the neuropathologic features – neuritic amyloid plaques (Consortium to Establish a Registry for Alzheimer’s Disease; CERAD), Braak NFT stage and cerebral amyloid angiopathy (CAA) severity – were scored as previously described27,28,29,30,31. aPlasma samples from these patients were used in amylin ELISA measurements. bThese brain samples were used in immunohistochemistry.
To test potential overlapping of amylin and Aβ at the BBB, we analyzed sAD and fAD brains for histological evidence of vascular amylin-Aβ co-localization by using immunohistochemistry (IHC), confocal microscopy and proximity ligation assay (PLA) with anti-amylin and anti-Aβ antibodies. For deconvolution and analysis of amylin immunoreactivity intensity signals on IHC images, pancreatic tissue from a patient with type-2 DM served as a positive control for amylin deposition (Supplemental Fig. S1f). Histopathological analysis of cerebrovascular amylin-Aβ co-localization is summarized in Table 3. Representative images from serial sectioning and IHC staining with anti-amylin, anti-Aβ and combined anti-amylin and anti-Aβ antibodies in temporal cortex tissues from an 83-years old woman with sAD and type-2 DM are shown in Fig. 1i. Confocal microscopic analysis and PLA with the same anti-amylin and anti-Aβ antibodies further confirmed cerebrovascular amylin-Aβ deposition (Fig. 1j). The PLA signal shows an overall consistency with amylin-Aβ colocalization appearing within the arteriolar wall. For comparison, images of IHC analysis of temporal cortex tissue from an 86-years old cognitively unimpaired woman without type-2 diabetes are shown in Supplemental Fig. S1g. In Fig. 1k–n and Supplemental Figs. S1h, we present additional examples of cerebrovascular amylin-Aβ co-localization from IHC analyses in a subset of brains of patients with fAD and with documented amylin accumulation through IHC and ELISA21. Aβ deposits are present in perivascular spaces and arterial walls, whereas amylin appears to accumulate within the lumen (Fig. 1k, l), arterial wall (Fig. 1m) and on the luminal side (Fig. 1n). The IHC analysis detected amylin in approximately 2/3 of the total blood vessels staining positive for Aβ in fAD brains (Table 3). Confocal microscopic analysis of brain section triple stained with anti-amylin, anti-Aβ, and anti-α smooth muscle cell (SMC) actin antibodies further supports co-localization patterns in which Aβ is present in perivascular areas and amylin within the blood vessel wall (Supplemental Fig. S1i).
| Cerebrovascular amylin, Aβ and amylin-Aβ deposits (sAD) | Patients/total (%) |
|---|---|
| Independent amylin deposits in vasculature | 09/18 (50%) |
| Independent Aβ deposits in vasculature | 07/18 (38.89%) |
| Mixed amylin-Aβ deposits in vasculature | 09/18 (50%) |
| Cerebrovascular amylin, Aβ and amylin-Aβ deposits (fAD) | Patients/total (%) |
| Independent amylin deposits in vasculature | 23/32 (71%) |
| Independent Aβ deposits in vasculature | 02/32 (6.25%) |
| Mixed amylin-Aβ deposits in vasculature | 28/32 (87.5%) |
Summary of histopathological analysis of cerebrovascular amylin-Aβ deposition in sAD and fAD brains.
Our data show accumulation of pancreatic amyloid-forming amylin in the blood and circulating monocytes, and amylin co-localized with Aβ in the brain vasculature, in persons with AD. The results suggest the hypothesis that increased concentrations of amyloid-forming amylin in the blood perturb cerebral Aβ efflux, possibly involving inflammation.
In rats, pancreatic expression of human amylin induces inflammation and cerebrovascular amylin-Aβ deposition (amylin vasculopathy) leading to late-life onset behavior deficits
We used rats in which pancreatic β-cells express human amylin (the HIP rat model18) and wild type (WT) rats expressing the endogenous non-amyloidogenic rat amylin, to determine potentially causative effects of increased concentrations of amyloid-forming human amylin in the blood on the development of systemic and cerebrovascular inflammation. The specificity of human amylin RNA expression in the pancreas and lack of human amylin RNA in the brain in HIP rats was documented by qRT-PCR, as reported previously25. Male and female HIP rats develop type-2 DM associated with pancreatic amylin amyloid deposition18,32 glucose dysregulation18,32 and neurological deficits18,25. Glucose dysregulation and behavioral deficits develop later (by ~6 months) in HIP female vs. male rats, as we reported previously18. Blood amylin concentrations increase with higher blood glucose (Fig. 2a). At the age at which HIP rats develop neurological deficits (~16-months) (Supplemental Fig. S2), blood amylin concentrations in HIP male rats were within a similar range as in persons with cognitive decline (Fig. 2b).
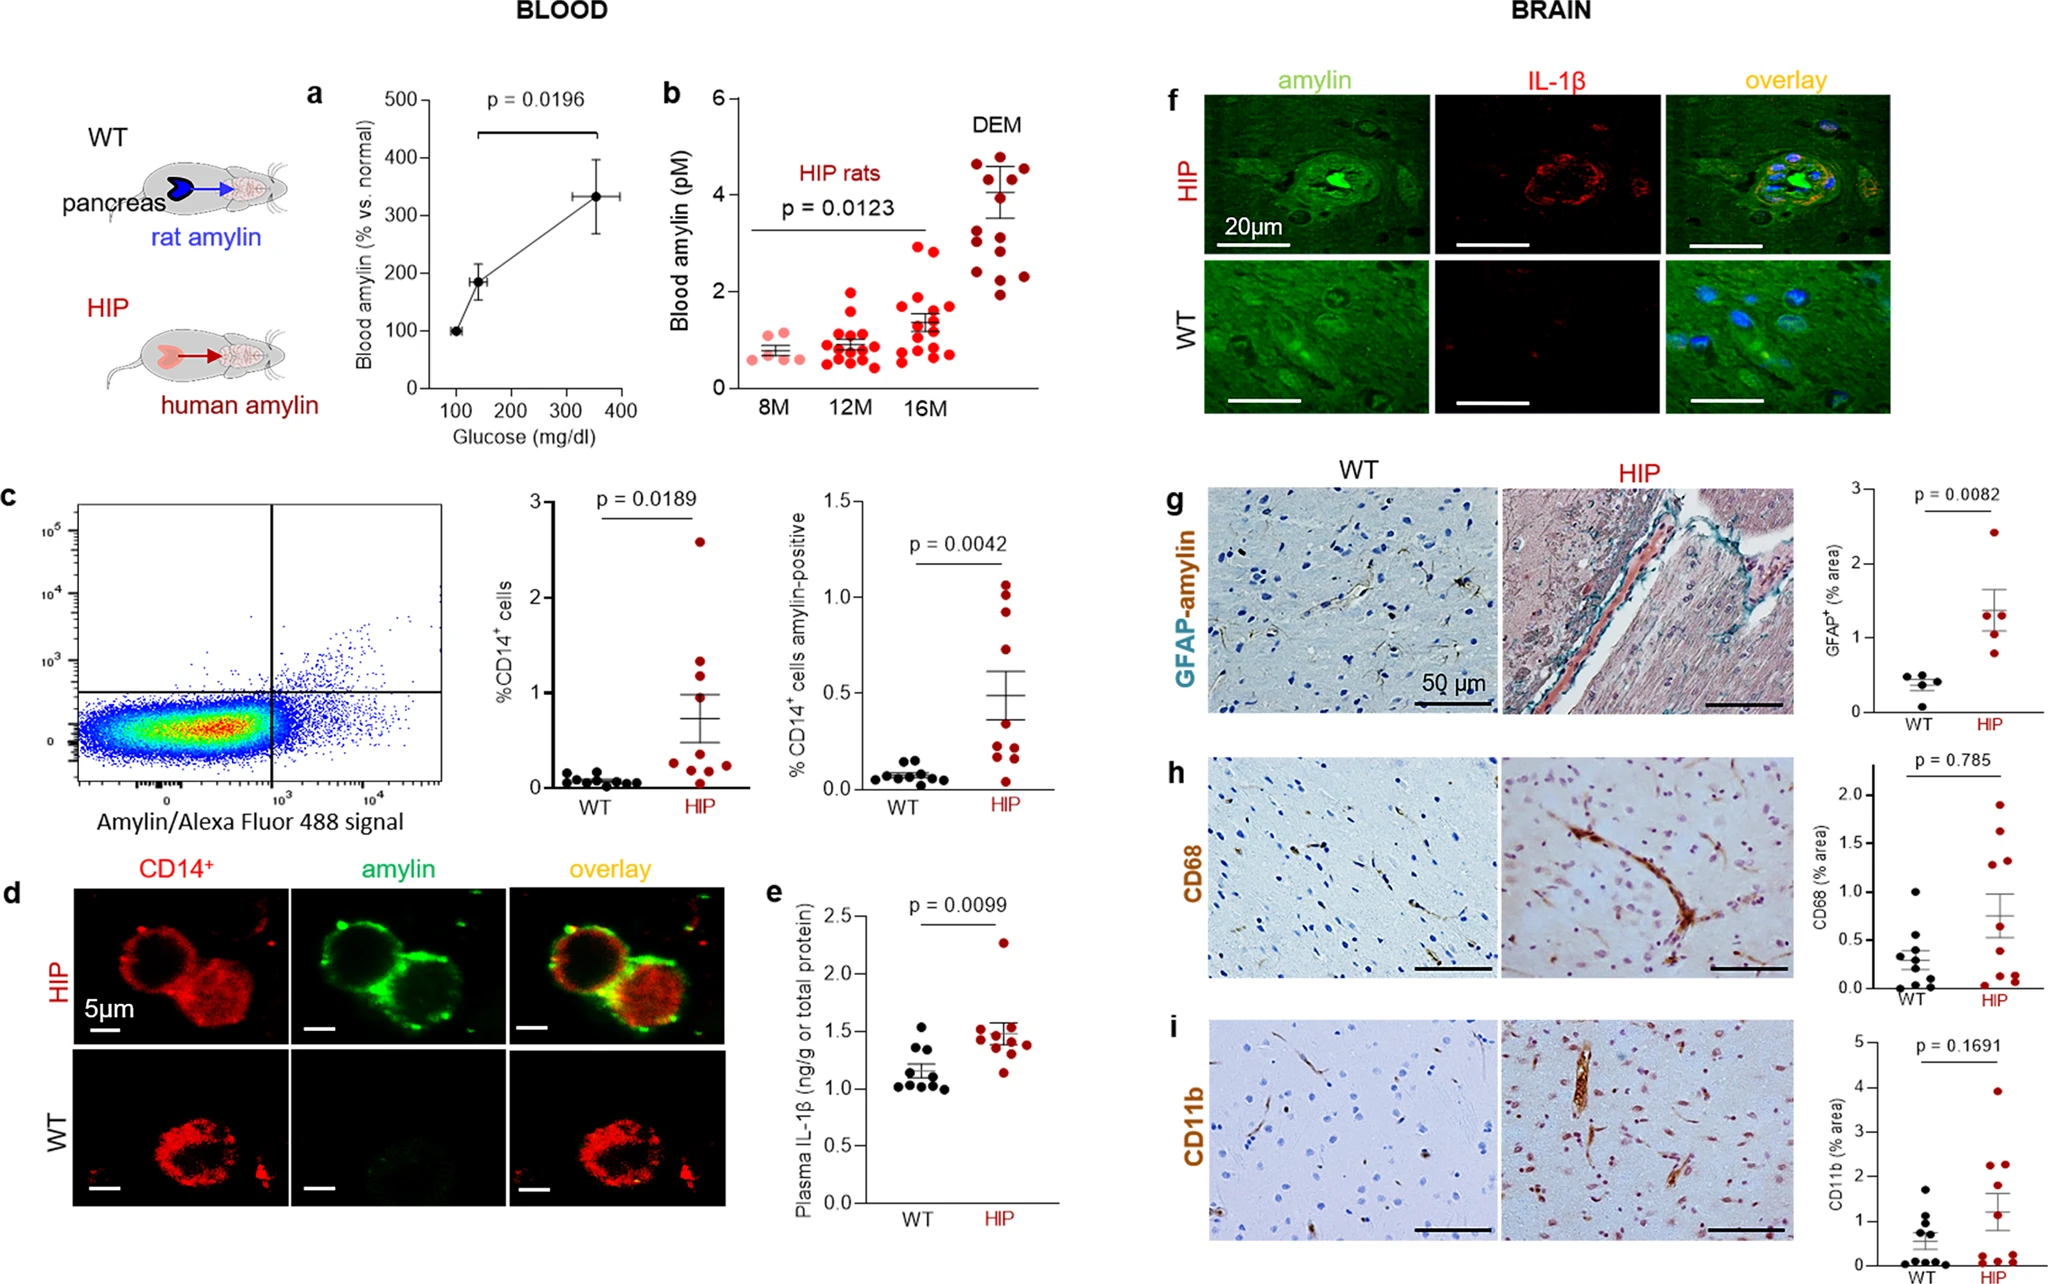
Systemic and cerebrovascular inflammation in rats with pancreatic expression of amyloid-forming human amylin (HIP rats).
a Cross-sectional blood amylin and glucose concentrations in HIP rats age 6–8 months (n = 6), age 10–12 months (n = 13), and age 15–16 months (n = 12). bBlood amylin concentrations in humans with dementia (DEM) vs. HIP rats; same rats as in (n = 16) (a). c Flow cytometry sorting of circulating CD14+monocytes positive for amylin in blood from same rats as in (b) (n = 10 males/group). d Confocal microscopic images of circulating monocytes stained for CD14+ (red) and amylin (green) in blood from the same rats as in (b) (n = 5 blood samples/group). e Interleukin (IL)-1β ELISA in plasma from HIP vs WT rats similar to groups in (b) (n = 10 males/group). f Confocal microscopic images showing IL-1β and amylin deposits in brain blood vessels in rats studied in (b) (n = 3 males/group). g IHC analysis of brain sections from HIP and WT rats from the same groups as in (c) showing vascular deposits of amylin (brown) and astroglial reactions (green stains for glial fibrillar acidic protein; GFAP) (n = 5 males/group). IHC analysis of phagocytic microglia (CD68) (h) and vascular monocyte recruitment (CD11b) (i) in brain sections from HIP vs WT rats from the same groups as in (b) (n = 10 males/group). Data are means ± SEM; unpaired t-test for all panels.
Using flow cytometry, we found higher numbers of CD14+ monocytes and amylin-positive CD14+ monocytes in blood from HIP rats compared to those in the blood from WT littermates (Fig. 2c). As in human blood from persons with AD (Fig. 1f), confocal microscopic imaging of circulating monocytes stained for CD14+ (have also amylin deposits (Fig. 2d).
Pancreatic amyloid-forming amylin activates the NLRP3 inflammasome in macrophages and dendritic cells leading to interleukin (IL)-1β maturation and pancreatic islet inflammation11,12,13. The concentration of pro-inflammatory cytokine IL-1β in plasma was higher in HIP rats than in WT littermates (Fig. 2e). This was associated with increased IL-1β immunoreactivity signal intensity in HIP rat brain blood vessel walls (Fig. 2f), consistent with previously published data from IL-1β analysis in HIP rat brain parenchymal tissue25,26. Using IHC with anti-amylin and anti-glial fibrillar acidic protein (GFAP) antibodies, we detected cerebrovascular amylin-induced astroglial reaction in HIP rat brains (Fig. 2g). This appears to be associated with vascular recruitment of monocytes and macrophages as suggested by IHC with antibodies against Cluster of Differentiation (CD) 68 and CD11b (Fig. 2h, i). These results indicate chronic exposure to amyloid-forming amylin secreted from the pancreas as a trigger of systemic- and local cerebrovascular inflammation.
The Thioflavin T (ThT) fluorescence signal intensity in blood lysates was higher in HIP rats than in WT littermates (Fig. 3a) indicating amyloid-forming amylin accumulation in the blood. Using ELISA, we found increased amylin concentrations in HIP rat brain microvessel lysates compared to brain microvessel lysates from WT littermates, age 16-months (Fig. 3b). Co-staining of brain slices from HIP and WT rats with anti-Aβ and anti-amylin antibodies detected vascular amylin-Aβ deposition in HIP rats (Fig. 3c). In HIP rat brains, amylin immunoreactivity was detected on the luminal side of the blood vessel, often with Aβ within perivascular spaces and scattered through parenchymal tissue.
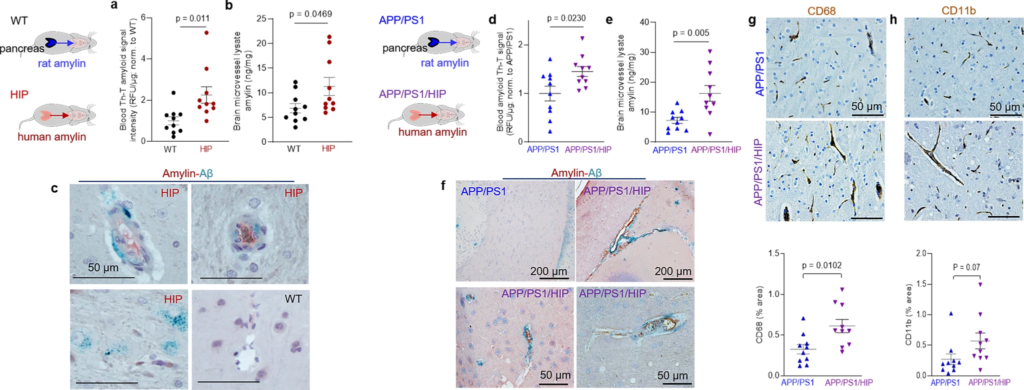
Cerebrovascular amylin-Aβ deposition induced by amyloid-forming human amylin secreted from the pancreas.
a Thioflavin T (Th T) fluorescence signal intensities in blood lysates from HIP rats and WT littermates (age 15-16-months; n = 10 males/group). b Amylin concentrations in brain microvessel lysates in HIP and WT rats similar to those in (a) (n = 10 males/group). c IHC analysis of HIP rat brains showing Aβ deposits (green) in perivascular spaces and amylin accumulation (brown) within the lumen. (n = 5 males/group; age 15–16-months). d Average Thioflavin T (Th T) fluorescence signal intensities in blood lysates from APP/PS1/HIP and APP/PS1 littermates age 15–16-months (n = 10 rat males/group). e Amylin concentrations in brain microvessel lysates from same rats as above. f Representative IHC micrographs of brain sections from APP/PS1/HIP and APP/PS1 rats co-stained with anti-amylin (brown) and anti-Aβ (green) antibodies (n = 5 males/group; age 15–16-months) (3 slides/brain). Representative IHC images and analysis of phagocytic microglia (CD68) (g) and vascular monocyte recruitment (CD11b) (h) in brain sections from APP/PS1/HIP vs APP/PS1 rat males (n = 10 males/group; age 16-months). Data are means ± SEM; unpaired t-test for all panels.
We further employed APP/PS1 rats with pancreatic expression of human amylin (APP/PS1/HIP rats) to study the impact of pancreatic amyloid-forming human amylin on cerebrovascular Aβ in the setting of AD-like pathology. APP/PS1/HIP rats develop amylin-Aβ deposits in the brain21. Compared to APP/PS1 littermates, APP/PS1/HIP rats have increased Th-T signal intensity in blood lysates (Fig. 3d) and amylin accumulation in brain microvessels (Fig. 3e). IHC with anti-Aβ (green) and anti-amylin (brown) antibodies revealed vascular tissue areas of amylin-Aβ co-localization in APP/PS1/HIP rat brains, whereas APP/PS1 littermates had no cerebrovascular amylin-Aβ deposits (Fig. 3f). This was associated with vascular recruitment of monocytes and macrophages as indicated by IHC with antibodies against CD68 and CD11b (Fig. 3g, h), similar to cerebrovascular inflammation demonstrated in HIP rats (Fig. 2h, i).
Our results show that late-life onset of neurological deficits in rats with pancreatic-specific expression of human amylin (Supplemental Fig. 2) are associated with amylin deposition in cerebral arterioles (including co-deposits with Aβ) (Fig. 3c, f) and in capillaries (Fig. 2b, e), and with the development of systemic and cerebrovascular inflammation (Figs. 2 and 3g, h). These results replicate our findings in humans (Fig. 1).
Amylin vasculopathy impairs cerebral Aβ efflux through altering cerebral vasodilation
Impaired interstitial fluid drainage in the brain is indicated by the presence of perivascular Aβ deposits (as in Fig. 3c, f) and is attributed to alterations in contractility and relaxation of vascular SMCs2,3,4. Endothelial nitric oxide (NO)-arginase homeostasis, a mediator of vascular myogenic tone33, is impaired in HIP rats and is associated with endothelial dysfunction34. We used cerebral blood flow (CBF), pressure myography, and vascular SMC oxidative stress experiments in HIP versus WT rats to test a possible association between increased concentrations of amyloid-forming amylin in the blood and impairment of cerebral vasodilation.
Longitudinal brain MRI measurements revealed consistent structural alterations that progressed more rapidly with aging in HIP vs. WT rats (Fig. 4a). Cerebral perfusion was assessed using pseudo-continuous arterial spin labeling (ASL)35. The results show reduced CBF in HIP rats, age 15–16 months (Fig. 4b). Plasma concentrations of nitrite and nitrate (stable NO end products) were increased in HIP vs. WT rats, age 15–16 months (Fig. 4c), possibly as a result of systemic inflammation in HIP rats (as suggested by data in Fig. 2). Pressure myography experiments using isolated pial arteries demonstrate that both WT and HIP arteries develop arterial tone36 (e.g., pressure-induced constriction) (Fig. 4d); however, arteries from HIP rats show elevated arterial tone compared to WT rats with increasing intravascular pressure (e.g., 60–100 mmHg) (Fig. 4d, e). To further verify the amylin-induced impairment of arterial tone, we used cerebral arteries isolated from WT rats and amylin knockout (AKO) rats, and from AKO rats intravenously injected with amyloid-forming human amylin at a regimen that replicates the amylin immunoreactivity signal intensity measured in human plasma18 (i.e., 60 µg/kg body weight; daily IV injection via tail vein for 1 week). Arterial tone is similar in cerebral arteries from WT and AKO rats (Fig. 4f); however, arterial tone was elevated in arteries from rats injected with human amylin (Fig. 4f). These results suggest a direct effect of amylin on impairing arterial tone. Consistent with these results, vascular SMCs from HIP rats have increased lipid peroxidation (Fig. 4g, h), which also occurs in SMCs incubated with exogenous human amylin (Supplemental Fig. S3a, b).
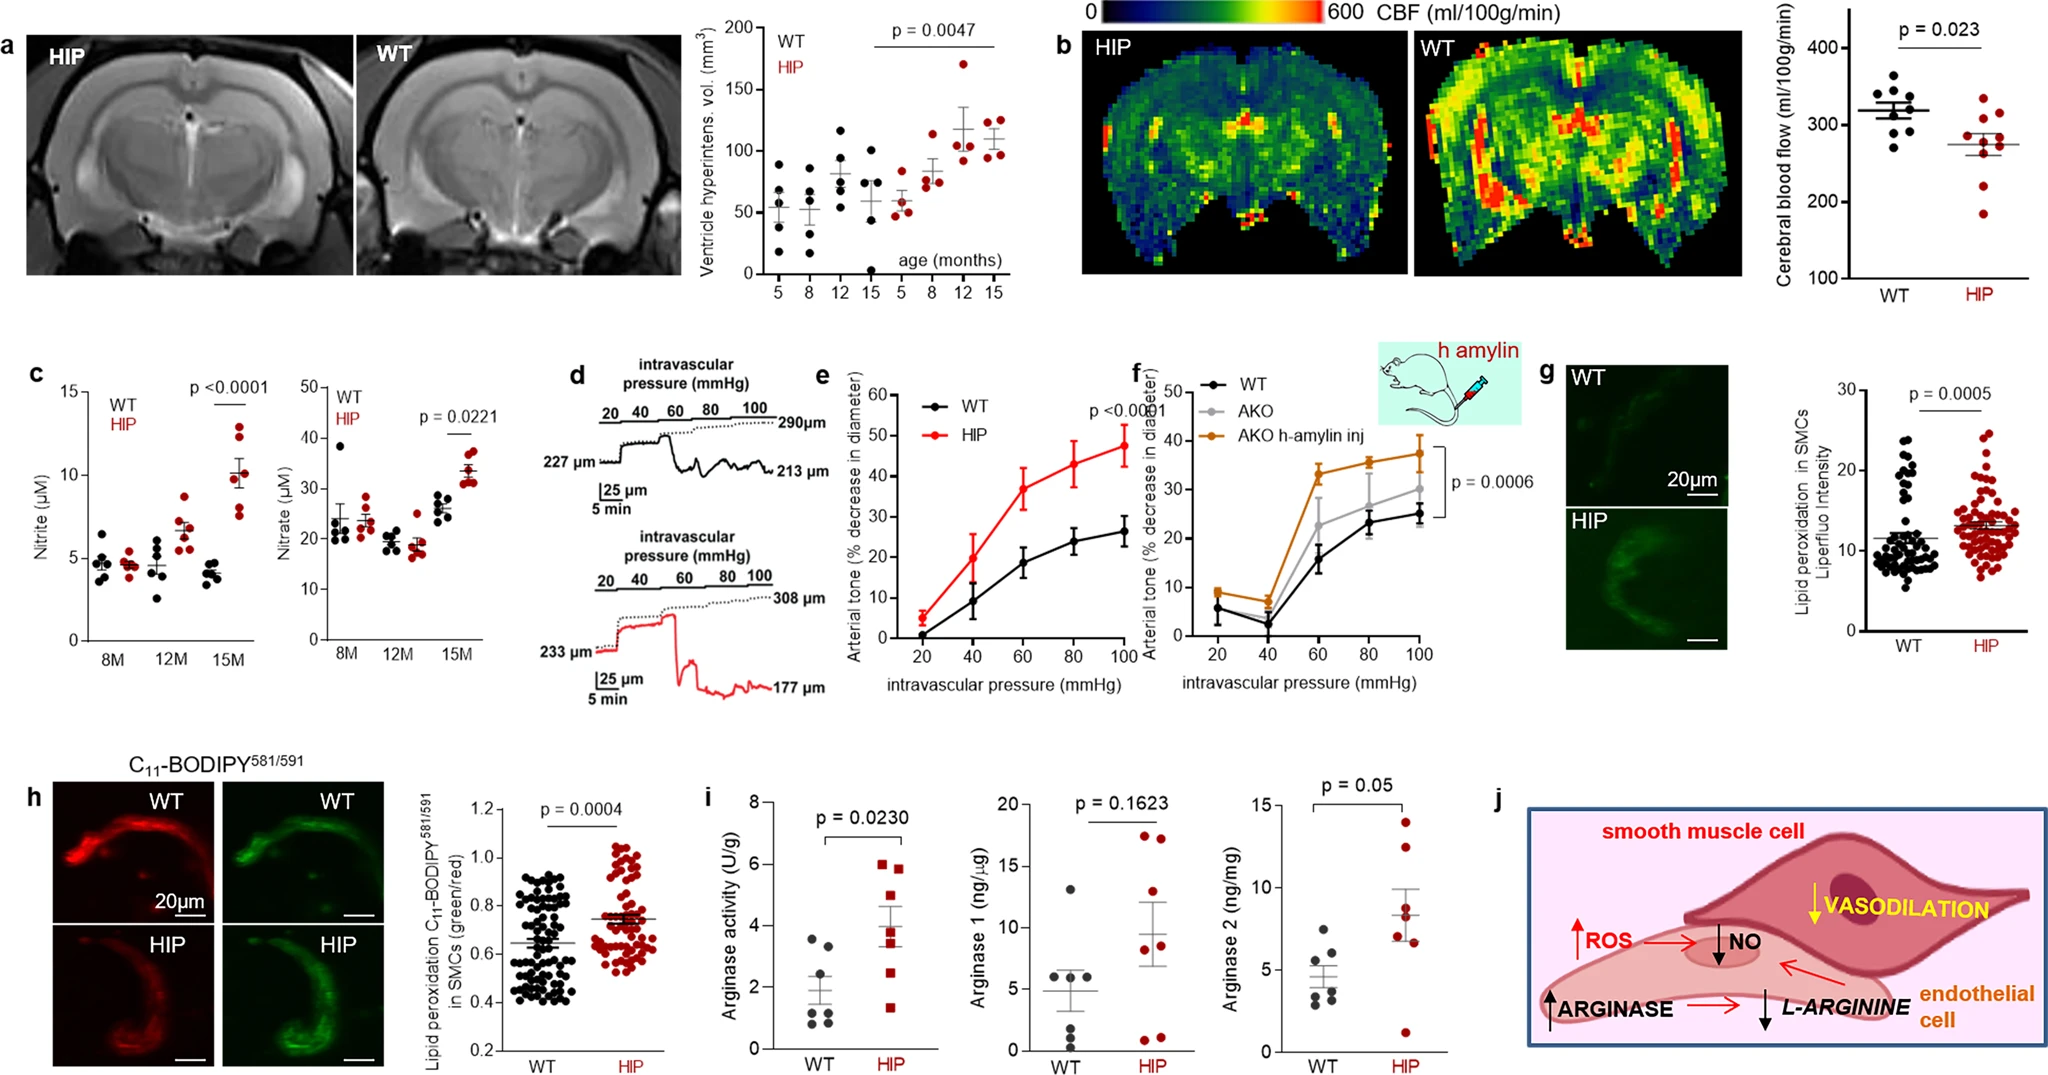
Altered relaxation of vascular smooth muscle cells by increased blood amylin concentrations.
a T2-weighted MRI and longitudinal ventricular hyperintensity volumes in HIP vs. WT rats (n = 4–5 males/group). b CBF maps and global CBF in HIP and WT rats, age 15-16 months (9 males/group). c Cross-sectional concentrations of plasma nitrite and nitrate in HIP and WT rats (n = 6 males/group/age). Diameter traces in pial arteries from HIP and WT rat males at different intravascular pressures (d), and arterial tone of pial arteries (e) measured at the indicated intravascular pressure (2–3 arteries/ rat, n = 6–7 males/group, age 15–16 months). f Same as in (e) in posterior cerebral arteries from WT and amylin knockout (AKO) rats, and in AKO rats intravenously injected with human amylin (n = 3 males/group, age 9–10 months). g, h Lipid peroxidation in pial artery SMCs from WT and diabetic HIP rat males measured with Liperfluo (g; N = 62 SMC from 4 WT rats and 70 cells from 4 HIP rats) and C11-BODIPY581/591 (h; N = 87 SMC from 7 WT rats and 68 cells from 4 HIP rats). i Arginase activity and arginase-1 and arginase-2 concentrations in HIP vs. WT brain microvessel lysates (n = 7 males/group; age 15–16 months). j Proposed mechanism: chronically increased concentrations of pancreatic amyloid-forming amylin in blood cause oxidative stress within the vascular wall leading to NO-arginase dysregulation and impaired SMC function and myogenic tone. Data are means ± SEM. Mann–Whitney non-parametric test for panels (g, h), unpaired t-test for the other panels.
Increased lipid peroxidation contributes to oxidative stress in the vascular wall and reduces NO bioavailability, altering vasodilatory function. Both arginase activity and expression were increased in brain microvascular lysates from HIP rats compared to those from WT littermates (Fig. 4i), suggesting arginase-NO dysregulation (Fig. 4j; proposed mechanism). A possible impact of increased blood amylin concentration on cerebrovascular arginase-NO regulation was further tested in brain microvascular lysates from rats intravenously injected with amyloid-forming human amylin (Supplemental Fig. S3c).
Taken together, our results indicate perivascular Aβ deposits in HIP and APP/PS1/HIP rats (Fig. 3c, f) are potentially linked to altered spontaneous contraction/relaxation of cerebrovascular SMCs caused by the development of amylin vasculopathy.
Amylin deposition in brain capillaries suppresses P-gp and LRP1 protein expression
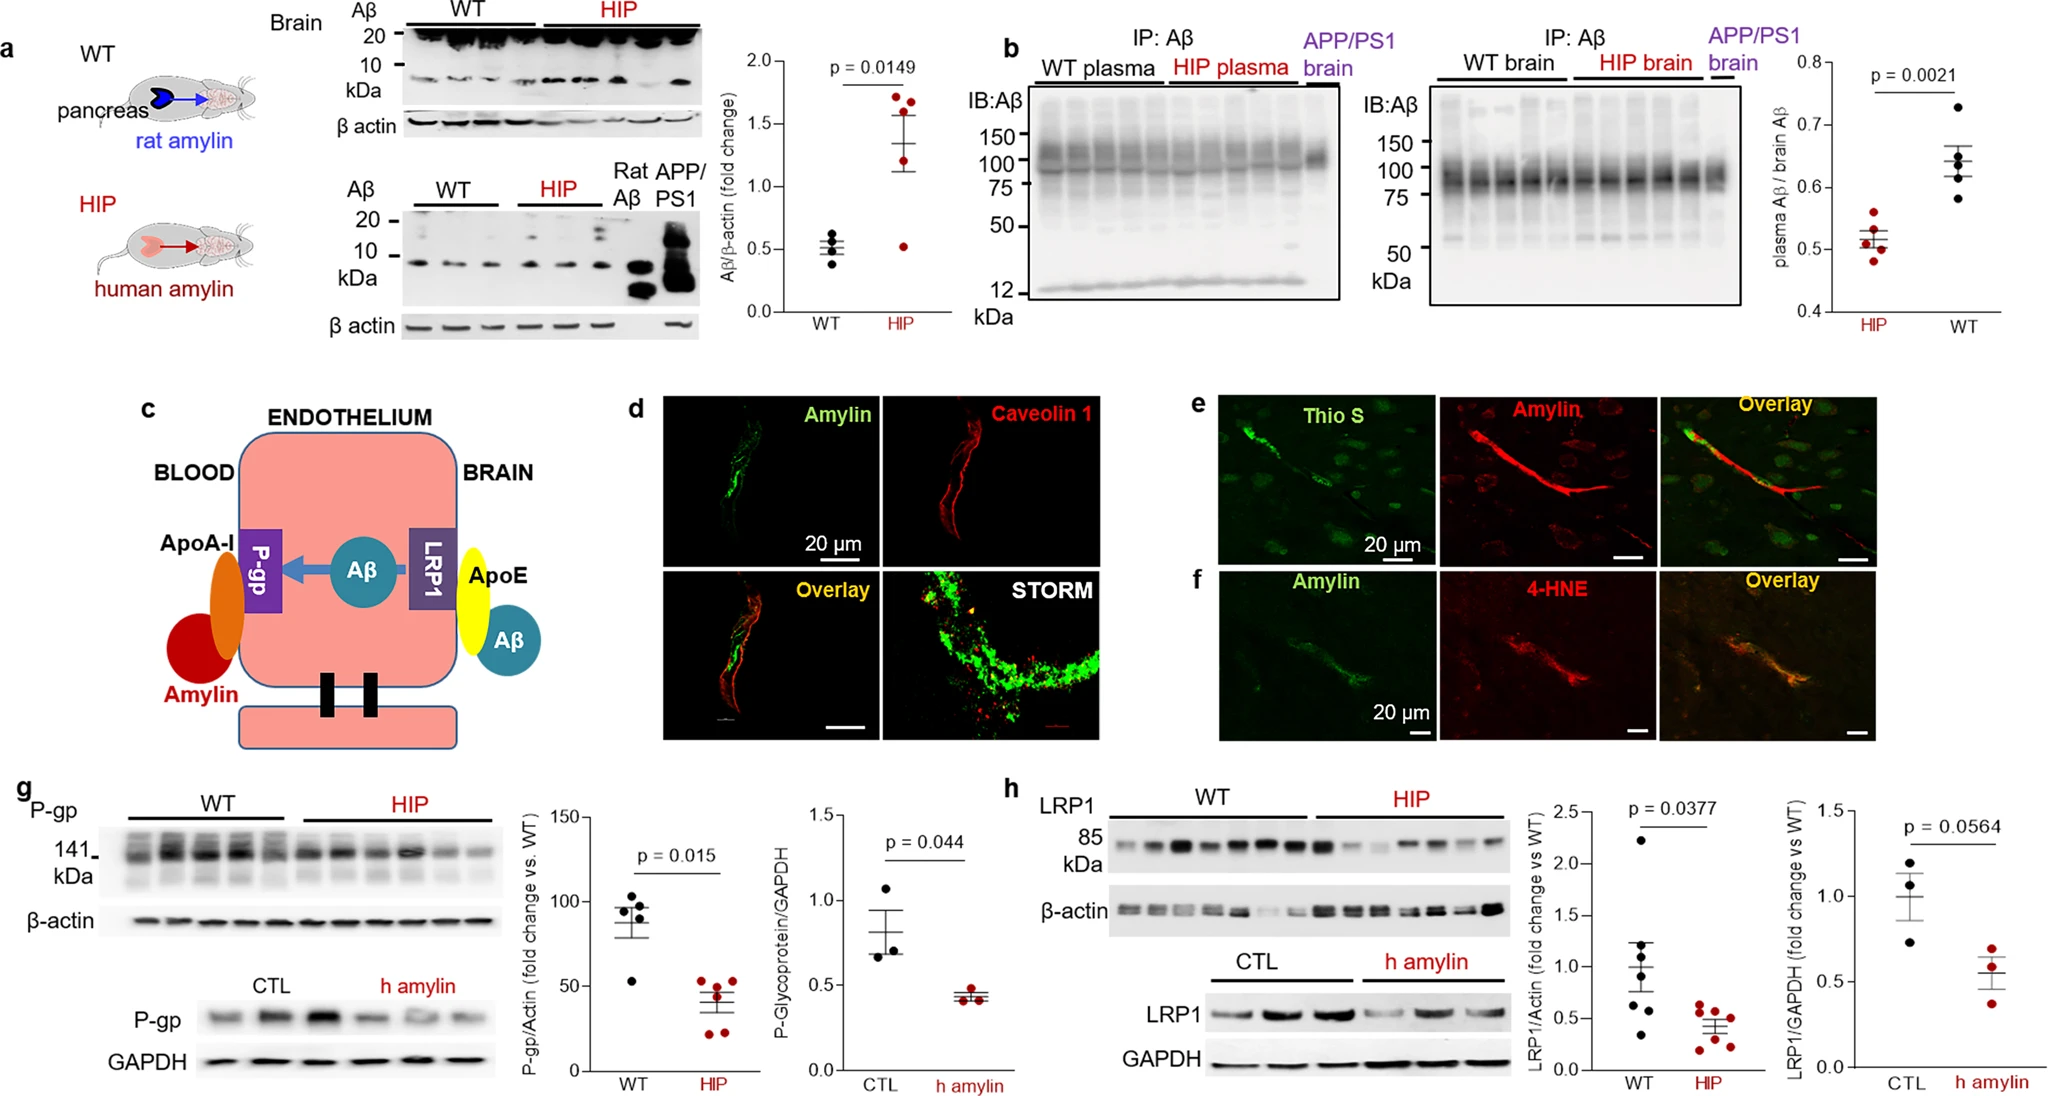
Western blot analyses of Aβ in brain tissue homogenates (Fig. 5a) and Western blot analysis of enriched Aβ by immunoprecipitation in plasma and brain homogenates (Fig. 5b) show brain Aβ deposition in HIP rats, even in the absence of genetically induced Aβ overexpression (i.e., as in APP/PS1 rats). The ratio of plasma-to-brain Aβ levels was lower in HIP compared to WT rats suggesting potential impairment Aβ transport from brain to blood. In these experiments, we used brain homogenates from a 12-month-old APP/PS1 rat as the positive controls for brain Aβ accumulation.
Impaired Aβ efflux from the brain induced by amyloid-forming human amylin secreted from the pancreas.
a Western blot analyses of brain tissue Aβ in WT and HIP rats (n = 4–5 males/group; age 15–16-months) with rat Aβ40 and APP/PS1 rat brain homogenate used as positive controls for Aβ immunoreactivity signal. b Estimated brain Aβ efflux through immunoprecipitation and Western blot analyses of Aβ in plasma and brain homogenates from WT and HIP rats (similar to those in a), with APP/PS1 rat brain homogenate used as positive control for Aβ immunoreactivity signal. c Proposed amylin action on the Aβ transport across the BBB. d Confocal microscopy and STORM analysis of amylin in brain microvessels isolated from HIP (n = 47 microvessels) and WT (n = 21 microvessels) rats (n = 3 males/group; age 15–16 months). Confocal microscopy analysis of serial sections from HIP rat brains stained with Thioflavin S (Thio S) or amylin (e) and with the lipid peroxidation marker 4-HNE or amylin (f) (n = 3 males similar to those in d). Western blot analysis of P-gp (g) and LRP1 (h) in brain microvessel lysates from HIP and WT rats (n = 5–7 males/group similar to those in a), and in brain microvascular ECs incubated with human amylin. Data are means ± SEM.
Aβ transport across the BBB is mediated by the low-density lipoprotein receptor-related protein 1 (LRP1), an apolipoprotein E (APOE) receptor37,38,39. At the BBB, LRP1 binds Aβ on the brain side of the endothelium facilitating Aβ release into the systemic circulation (Fig. 5c). P-glycoprotein 1 (P-gp; also known as ATP-binding cassette sub-family B member 1; ABCB1), an ATP-dependent efflux pump, mediates the release of Aβ at the blood side of the BBB40,41. ApoA-I stabilizes P-gp in endothelial cells (ECs)42,43 and binds to amylin in HIP rats, as we described in our previous study18. Here, we measured associations of cerebrovascular amylin deposition with EC stress-mediated alterations in LRP1 and P-gp protein expression in the HIP rat brain microvasculature. Confocal microscopy and analysis of amylin deposits using Stochastic Optical Reconstruction Microscopy (STORM) super-resolution imaging showed the juxtaposition of amylin and caveolin-1 optical intensity signals (Fig. 5d), confirming amylin deposition in HIP rat brain capillaries (see Fig. 3b). Amylin deposition in brain capillaries has biochemical properties of amyloid (Fig. 5e) and triggers accumulation of the lipid peroxidation marker 4-hydroxynonenal (4-HNE) (Fig. 5f) demonstrating amylin amyloid-induced oxidative stress within the BBB. This was associated with downregulated P-gp and LRP1 protein levels, as indicated by Western blot analysis of these proteins in brain capillary lysates from HIP and WT rats and in lysates of ECs incubated with amyloid-forming human amylin (Fig. 5g, h).
In vitro BBB model of Aβ transcytosis with amylin-mediated EC endothelial stress
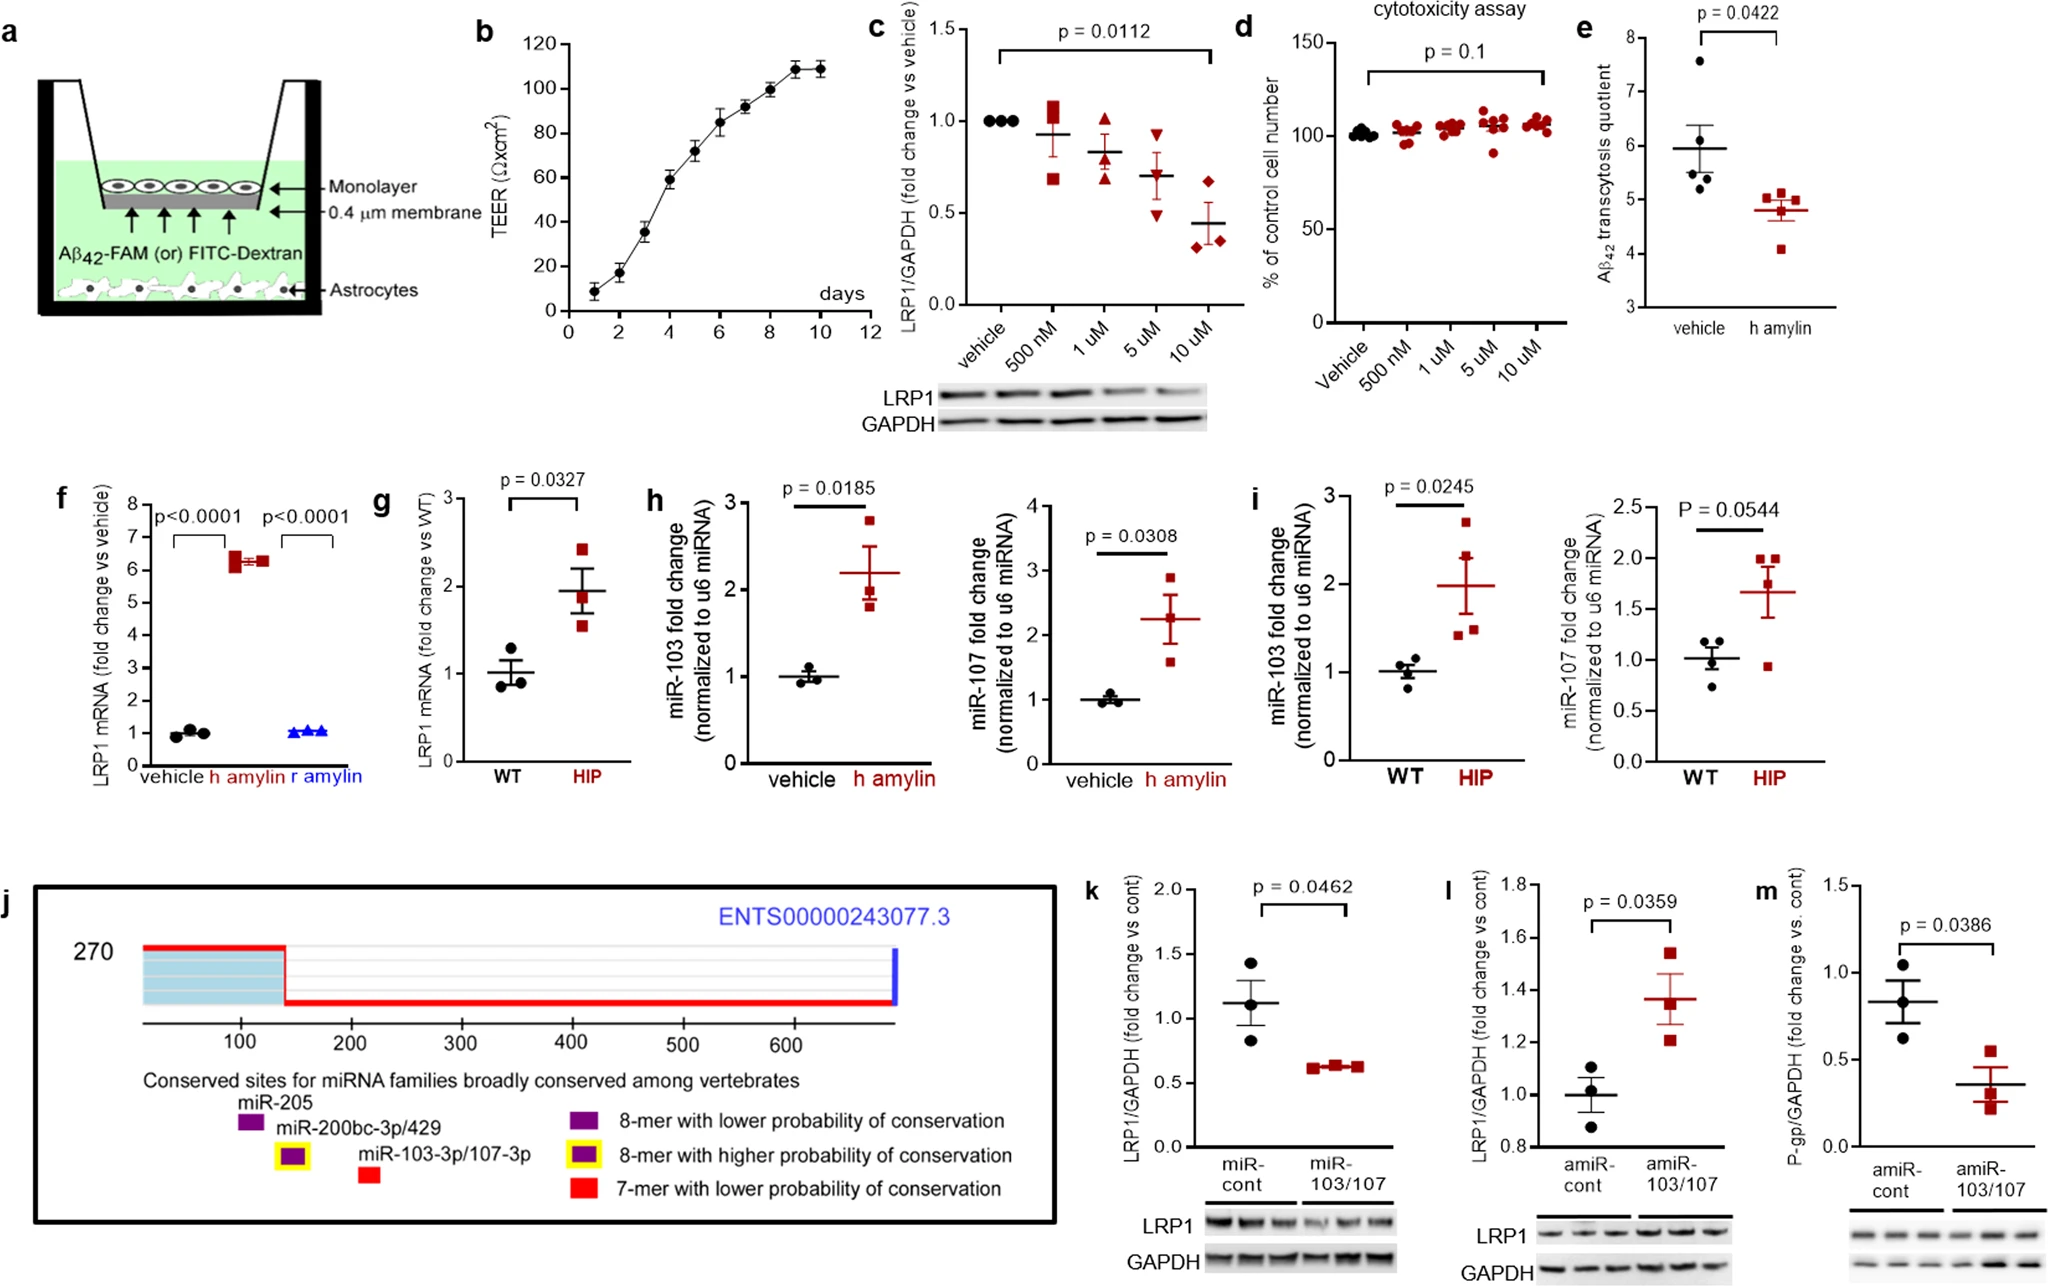
To determine whether amyloid-forming amylin may directly influence Aβ efflux as mediated by LRP1, we employed an in vitro model of BBB in which the EC monolayer was exposed to amyloid-forming human amylin on the luminal side and Aβ at the abluminal (brain side), as shown in Fig. 6a. The BBB model was tested for monolayer formation by measuring trans-endothelial electrical resistance (TEER) (Fig. 6b). All experiments were performed with a fully formed EC monolayer characterized by the maximum TEER = 110 ± 5 Ω/cm2. The dose response of brain microvascular ECs to incubation with various concentrations of human amylin for 24 h in shown in Fig. 6c. LRP1 protein levels decreased with increasing concentrations of human amylin; LRP1 expression was reduced by more than 50% in ECs incubated with 10 µM human amylin (Fig. 6c). EC viability was not affected by incubation with human amylin (Fig. 6d), indicating that decreased LRP1 protein expression is not due to cell death. Next, we applied human amylin peptide (10 μM) or vehicle at the luminal (blood) side for 24 h followed by washing the EC monolayers with PBS and application of FITC-Dextran or carboxyfluorescein labeled Aβ42 (Aβ42-FAM) at abluminal (brain) side of the BBB for 1-hour. The amounts of Aβ42-FAM and FITC-Dextran that crossed the monolayer were estimated from the fluorescence intensity in the medium samples collected from the luminal side and used to calculate the Aβ transcytosis quotient. Amylin-pretreatment reduced the Aβ transcytosis quotient by 20 ± 5% (P < 0.05) (Fig. 6e).
In vitro test of amylin-induced impairment of Aβ efflux across the BBB.
a Cartoon representation of the in vitro BBB model (ECs monolayer – luminal chamber; astrocytes – abluminal chamber) used in Aβ transcytosis experiments. b Transendothelial electrical resistance (TEER) in EC monolayers (n = 20 preparations) as a function of days in culture. c Representative Western blot and densitometry quantification of LRP1 in lysates from primary rat brain microvascular vascular ECs treated with vehicle or various concentrations of human amylin (500 nM, 1 µM, 5 µM, and 10 µM) for 24 h (n = 3 preparations/test). d Percent cell viability from the MTS assay in ECs treated with amyloid-forming human amylin (500 nM, 1 µM, 5 µM, and 10 µM) or vehicle, for 24 h. e The Aβ42 transcytosis quotient (TQ) across the in vitro BBB, in vehicle- and human amylin-treated EC monolayers. f LRP1 mRNA levels (fold difference using 2−ΔΔCt method) measured with qRT-PCR in lysates from ECs treated with vehicle, human amylin or rat amylin. g LRP1 mRNA levels measured by qRT-PCR in brain capillary lysates from same rats as in Fig. 5h. h, imiRNA (miR)-103 and miR-107 expression levels measured by qRT-PCR in lysates from ECs treated with vehicle or human amylin (same as in Fig. 5h), and in brain capillary lysates from same rats as in Fig. 5h. j TargetScan schematic showing consensus regions for miR-205, miR200bc-3p/429, and miR-103 and miR-107. Western blot analyses of LRP1 from miRNA (miR) 103 and miR-107 treated ECs compared to miR-control (n = 3 preparations/group) (k), as well as of LRP1 (l) and P-gp (m) from antagomir (amiR) 103 and amiR-107 treated ECs compared to amiR-control treated cells (n = 3 preparations/group). Data are mean ± SEM. one-way ANOVA with Dunnett’s post hoc (F). unpaired t test for the other panels.
In ECs incubated with 10 µM amyloid-forming human amylin for 24 h, the LRP1 mRNA levels were elevated compared to control ECs (vehicle treated) and ECs incubated with the same concentration of rat amylin (Fig. 6f). LRP1 mRNA levels were increased in HIP vs. WT brain capillary lysates (Fig. 6g). Taken together, the results indicate that amyloid-forming amylin may directly influence Aβ efflux through suppressing transport protein expression at a post-transcriptional level.
Antisense microRNAs 103/17 rescue amylin-induced LRP1 suppression
Published data show that paralog miRNAs miR-103 and miR-107 are upregulated by oxidative stress44 and repress LRP1 translation in several cell lines45. We, therefore, hypothesized that miR-103 and miR-107 are involved in amylin-induced LRP1 downregulation in the microvascular ECs. ECs incubated with 10 µM amyloid-forming human amylin for 24 h showed increased miR-103 and miR-107 levels, as indicated by the RT-PCR data from EC lysates (Fig. 6h). Using the same HIP and WT rat capillary lysates as in above (Fig. 6g), we detected higher miR-103 and miR-107 levels in HIP vs. WT rat capillaries (Fig. 6i), consistent with the in vitro results (Fig. 6h). TargetScan predicts that miR-103 and miR-107 bind directly to LRP1(Fig. 6j). Therefore, we co-transfected miR-103 and miR-107 mimics into microvascular ECs, and then used antagomir (amiR)-103 and amiR-107 to silence amylin-induced upregulation of miR-103 and miR-107. Our results show miR-103/107 downregulate LRP1 (Fig. 6k), replicating the effect of the incubation with amyloid forming human amylin (Fig. 5h). AmiR-103/107rescue LRP1 expression in ECs following amylin-induced cell stress (co-incubation with 10 μM human amylin) (Fig. 6l); however, amiR-103/107 does not rescue P-gp expression (Fig. 6m).
Taken together, our results (Figs. 2–6) suggest a potential link between chronically dysregulated pancreatic amylin and impaired rat Aβ efflux from the brain into the systemic circulation through mechanisms that involve: 1, amylin vasculopathy leading to reduced cerebral vasodilation and altered interstitial fluid drainage along the walls of cerebral blood vessels; and 2, amylin-induced endothelial dysfunction leading to P-gp and LRP1 downregulation at the BBB. In HIP rats, causes other than decreased transport, such as altered degradation rates of Aβ, increased aggregation causing immunological hiding of Aβ, enhanced influx of Aβ, or increased blood levels of Aβ could explain the decrease of plasma-to-brain ratio for Aβ.
Immune, metabolism, and hypoxia-related brain gene expression altered by increased concentrations of amyloid-forming human amylin in the blood
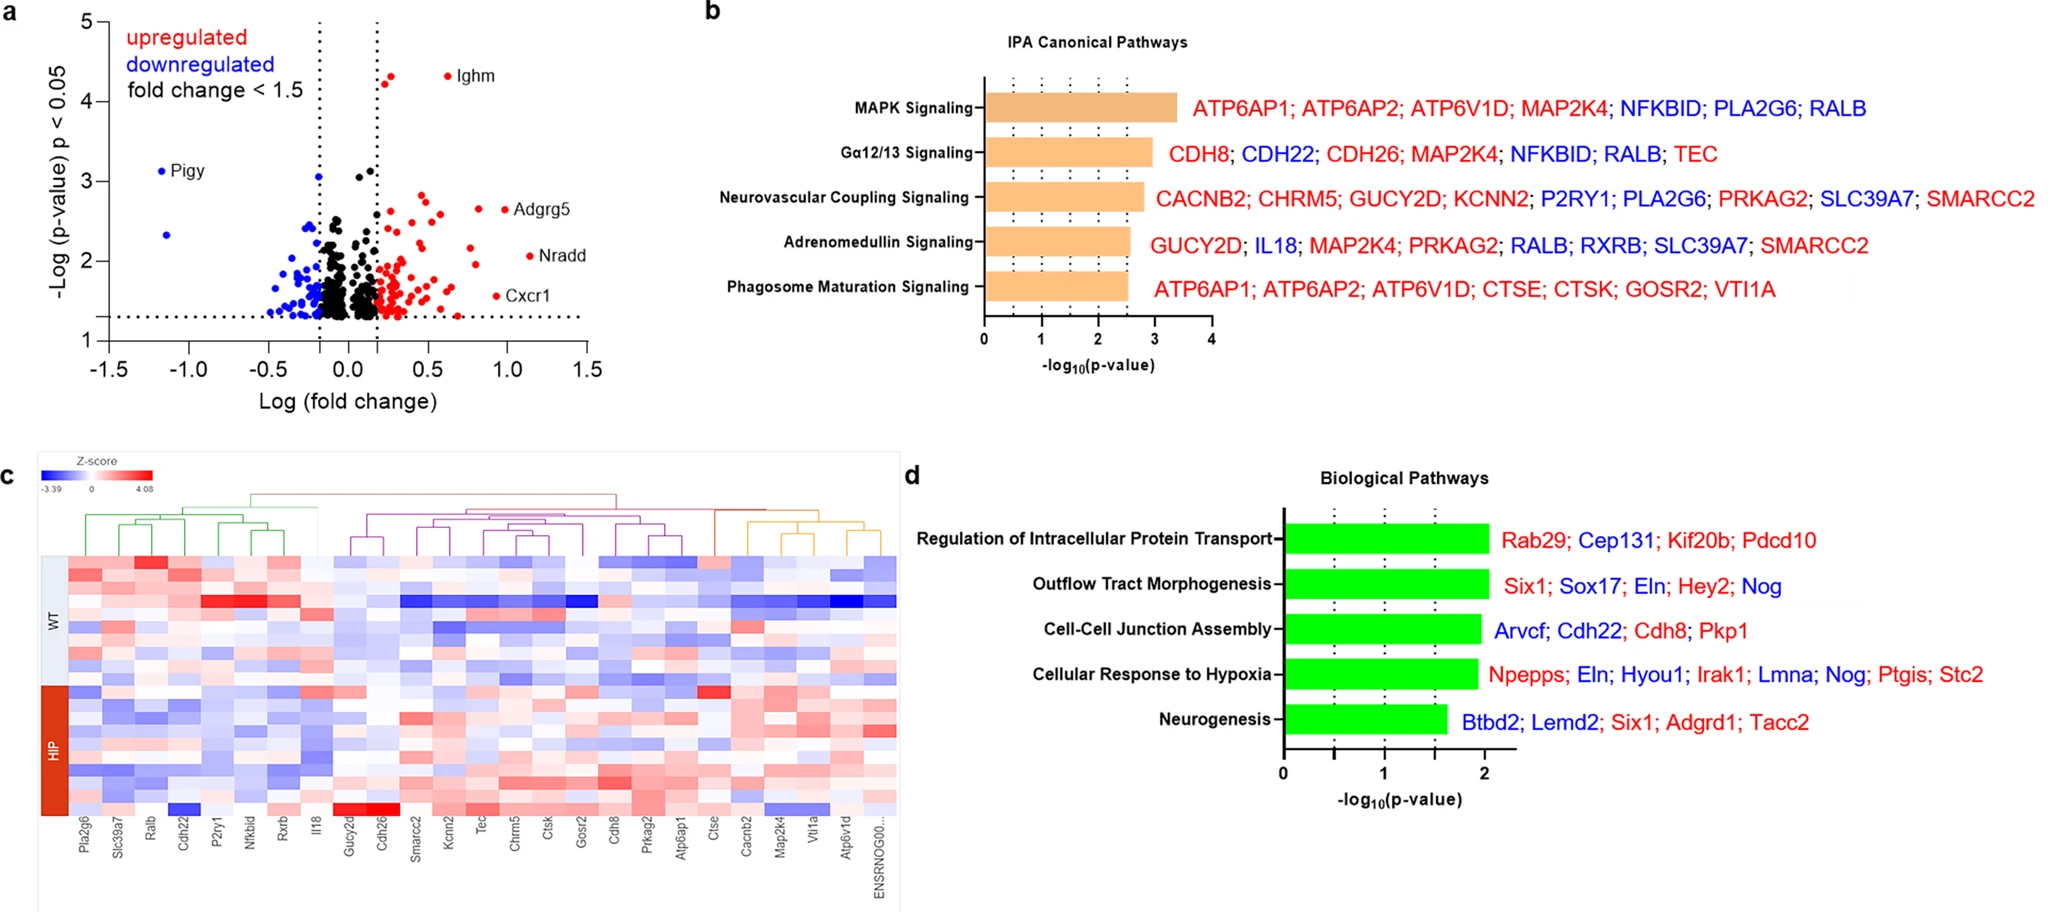
Previous studies using a TaqMan Gene Expression assay found that both pro-inflammatory and anti-inflammatory microglia genes were differentially expressed (DE) in HIP vs. WT rat groups25. To predict possible ample molecular patterns in brain genes associated with chronic exposure to pancreatic amyloid-forming human amylin in the blood, we used RNA-seq and gene expression network analyses of hippocampal genes in HIP vs. WT male rats (age, 15–16-months). Comparison of RNAseq data from HIP vs. WT rats (n = 10 males/group) enabled the identification of 408 gene transcripts that were differentially expressed (P < 0.05). The range of characteristic magnitude of change of upregulated and downregulated DE genes is shown in Fig. 7a. DE genes were annotated in the Ingenuity Pathway Analysis (IPA) database, which identified enrichment of multiple canonical pathways represented by these genes (Fig. 7b). Among DE genes in HIP rats compared to WT rats, 25 genes identified the enrichment of the top 5 canonical pathways as shown by the hierarchical clustering heatmap of these DE genes (Fig. 7c). We further categorized the 408 DE genes based on gene ontology (GO) by using the Database for Annotation, Visualization and Integrated Discovery (DAVID) into biological processes enriched in HIP compared to WT rats (Fig. 7d). These results (Fig. 7b–d) suggest dysregulation of genes involved in cellular responses to inflammation, altered metabolism and hypoxia may be associated with chronically increased blood amylin concentrations, cerebrovascular amylin deposition, and impairment of brain Aβ clearance.
The genes predicted to influence the impact of cerebrovascular amylin deposition on the central nervous system.
a The Log10 (p-value) versus Log10 (fold change) of the DE genes in HIP vs. WT rat brains. Each dot represents one gene, with upregulated in red color (HIP vs. WT, ≥ 1.5-fold change), downregulated in blue color (HIP vs. WT, ≥ 1.5-fold change), and < 1.5-fold change in black color. b Top 5 canonical pathways identified by Ingenuity Pathways Analysis of differentially expressed (DE) genes detected by RNA-seq analysis of hippocampal tissue from the HIP vs. WT rat groups (P < 0.05) (n = 10 males/group). c Hierarchical clustering of 25 DE genes identified the enrichment of top 5 canonical pathways in (b). d Top 5 Gene Ontology (GO) biological processes enriched in HIP rat group compared to WT rat group.
Discussion
Our data from humans and laboratory animal models show that a potentially critical mechanism enabling cerebral Aβ pathology to develop involves cerebrovascular accumulation of amyloid-forming amylin secreted from the pancreas. Because pancreatic amylin contributes to the development of type-2 DM, our results suggest amylin-Aβ interaction as a potential missing molecular link between type-2 DM and AD, and a promising new approach to therapy. We found three interdependent factors that appear to underlie amylin-induced impairment of brain Aβ clearance: 1, concentrations of blood amylin are increased in dementia vs. cognitively unimpaired individuals; 2, chronically increased concentrations of amyloid-forming amylin in the blood promote amylin accumulation in circulating monocytes reflecting systemic inflammation and leading to cerebrovascular amylin deposition; and 3, cerebrovascular amylin deposition perturbs LRP1-Pgp-mediated Aβ transport across the BBB and Aβ clearance through interstitial fluid drainage along vascular walls, as indicated by amylin-Aβ co-localization in blood vessel walls and perivascular spaces.
Compensatory insulin secretion is central to insulin resistance and coincides with increased amylin secretion8,9,10 (also demonstrated by our current data in participants in a cohort spanning the cognitive continuum from cognitively unimpaired to mild cognitive impairment and dementia; Fig. 1d). Given that patients with type-2 DM are insulin resistant for many years before their clinical diagnosis, they are exposed to chronic hyperamylinemia that is linked to pancreatic amylin amyloid deposition8,9,10, NLRP3 inflammasome activation and increased secretion of pro-inflammatory IL-1β from macrophages and dendritic cells11,12,13. Our data showing amylin engulfed by circulating monocytes in association with increased plasma IL-1β concentrations indicate possible innate immune responses to increased concentrations of pancreatic amyloid-forming amylin in the blood. These data suggest that cerebrovascular amylin deposition leading to perivascular inflammation may develop, at least in part, due to an inadequate innate immune reaction to prediabetes-related rising concentrations of pancreatic amyloid-forming in the blood. Future studies should determine whether modulation of the amylin-IL-1β pathway might provide an approach for counteracting neuroinflammation in the setting of AD.
Perivascular Aβ deposits are common in AD brains and have been attributed to impaired interstitial fluid drainage2,3,4. The motive force of interstitial fluid drainage arises from the spontaneous contraction and relaxation of vascular smooth muscle cells2,3,4. Our results show associations between amylin-mediated systemic inflammation and reduced cerebral vasodilation and CBF through arginase-NO dysregulation within the vessel wall. Our data also show that pancreatic amyloid-forming amylin accumulates in brain capillaries and may affect expression of P-gp and LRP1, proteins that mediate Aβ transport across the BBB. Although APOE/LRP1-regulated pathways have a well-established role in brain Aβ clearance46 the possibility that LRP1 expression can be downregulated by amylin from the luminal side of the blood vessel may represent a novel therapeutic target to reduce AD pathology.
In conclusion, our data suggest that screening for pancreatic amylin dysregulation by measuring amylin accumulation in blood and circulating monocytes could identify people at increased risk for brain microvascular and AD pathologies. This is also important because impaired executive function and working memory are common in persons with type-2 diabetes without dementia1, and amylin dysregulation is associated with type-2 diabetes and may be a possible contributing factor to these clinical effects. Type-2 DM and AD, two growing global health threats, appear linked through complex mechanisms14,47,48,49,50possibly involving amyloid-forming amylin as a molecular factor beyond glucose and insulin dysregulation. Amylin-mediated cerebrovascular inflammation, impairment of brain Aβ clearance and dysregulated gene expression in the brain appear as biological characteristics of pancreatic hypersecretion of amylin (prediabetes). The present data may improve understanding of the mechanisms of cerebrovascular inflammation and the risk of impaired Aβ elimination from the brain in the setting of prediabetic insulin resistance, when blood amylin concentration is chronically elevated. Inhibiting systemic and cerebrovascular inflammation caused by pancreatic amyloid-forming amylin could reduce cerebrovascular arginase-NO dysregulation, vasoconstriction, blood flow reductions, and brain Aβ accumulation.