
Universal protein misfolding intermediates can bypass the proteostasis network and remain soluble and less functional
By Daniel A. Nissley, Yang Jiang, Fabio Trovato, Ian Sitarik, Karthik B. Narayan, Philip To, Yingzi Xia, Stephen D. Fried, and Edward P. O’Brien
Excerpt from the article published in Nature Communication 13, 3081 (2022). Published: DOI: https://doi.org/10.1038/s41467-022-30548-5
Editor’s Highlights
- Protein homeostasis (“proteostasis”) refers to the maintenance of proteins at their correct concentrations and in their correct conformational states through the action of a cohort of chaperones, degradation machineries, and protein quality control pathways.
- Soluble, long-lived, non-functional protein misfolded states can arise from alteration of translation-elongation kinetics.
- These misfolded conformations are able to remain soluble because they are, overall, very similar to the native state, but with certain entanglements that lead to perturbed structure and function.
- Entangled states may be the source of reduced dimerization, enzymatic function, and small-molecular transport upon changes in translation kinetics induced by synonymous mutations.
Abstract
Some misfolded protein conformations can bypass proteostasis machinery and remain soluble in vivo. This is an unexpected observation, as cellular quality control mechanisms should remove misfolded proteins. Three questions, then, are: how do long-lived, soluble, misfolded proteins bypass proteostasis? How widespread are such misfolded states? And how long do they persist? We address these questions using coarse-grain molecular dynamics simulations of the synthesis, termination, and post-translational dynamics of a representative set of cytosolic E. coli proteins. We predict that half of proteins exhibit misfolded subpopulations that bypass molecular chaperones, avoid aggregation, and will not be rapidly degraded, with some misfolded states persisting for months or longer. The surface properties of these misfolded states are native-like, suggesting they will remain soluble, while self-entanglements make them long-lived kinetic traps. In terms of function, we predict that one-third of proteins can misfold into soluble less-functional states. For the heavily entangled protein glycerol-3-phosphate dehydrogenase, limited-proteolysis mass spectrometry experiments interrogating misfolded conformations of the protein are consistent with the structural changes predicted by our simulations. These results therefore provide an explanation for how proteins can misfold into soluble conformations with reduced functionality that can bypass proteostasis, and indicate, unexpectedly, this may be a wide-spread phenomenon.
Introduction
How soluble, misfolded protein populations with reduced functionality1,2,3 bypass cellular quality control mechanisms4 for long time periods is poorly understood. Further, how common this phenomenon is across proteomes has not been assessed. These are important gaps in our knowledge to fill as the answers will offer a more complete picture of protein structure5 and function in cells, may lead to refinement of the protein homeostasis model6 of proteome maintenance, are likely to be relevant to how synonymous mutations have long-term impacts on protein structure and function7, and could reveal long-term misfolding on a scale greater than previously thought.
Protein homeostasis (“proteostasis”) refers to the maintenance of proteins at their correct concentrations and in their correct conformational states through the action of a cohort of chaperones, degradation machineries, and protein quality control pathways6,8. It is typically posited that under normal (i.e., not stressed) cellular growth conditions globular proteins in vivo attain one of three states: folded/functional, misfolded/aggregated, or degraded. Various molecules work together to maintain proteostasis by catalyzing the interconversion of proteins between these states9,10,11. For example, some chaperones in E. coli, such as GroEL/GroES9 and DnaK10, can promote the folding of misfolded or unfolded proteins. Others, such as the set of enzymes associated with the ubiquitin-proteasome system in eukaryotes, covalently tag misfolded proteins for degradation12. Yet others, such as E. coli’s ClpXP, have the potential to break apart aggregates, allowing released monomeric proteins to be degraded13. Many caveats and nuances exist in the proteostasis model. For example, some insoluble protein aggregates, such as carboxysomes, are biologically beneficial by spatially concentrating protein function14. Some non-native protein oligomers are soluble15, and recently discovered biomolecular condensates16 represent a form of aggregation in which proteins within a condensate remain liquid-like but preferentially interact with each other over other cellular components. In addition, soluble proteins are not always functional because some require co- or post-translational modifications17,18.
The timescales involved with many proteostasis processes are often quite short. Co-translationally acting chaperones bind ribosome nascent chain complexes on timescales of tens of ms19, the ubiquitin-degradation machinery tags up to 30% of eukaryotic nascent chains for immediate degradation after synthesis20,21, and post-translationally acting chaperones can generally refold misfolded proteins in seconds or minutes22. Indeed, the FoldEco kinetic model of E. coli proteostasis indicates that conversions between various states within the network occur with rate constants typically on the order of seconds23. Thus, according to the proteostasis model, misfolded proteins should either be converted in a matter of seconds or minutes into their folded state, be degraded, or form aggregates provided cells are not stressed and the proteostasis machinery is not overwhelmed24.
Synonymous mutations change the triplet of nucleotides among degenerate mRNA codons encoding the same amino acid, leading to an altered mRNA sequence that encodes the same protein primary structure. Such mutations can alter the translation-elongation rate of ribosomes and have been found to alter the structure and function of proteins over long timescales7. For example, translation of a synonymous variant of the frq gene in the fungus Neurospora resulted in the synthesis of FRQ protein with altered conformations that bound 50% less to a partner protein, resulting in a significantly altered circadian rhythm that persisted for multiple days2. Many other proteins have been reported to exhibit altered structure or function upon the introduction of synonymous mutations25,26,27. The fact that these functional changes occur in the soluble fraction of the proteome indicates it is not insoluble aggregation driving this phenomenon. And importantly, such observations are inconsistent with aspects of the proteostasis model, which predicts that any protein with a misfolded (and less functional) structure should either refold, aggregate, or be degraded on faster timescales.
One hypothesis that could resolve this discrepancy is that proteins can populate an additional state. In this state, proteins are kinetically trapped over long timescales in misfolded conformations with reduced functionality, but they do not have a propensity to aggregate or interact with proteostasis machinery in excess of that of folded proteins. If correct, this hypothesis raises a number of questions, including: (i) what type of structures are adopted in this state? (ii) how do those conformations simultaneously avoid folding, aggregation, and degradation in excess of that observed for the native ensemble? (iii) how long do they persist? And (iv) what fraction of the proteome exhibits this behavior?
Answering these questions requires a computational method that can access the second to minute timescale of protein synthesis and maturation while providing sufficient structural resolution to identify misfolded conformations and their properties. We use a topology-based coarse-grain model that represents proteins with one interaction site per residue placed at the coordinates of the Cα atom. This model folds proteins 4-million times faster, on average, than in real systems28, and was previously used to accurately reproduce the co-translational folding time course of HemK N-terminal domain29. Coarse-grain simulations of a zinc-finger protein folding in the ribosome exit tunnel were also found to agree with experimental cryo-EM structures30, indicating this method can reproduce realistic scenarios of folding on the ribosome. In addition, excellent agreement has been found between such topology-based models and experimental assays monitoring force generation due to the folding of titin I27 domain on and off the ribosome31. These examples highlight the utility of such coarse-grain models to protein misfolding on and off the ribosome.
Here, we apply such coarse-grain methods to simulate protein synthesis, co-translational and post-translational folding, and estimate the fraction of molecules that fold, misfold, interact with chaperones, aggregate, are degraded, or attain a functional conformation. After first confirming that our model can reproduce post-translational misfolding in Luciferase, we simulate a representative subset of the cytosolic E. coli proteome, finding that a substantial proportion of newly synthesized proteins can adopt misfolded conformations that are near-native in structure and thus likely to interact with co- and post-translational chaperones in a manner similar to that of their native states. These misfolded conformations expose a similar amount of aggregation-prone surface area as the native ensemble, and therefore do not have an increased propensity to aggregate. For some proteins, misfolding is localized near their functional sites, indicating their functionality is reduced. We estimate that many of these near-native misfolded states are kinetically trapped, exhibiting lifetimes on the order of days to months. Our simulations predict that there is a universal structural feature associated with these soluble misfolded states proteome-wide.
Results
A coarse-grain model reproduces experimentally observed misfolding of Firefly Luciferase
The model we use for protein synthesis, folding, and function has been shown to accurately predict experimentally measured changes in enzyme specific activities32, indicating it reasonably describes protein structure-function relationships. As an additional test, here we examine if the model is able to identify if a protein will exhibit misfolded subpopulations. Firefly Luciferase, a 550-residue protein with four domains, folds co-translationally33. Specific activity experiments25 have found that some soluble, nascent Luciferase molecules misfold when translation speed is increased. Even when synthesized from its wild-type mRNA in E. colisome Luciferase molecules still fail to fold correctly25. We therefore selected Luciferase as a test system, judging that if it partitions into long-lived misfolded states in our simulations when translated from its wild-type mRNA that our model is able to capture realistic scenarios of misfolding.
We simulated Luciferase’s synthesis, ejection from the ribosome exit tunnel, and post-translational dynamics using a coarse-grain representation of the protein and ribosome (Fig. 1a–c, Supplementary Table 1, “Methods”, and Eqs. (1) and (2)). Fifty statistically independent trajectories were run. To characterize Luciferase’s native conformational ensemble we also simulated ten trajectories initiated from Luciferase’s crystal structure, which we refer to as “native-state simulations”. To assess whether or not a given Luciferase trajectory is misfolded we utilize the time-dependent mode of the fraction of native contacts (𝑄modeQmode) and the probability that a non-native entanglement (𝑃(𝐺𝑘)P(Gk)) has formed. We categorize a trajectory as misfolded if it has (i) a mean 𝑄modeQmode, over the final 100 ns of the post-translational phase of the simulation, that is less than the average from the native-state simulations, or (ii) a mean 𝑃(𝐺𝑘)P(Gk) for the different possible changes in non-covalent lasso threading denoted 𝑘={0,1,2,3,4}k={0,1,2,3,4} of 0.1 or greater over the final 100 ns of the trajectory, or (iii) both (i) and (ii) occur (see “Methods”). Conditions (i) and (ii) correspond to perturbations of structure relative to the native state as defined by the fraction of native contacts and entanglement, respectively. Based on this definition, 46% (95% Confidence Interval [32%, 60%], calculated from bootstrapping 106 times) of nascent Luciferase molecules misfold (Fig. 1d, e, “Methods”). We observe that when Luciferase misfolds, it misfolds 100% of the time in the second domain (based on ⟨𝑄mode⟩⟨Qmode⟩), which is composed of residues 13–52 and 212–355. These misfolded Luciferase structures are near-native, with a 5.5% decrease in the overall fraction of native contacts (⟨𝑄overall⟩=0.86⟨Qoverall⟩=0.86, computed over the final 100 ns of misfolded trajectories) compared to the native ensemble (⟨𝑄overall⟩=0.91⟨Qoverall⟩=0.91). Thus, a large proportion of nascent Luciferase misfolds into near-native conformations that typically involve misfolding of the second domain.
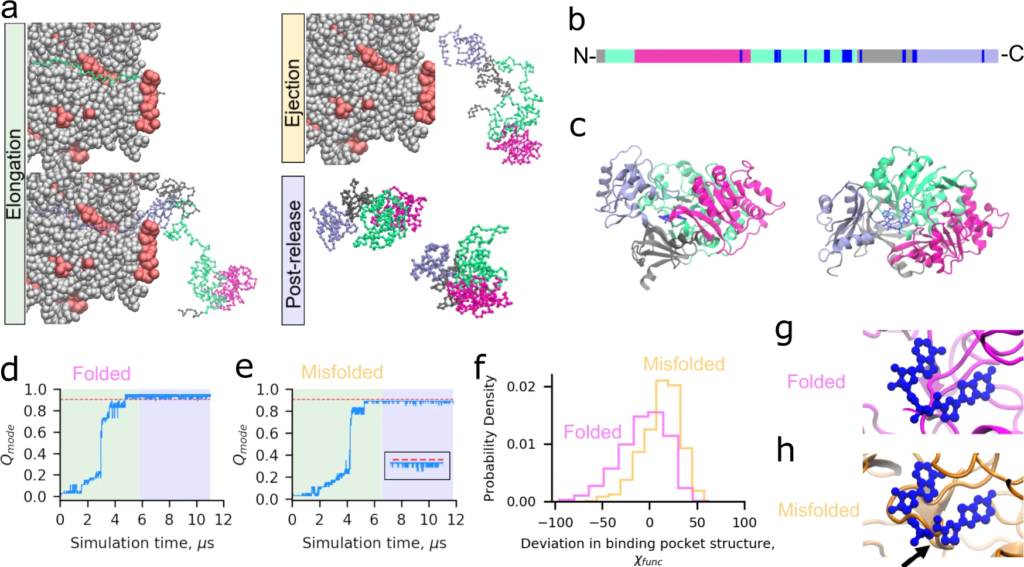
Luciferase exhibits subpopulations that misfold into soluble but less-functional conformations.
a Simulations of translation elongation and ejection of nascent Luciferase were performed with a coarse-grain ribosome representation (ribosomal proteins and RNA are displayed in red and gray, resp ectively). Domains 1, 2, 3, and 4 of Luciferase are displayed in silver, light green, magenta, and light purple, respectively. After ejection, the ribosome is removed and post-release dynamics simulated for 30 CPU days. b Primary structure diagram of Luciferase colored as described in (a); positions involved in the catalytic function of Luciferase as described in “Methods” are colored blue. c Cartoon diagram of Luciferase native state colored as described in (a) with the 5′-O-[N-(dehydroluciferyl)-sulfamoyl]-adenosine ligand colored dark blue. d 𝑄modee(see “Methods”) versus time for Domain 2 of a trajectory of Luciferase that folded correctly. Plot sections colored green, yellow, and blue correspond to synthesis, ejection, and post-translation simulation phases. Note that the short duration of ejection for this protein renders it invisible at this resolution. The red line corresponds to ⟨𝑄NSmode⟩ minus three standard deviations and represents the threshold for defining this domain as folded (see “Methods”). eSame as (d) but for a trajectory that misfolds. Inset shows the final microsecond of the 𝑄mode time series. f Distributions of 𝜒func (Eq. (13)) over the final 100 ns of the folded (magenta) and misfolded (orange) trajectories displayed in panels (d) and (e). The misfolded and folded distributions are different based on the Kolmogorov–Smirnov test with test statistic 0.33 and 𝑝
p-value of 1 × 10−66. The misfolded distribution shows greater structural distortion (i.e., values of 𝜒func > 0) of the binding pocket. g Back-mapped all-atom structure from the final frame of the folded simulation shown in (d) aligned based on the residues implicated in function to the native state. h Same as (g) except for the final structure from the misfolded trajectory in (e), showing a strand misfolding in the ligand-binding pocket (indicated by black arrow). Steric conflict between where the substrate binds and the surrounding binding pocket of the misfolded structures indicates this misfolded state will have reduced function.
The motivating experiments on Luciferase were carried out in the presence of the endogenous E. coli proteostasis machinery25. To predict whether the Luciferase misfolded states produced by our model are likely to display reduced specific activity in vivo we therefore need to determine four things. They must (i) evade chaperones to remain misfolded, (ii) not aggregate, (iii) not get degraded, and (iv) the residues involved in function must be structurally perturbed. The chaperone trigger factor (TF) binds nascent proteins co-translationally, DnaK interacts both co- and post-translationally, while GroEL/GroES is primarily a post-translational chaperone. Interactions with TF34 or GroEL/GroES9 are thought to occur by the non-specific recognition of exposed hydrophobic patches on client proteins co- and post-translationally, respectively. DnaK, however, is hypothesized to interact with specific binding sites within a protein’s sequence35.
To estimate whether misfolded Luciferase is likely to interact with TF we computed the average relative difference between the hydrophobic solvent accessible surface area (SASA) of each misfolded trajectory to the folded population (denoted ⟨𝜁co−thydrophobic⟩⟨ζhydrophobicco−t⟩, Eq. (9), and “Methods”) during synthesis. The value of ⟨𝜁co−thydrophobic⟩⟨ζhydrophobicco−t⟩ is ≤10% for 16 of 23 misfolded trajectories, meaning that they display less than a 10% increase in hydrophobic SASA during synthesis relative to the folded population of trajectories. This indicates that a majority of misfolded Luciferase molecules will not interact with TF much more than a properly folded Luciferase molecule (see “Methods”). Though TF accelerates protein folding under force36, under normal conditions it is also thought to act as a holdase34. Thus, we conclude that our co-translational Luciferase misfolded states can misfold into conformations that do not interact with TF in a manner that accelerates folding, allowing these misfolded states to persist post-translationally.
Next, to determine whether misfolded conformations of Luciferase are likely to interact with GroEL/GroES post-translationally, we computed the average relative difference between the hydrophobic SASA of each misfolded conformation in the final 100 ns and its value in the native-state simulations (⟨𝜁hydrophobic⟩⟨ζhydrophobic⟩, Eq. (10), “Methods”). The value of ⟨𝜁hydrophobic⟩⟨ζhydrophobic⟩ for Luciferase is ≤10% for 9 of 23 misfolded trajectories, indicating that these misfolded states expose only a small excess of hydrophobic SASA relative to the native ensemble, and are therefore not likely to be engaged by GroEL/GroES.
Finally, to estimate whether misfolded Luciferase structures are more likely to interact with DnaK than the native state, we computed ⟨𝜁DnaK⟩⟨ζDnaK⟩ (Eq. (11)), the average relative difference in SASA of residues predicted to be DnaK binding sites by the Limbo algorithm35 in the final 100 ns for all misfolded trajectories. We find that 22 out of 23 misfolded trajectories have ⟨𝜁DnaK⟩≤10%⟨ζDnaK⟩≤10%, indicating that DnaK is unlikely to preferentially bind to these misfolded states any more than it is to the native state. Thus, some of Luciferase’s misfolded states are unlikely to interact with TF, GroEL/GroES, or DnaK, and thus bypass the E. coli chaperone network (Supplementary Fig. 1a).
The next key question is whether or not these misfolded Luciferase structures, having bypassed chaperone quality controls, are likely to remain soluble or to aggregate or be degraded. In the original experiments by Barral and co-workers, centrifugation was used to remove aggregates from the soluble fraction. To estimate whether the misfolded Luciferase structures from our simulations will aggregate we used the AMYLPRED237 webserver to identify residues in the Luciferase amino acid sequence that lead to aggregation when exposed to solvent. We then computed ⟨𝜁agg⟩⟨ζagg⟩ (Eq. (12)), the average relative difference in SASA between these aggregation-prone residues in the final 100 ns of each misfolded trajectory in comparison to the same residues in the native-state simulations. We find that 12 of 23 misfolded trajectories have ⟨𝜁agg⟩≤10%⟨ζagg⟩≤10%, indicating that these misfolded conformations display only a minor increase in aggregation propensity and are likely to remain soluble.
Finally, we considered the likelihood that misfolded Luciferase will be targeted for degradation. Degradation in E. coli is carried out primarily by proteases coupled to AAA+ ATPase motor proteins38, including ClpXP and Lon, that recognize and degrade misfolded or aggregated proteins. Misfolded protein structure contributes to degradation39, and therefore, like our GroEL/ES assessments, we use ⟨𝜁hydrophobic⟩⟨ζhydrophobic⟩ to quantify how similar misfolded Luciferase conformations are to the native state. For 9 of 23 misfolded Luciferase trajectories ⟨𝜁hydrophobic⟩⟨ζhydrophobic⟩ is ≤10%≤10%, indicating they are unlikely to be degraded more quickly than native Luciferase.
Having determined that some misfolded conformations of Luciferase can evade chaperones, aggregation, and degradation, the final question is whether their function is decreased relative to native Luciferase. To answer this question, we identified the residues that take part in Luciferase’s bioluminescence, defined as those resides within 4.5 Å of the 5′-O-[N-(dehydroluciferyl)-sulfamoyl]-adenosine ligand in PDB structure 4G36, in addition to all residues identified in the UniProt database40 to have a role in its catalytic mechanism. To quantify the difference in structure of residues involved in Luciferase’s catalytic mechanism, we compute the average relative difference between the structures sampled in the final 100 ns of each misfolded trajectory and native Luciferase in terms of the structural overlap function (⟨𝜒func⟩⟨χfunc⟩) over residues implicated in its function (see Eqs. 13–15 and Fig. 1b, c, f, g, and h). Positive values of 𝜒funcχfunc indicate perturbed structure relative to the native state simulations. We find that 15 of 23 misfolded Luciferase trajectories have ⟨𝜒func⟩⟨χfunc⟩ ≥ 10%, indicating that they have significantly perturbed structure at functionally important sites relative to the native state (Fig. 1f). For example, Fig. 1g, h shows the binding pocket at the final frames of folded and misfolded, soluble, but non-functional Luciferase trajectories. The binding pocket structure is perturbed such that it impinges on the substrate location. Since structure equals function, this result indicates that the efficiency of the enzymatic reaction carried out by misfolded Luciferase will be less efficient than in its native fold.
Cross-referencing the lists of misfolded trajectories that are likely to avoid chaperones, aggregation, degradation, and exhibit reduced function, we find that one trajectory displays all of these characteristics and likely remains soluble but less functional than native Luciferase (Supplementary Fig. 1b). Our simulation results are thus qualitatively consistent with the experimental observation that some nascent Luciferase molecules misfold when translated from its wild-type mRNA. While a misfolded state that is only populated by 2% of protein molecules is unlikely to strongly influence the cell, perturbations to Luciferase translation-elongation kinetics by synonymous mutations might increase this population beyond 2%. In general, these results indicate that our coarse-grain simulation protocol for nascent protein synthesis, ejection, and post-translational dynamics is able to recapitulate nascent protein misfolding.
Simulating a representative subset of the E. coli cytosolic proteome
It is not computationally feasible to simulate all 2600 cytosolic E. coli proteins. Therefore, to investigate the extent of nascent protein misfolding within the E. coli proteome we constructed models for a representative subset of 122 proteins. This set of proteins has the same distributions of protein length and structural class, and a similar ratio of multi- to single-domain proteins as the entire E. coli proteome41 (Supplementary Table 2). The details of the parameterization of these models are described in ref. 41. Each protein was synthesized on the same coarse-grain ribosome representation as Luciferase and their post-translational dynamics simulated for 30 CPU days per trajectory. Larger proteins take longer to simulate. Therefore, this fixed post-translational simulation run time resulted in trajectories of different durations due to different protein sizes. The simulation time in the post-translational phase ranged between 2.7 and 154.1 μs per trajectory. Because our coarse-grain model exhibits an approximately four-million-fold acceleration of folding dynamics28, due to decreased solvent viscosity42 and a smoother free-energy landscape43, these post-translational simulation times correspond approximately to experimental times of 11.0 to 611 s, respectively. As with Luciferase, ten trajectories were also initiated from the crystal structure of each protein and simulated for 30 CPU days to serve as reference simulations representing the native-state structural ensemble.
Two-thirds of nascent E. coli proteins populate misfolded states
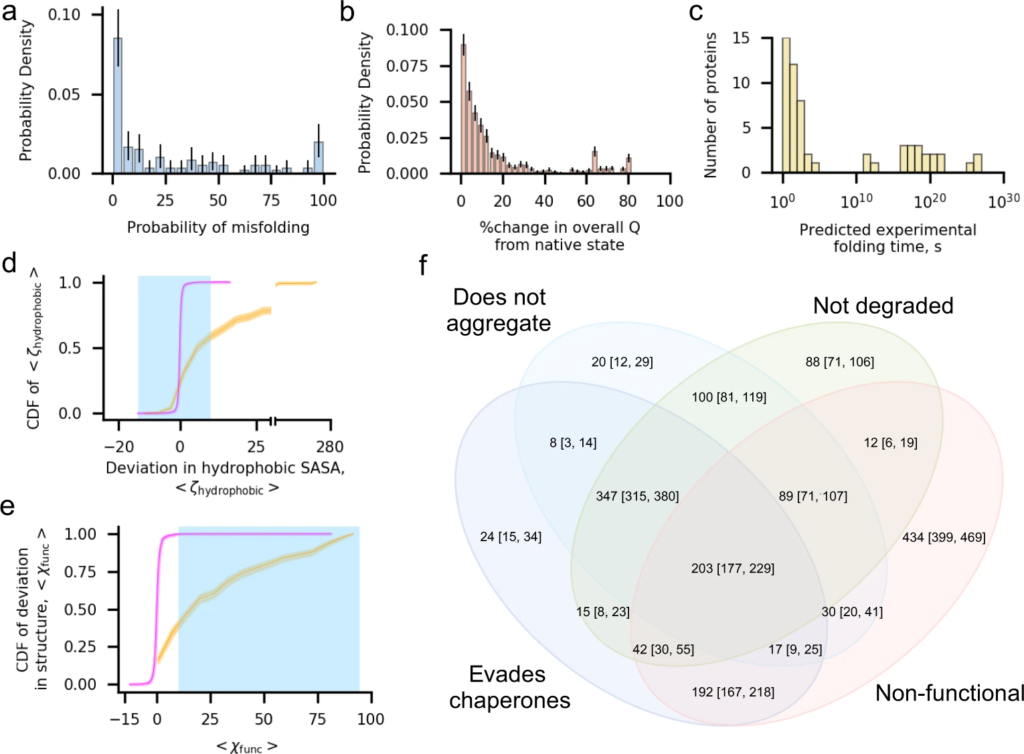
A fundamental question our simulation data set can address is how common nascent protein misfolding is across E. coli’s cytosolic proteome. As with Luciferase, we use the fraction of native contacts and entanglement as measures of misfolding. We find that 66% of proteins (80 out of 122) remain misfolded in at least one trajectory, 40% of proteins are misfolded in at least 20% of trajectories (49 out of 122), and 7% are misfolded in 100% of trajectories (9 out of 122). The proteins in these various categories are summarized in Supplementary Table 3; Fig. 2a displays a histogram of the probability of misfolding over the 122 different E. coliproteins simulated. In total, 27% of the simulation trajectories (1631 out of 6100) of the E. colicytosolic proteome remain in misfolded conformations after 30 CPU days of post-translational dynamics.
One in three proteins exhibit subpopulations that misfold into soluble but less-functional conformations that evade proteostasis machinery.
a Histogram of the mean probability of misfolding being detected in the final 100 ns of the simulation, computed as the number of misfolded trajectories divided by 50, for each of the 122 proteins in the cytosolic E. coli proteome set. b Histogram of the percent change, computed as |⟨𝑄overall⟩−⟨𝑄NSoverall⟩|⟨𝑄NSoverall⟩∗100%, in fraction of native contacts within the final 100 ns of each of the 1631 misfolded trajectories (⟨𝑄overall⟩ in the E. coli proteome data set relative to the average value from each protein’s native state simulations (⟨𝑄NSoverall⟩. The majority of misfolded proteins are within 10% of the native value. c Histogram of extrapolated folding times for the slow-folding kinetic phase from survival probability curves for the 73 proteins in the cytosolic E. coli data set with a reliable estimate (see “Methods”). d Cumulative distribution function (CDF) of ⟨𝜁hydrophobic⟩ computed over the values of ⟨𝜁hydrophobic⟩ (Eq. (10)) for 1631 misfolded (orange) and 4469 folded (magenta) trajectories. The blue shaded region indicates the set of ⟨𝜁hydrophobic⟩ values considered to have no significant increase in hydrophobic solvent-accessible surface area relative to the native-state ensemble. e Same as (d) but CDFs are computed over values of ⟨𝜒func⟩ for trajectories in the misfolded and folded populations. Blue shaded region indicates the set of values considered to result in perturbed function. f Venn diagram indicating the number of the 1631 misfolded trajectories that evade chaperones (TF, DnaK, and GroEL/GroES), do not aggregate, are not degraded, and are non-functional. The 203 trajectories at the center of this diagram are misfolded states that are expected to evade the proteostasis machinery, remaining soluble but non-functional. All error bars are 95% confidence intervals computed from bootstrapping 106 times; the height of the CDF plots in (d) and (e) indicates the 95% confidence intervals.
Many misfolded states are similar to the native state
Misfolded conformations that are very different from the native state will likely interact with the proteostasis machinery. To characterize the closeness of misfolded states to the native state across our set of misfolded conformations we calculated the absolute percent change in the mean overall fraction of native contacts ⟨𝑄overall⟩⟨Qoverall⟩ (in this case, computed over all residues in secondary structures within each protein, rather than for individual domains or interfaces) between each protein’s native state simulations and the mean 𝑄Q in the final 100 ns of each misfolded trajectory (Fig. 2b). We observe that 76% of misfolded trajectories (1242 out of 1631) have ≤20% change in mean 𝑄Q in comparison to the native state, while 58% of trajectories (939 out of 1631) misfold and have a ≤10% change in 𝑄Q. Nine percent of trajectories (144 out of 1631) have a ≤1% change in 𝑄Q. These calculations indicate that a large proportion of trajectories that misfold populate states that are native-like. Therefore, many E. coli proteins can populate kinetically trapped near-native conformations that are structurally similar to the native state.
Misfolded states can persist for days or longer after release from the ribosome
Misfolded conformations that persist for just a few minutes before properly folding are unlikely to have downstream consequences in a cell. To estimate the range of folding times for misfolded conformations we computed the survival probability of the unfolded state, 𝑆U(𝑡)SU(t), for each protein domain and interface and extracted their characteristic folding timescales using a three-state folding model, which reports folding timescales for the fast- and slow-folding phases (see “Methods”). For a protein to be considered folded all its component domains and interfaces must be folded. Furthermore, since folding pathways that pass through misfolded states take longer to reach the native state, the slow-folding phase reflects the time scale of these pathways. Therefore, for a given protein, we interpret the longest, slow-folding phase time as the time scale of the misfolded state reaching the native state. In total, we are able to reliably determine folding times for 73 out of 122 proteins, with fit equations for other domains having small Pearson 𝑅2R2 values indicative of low-quality estimates. These extrapolated folding times for the slow phase were then mapped onto experimental times using the acceleration factor associated with the coarse-grained model28(see “Methods”). The 25th, 50th, 75th, and 95th percentile mean folding times for the slow phase are 1.41 s, 50.9 s, 1.19 × 10⁷ d, and 3.83 × 10¹⁶ d, respectively, and the full range of times extend from 0.04 s to 1.08 × 10²² d (Fig. 2c, Supplementary Table 4). While values at very long times have larger uncertainties, as small differences in the fit parameters will lead to large variation in the extrapolated folding times, these results clearly indicate that many of these misfolded states can persist for many days or longer after synthesis.
Half of the proteome misfolds and bypasses the chaperone machinery
Misfolded proteins are engaged by various chaperones both co- and post-translationally that help direct their correct folding. So, we next determined how many of the trajectories that exhibit misfolding in our simulations are likely to evade chaperone-dependent quality control mechanisms. As was done for Luciferase, we considered the interactions of each of our 1631 misfolded trajectories with TF, GroEL/GroES, and DnaK based on the relative difference between the SASA of specific subsets of residues in the misfolded ensemble versus the native state ensemble (see “Methods”, Eqs. (9), (10), and (11)). We find that 1053 misfolded trajectories, representing 70 unique proteins, are not likely to interact with TF, as they display ⟨𝜁co−thydrophobic⟩≤10%⟨ζhydrophobicco−t⟩≤10% or are too short to engage with it co-translationally (see “Methods”, Supplementary Table 5, and Supplementary Fig. 2). A total of 1411 of misfolded trajectories representing 80 unique proteins are either not known GroEL/GroES44,45,46 clients or have ⟨𝜁hydrophobic⟩≤10%⟨ζhydrophobic⟩≤10%, and are therefore not likely to interact excessively with GroEL/GroES (Supplementary Table 5, Fig. 2d). Finally, we find that 1337 misfolded trajectories representing 77 unique proteins are either not confirmed DnaK clients11 or have ⟨𝜁DnaK⟩≤10%⟨ζDnaK⟩≤10% and are therefore unlikely to interact with DnaK excessively (Supplementary Fig. 3). A total of 848 trajectories representing 68 different proteins are misfolded and unlikely to interact with any of TF, GroEL/GroES, and DnaK (Supplementary Table 5, Supplementary Fig. 4). These results indicate that 56% of proteins in our representative sample (68 out of 122 unique proteins) exhibit misfolded subpopulations that can bypass chaperones.
Half of the proteome misfolds and remains soluble
We next assessed how many of the 1631 trajectories in which the protein misfolds represent conformational states that are likely to remain soluble. For each protein we computed ⟨𝜁agg⟩⟨ζagg⟩, the average relative difference in SASA of residues predicted to be aggregation prone computed over the final 100 ns for each misfolded trajectory, to quantify the difference in aggregation propensity for the misfolded population relative to the native state simulations (see “Methods”, Eq. (12)). Of the 1631 misfolded trajectories, 814 have ⟨𝜁agg⟩≤10%⟨ζagg⟩≤10%, indicating they are not likely to aggregate in excess of what is observed for the native state (Supplementary Table 6, Supplementary Fig. 5). We conclude that these trajectories, representing 56% of the proteins in the sample (68 out of 122), are unlikely to aggregate.
Half of the proteome misfolds and does not exhibit excess degradation
Next, we examined how many misfolded proteins are likely to avoid rapid degradation. We did this by computing ⟨𝜁hydrophobic⟩⟨ζhydrophobic⟩, which characterizes the percent difference between the total hydrophobic SASA of misfolded trajectories in comparison to the set of native-state simulations (Eq. (10)). The values of ⟨𝜁hydrophobic⟩⟨ζhydrophobic⟩ for 896 misfolded trajectories are ≤10%, indicating they are unlikely to be targeted for degradation. These 896 misfolded trajectories predicted to bypass degradation represent 57% (70 out of 122) unique proteins (Supplementary Table 6, Fig. 2d). Thus, a majority of proteins can populate, to varying degrees, misfolded states that are not expected to be degraded at rates much faster than their native fold.
Half of the proteome misfolds into conformations that bypass all aspects of the proteostasis machinery in E. coli
Misfolded conformations that do not engage chaperones, do not aggregate, and are not degraded in excess of the native state will remain soluble within the cell for a similar time scale as the native state. We cross-referenced our lists of misfolded trajectories that fall into each of these categories, finding that 9% of all trajectories simulated (550 out of 6100) misfold into such soluble conformations, and 48% of proteins (58 out of 122) have at least one such trajectory (Supplementary Table 7). Thus, nearly half of proteins in our sample have subpopulations of misfolded states that will bypass all aspects of protein homeostasis and stay misfolded for biologically long time periods.
Half of the proteome misfolds and will exhibit altered function
Next, we examined what percentage of the proteome misfolds and is likely to exhibit reduced function. To answer this question, we constructed a database identifying residues that take part in the function of each of the 122 proteins in our data set based on information available in PDB and UniProt database entries. These functional residues were identified based on whether they were in contact with substrates (such as other biomolecules, small-molecule compounds, or ions) in their PDB structures, as well as based on UniProt’s identification of functional residues (see “Methods”). We then computed the mean relative difference in the structural overlap function of these functional residues in the final 100 ns of misfolded trajectories relative to the native state reference simulations (⟨𝜒func⟩⟨χfunc⟩, see “Methods”). We find that 62% of misfolded trajectories (1019 out of 1631) have ⟨𝜒func,⟩≥10%⟨χfunc,⟩≥10%, indicating that structure at their functional sites are significantly perturbed, and by extension, likely their function. These trajectories represent misfolded conformations of 69 unique proteins, indicating that 57% of the proteome can populate misfolded conformations likely to exhibit reduced function (Supplementary Table 7, Fig. 2e).
One-third of proteins exhibit soluble, misfolded, native-like states with reduced functionality
We next determined which of our 122 proteins misfold, evade chaperones, aggregation, degradation, and display reduced function. We find that 34% of proteins (41 out of 122) and 3% of all trajectories (203 out of 6100) can bypass proteostasis machinery and display decreased function (Supplementary Table 7, Fig. 2f). The extrapolated folding times of these 41 soluble but non-functional proteins range from 2.13 s to 1.08 × 10²² days with a median predicted folding time of 1.05 × 10¹² days, indicating that their function is likely to be perturbed for long timescales.
Intra-molecular entanglement drives long-lived, soluble misfolded conformations
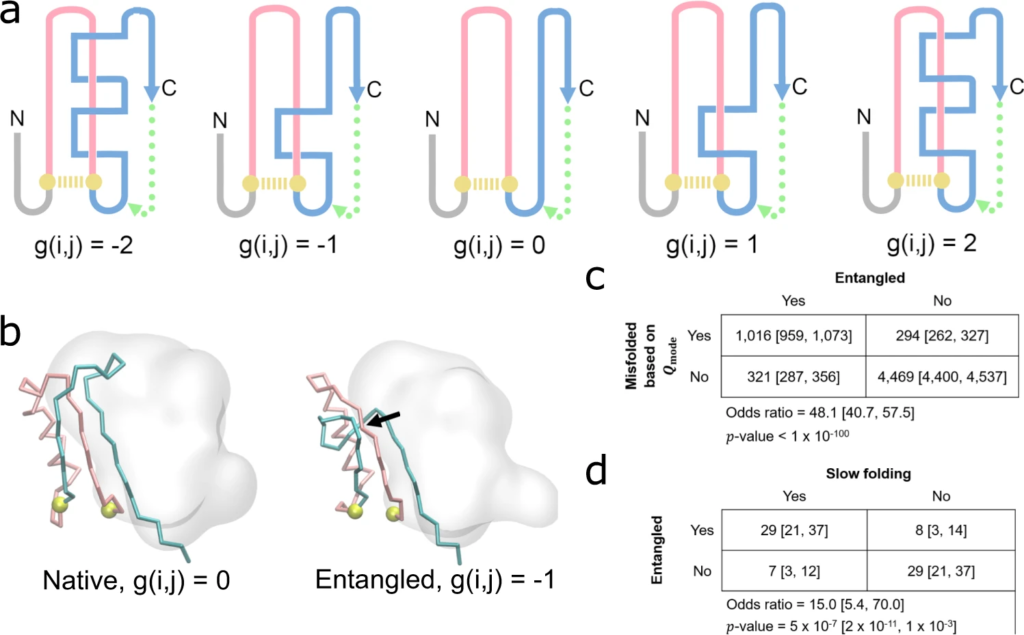
To determine what topological characteristics, if any, the misfolded conformations of different proteins have in common, we used the Gauss linking number calculated from linking between a closed loop formed by a native contact between residues i and j and the pseudo-closed loops formed by the flanking termini, g(i,j)47. This quantity provides a useful measure of whether subsections of the protein chain are entangled with each other48. Misfolding, or changes in the linkage between the two closed loops, can then be identified by changes in the Gauss linking number of specific native contacts between a reference structure and a target structure (Fig. 3a, b).
Detecting non-native entanglements in a monomeric protein structure.
a Schematic of how self-entanglements can be detected by examining the change in the Gauss linking number g(i,j) (Eq. (5)) between a closed loop (pink) formed by the backbone segment between residues i and j that form a native contact (gold dashed line) and another pseudo-closed loop formed by the C-terminal backbone segment (blue) and a pseudo-vector (dashed green line) connecting the C-terminal residue and the start of the C-terminal segment, which begins at residue j+1. Threading of the N-terminal segment (composed of residues 1 through i−1) is determined in a similar manner. Examples of different Gauss linking numbers and their corresponding structures are shown in this hypothetical illustration. The magnitude of g(i,j) is proportional to the number of threading events of the blue segment through the pink loop, while its sign is a function of the relative positioning of primary structure vectors at crossing points between the pink and blue segments. The structure with g(i,j) = 0 exhibits no entanglement. b An example of a gain in entanglement of the protein YjgH (PDB: 1PF5), where the C-termini (cyan) threads a loop (pink) formed by the native contact between residues D72 & Y104 (gold). The black arrow indicates the location of the crossing point of the two entangled loops. c Contingency table indicating the number of trajectories that are misfolded/folded across our 122 proteins based on 𝑄mode) e analysis and entangled/not entangled. Indicated p-values and odds ratios were computed in SciPy using the Fisher Exact Test. d Same as (c) except contingency table displays the number of proteins that are entangled/not entangled and predicted to be slow folding/fast folding. For the purposes of this analysis, a protein is considered slow- or fast-folding if its computed folding time is above or below the median folding time from the set of 73 proteins with reliable estimates, respectively. A protein is considered entangled if ≥50% of its misfolded trajectories are entangled. All error bars are 95% confidence intervals computed from bootstrapping 106 times.
To determine whether or not misfolded states tend to be entangled, we generated a 2-by-2 contingency table (Fig. 3c) tabulating the co-occurrence of misfolding based on ⟨𝑄mode⟩⟨Qmode⟩ and the presence of an entanglement. We find an odds ratio of 48.1 (𝑝<10−100p<10−100, Fisher’s Exact test), indicating that entanglement and misfolding frequently co-occur, with 82% of misfolded states containing an entanglement. Thus, misfolding is predominantly driven by entanglement of segments of the nascent protein with each other.
We hypothesized that due to the large energetic barrier needed to disentangle entanglements, the most long-lived misfolded states in the E. coli proteome would tend to be entangled. To test this hypothesis, we generated a second 2-by-2 contingency table and counted how frequently slow- and fast-folding proteins tend to be entangled (Fig. 3d). Proteins with an extrapolated folding time for the slow phase greater than the median were considered to be slow folding; and a protein’s misfolded state is considered entangled if ≥50% of its misfolded trajectories display an entanglement. We find an odds ratio of 15.0 (𝑝=5.0×10⁻⁷p=5.0×10⁻⁷, Fisher’s Exact test) indicating that the presence of entangled misfolded structures are 15 times more likely to be associated with slow folding. Thus, entanglement is the primary cause of long-lived misfolded states.
Finally, we further hypothesized that, because entangled conformations can represent local minima with only small structural perturbations relative to the native state, the set of 203 trajectories predicted to bypass proteostasis machinery to remain soluble but non-functional for long timescales should be enriched in entangled structures. We find that 93% of these trajectories are entangled (189 out of 203), and that there is a strong association between escaping proteostasis machinery and the presence of an entanglement (odds ratio 55.8, 𝑝=3.3×10−110p=3.3×10−110, Fisher’s Exact test; Fig. 4).
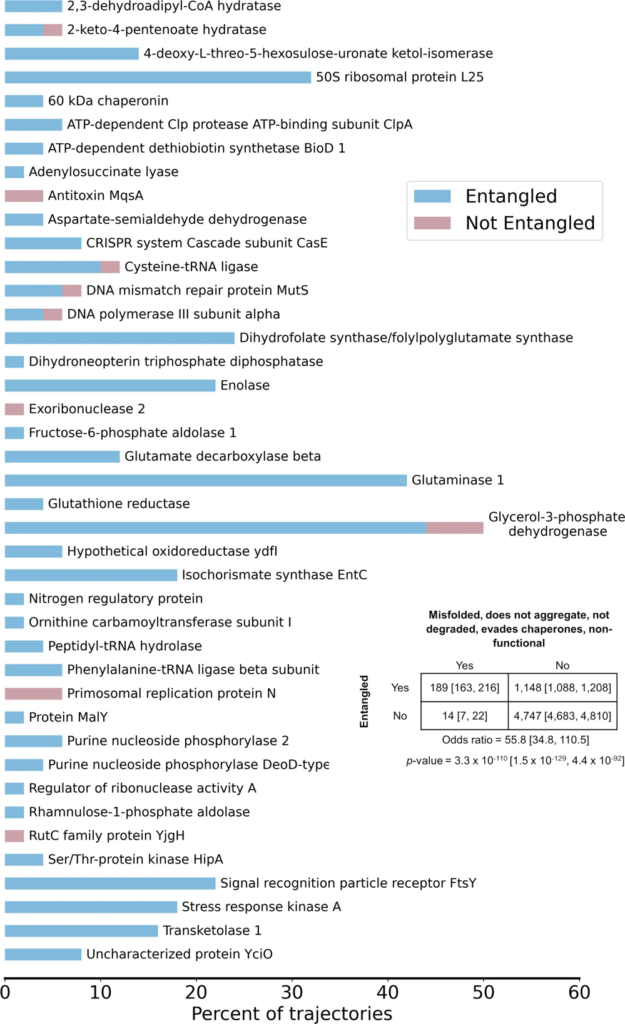
The vast majority of trajectories predicted to bypass cellular quality controls and exhibit reduced function are entangled.
The percent of trajectories out of 50 for each of the 41 proteins that bypass quality controls and are predicted to have reduced function that are entangled (blue) or not entangled (red). A total of 189 out of 203 trajectories are entangled. Protein names were taken from UNIPROT; see Supplementary Table 2 for the structures used and their corresponding gene names. Inset contingency table indicates the number of trajectories that are misfolded and escape proteostasis machinery while remaining non-functional and entangled/not entangled. Indicated 𝑝
p-value and odds ratio were computed in SciPy using the Fisher Exact Test. All error bars are 95% confidence intervals from bootstrapping 106times.
Taken together, these results demonstrate that the formation of entangled misfolded states lead to long-lived kinetic traps that can bypass the proteostasis machinery.
An in-depth case study
To illustrate our key findings, it is useful to consider the structural basis of misfolding for one protein in-depth. We focus on glycerol-3-phosphate dehydrogenase, which has the largest proportion of misfolded trajectories that are predicted to bypass the proteostasis machinery (see Fig. 4). It consists of two domains composed of residues 1–387 and 388–501 (Fig. 5a). As part of its biological function, glycerol-3-phosophate dehydrogenase uses a flavin adenine dinucleotide cofactor (Fig. 5a, dark blue). In our post-translational simulations 74% (=37/50) of trajectories misfold, yet they only exhibit a 4.7% decrease in the fraction of native contacts relative to the native-state simulations (Fig. 5b, c). Thus, these misfolded states resemble the native ensemble. This protein also folds extremely slowly, with Domain 1, Domain 2, and the interface between Domains 1 and 2 estimated to require, respectively, on the order of 1016, 1015, and 1021 s to fold (Fig. 5d). These misfolded states are, however, expected to evade chaperones, aggregation, and degradation to remain soluble based on the similarity of their surface properties to that of the native ensemble (Fig. 5e). Twenty-five misfolded trajectories (50%) also exhibit notably reduced structure at functional sites, including around the cofactor, despite being well-folded overall (Fig. 5f–h). In 92% (=34/37) of these misfolded trajectories a non-native entanglement is present. These results exemplify how entangled misfolded states can perturb portions of a protein critical for function in ways that are structurally subtle compared to gross deformations typically associated with misfolded proteins (Fig. 5d, h).
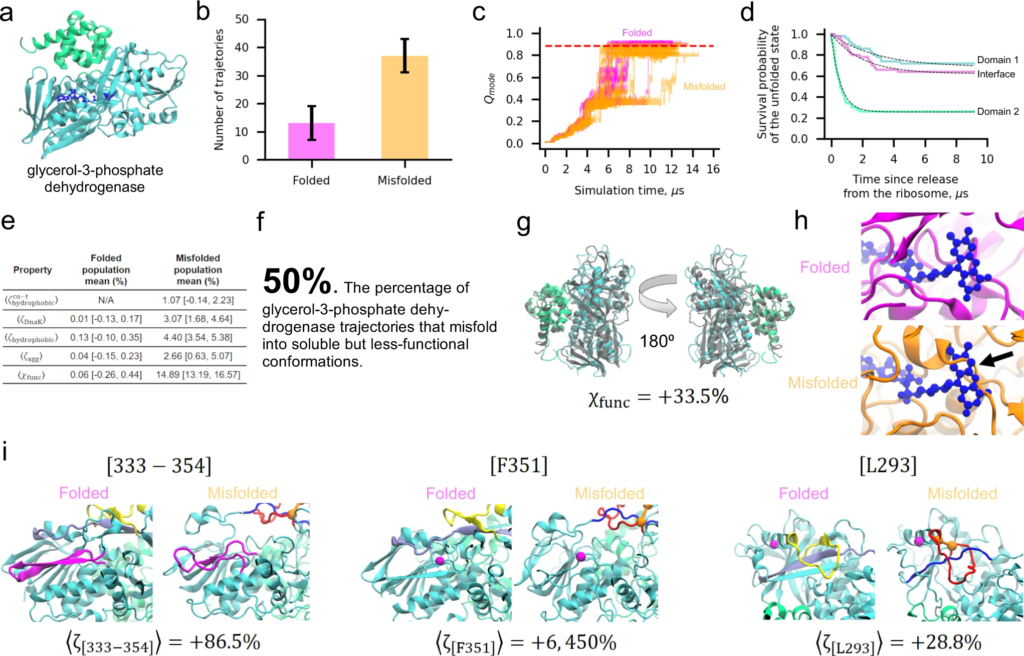
The two-domain glycerol-3-phosphate dehydrogenase protein displays widespread misfolding into soluble but less-functional conformations.
a Ribbon structure of glycerol-3-phosphate dehydrogenase (PDB ID: 2QCU). Domains 1 and 2 are composed of residues 1–387 and 388–501 and are colored cyan and green, respectively. The FAD cofactor is shown in a dark blue representation. b Number of folded (𝑁=13) and misfolded (𝑁=37) trajectories for this protein from 50 independent simulations. c 𝑄mode versus time for Domain 1 for the subpopulations of folded (magenta) and misfolded (orange) trajectories. Each line represents one independent trajectory. d Survival probability of the unfolded state versus time computed for Domain 1 (cyan), Domain 2 (green), and the Domain 1|2 interface as described in “Methods”. Dotted black lines are double-exponential fits. e Key parameters for the folded and misfolded populations. f 50% [36%, 64%] of glycerol-3-phosphate dehydrogenase trajectories are predicted to remain soluble but non-functional. g Representative misfolded structure colored as in (a) aligned to the native-state reference structure. Despite a high 𝜒func value indicative of a less-functional conformation, the protein is largely native. h Representative folded and misfolded structures back-mapped to all-atom resolution and then aligned to the native state based on the FAD-binding pocket residues. Steric conflict (indicated by black arrow) can be seen between the substrate-binding location and the misfolded binding pocket, indicating reduced function of this conformation. i Three pairs of structures corresponding to the native state (left) and the first representative structure of metastable state S2 (right) with locations of [333–354], F351, and L293 indicated in magenta. The loop (residues 271–288) and threading (residues 218–237) segments of the entanglement present in S2 are shown in red and blue, respectively. The same regions are colored yellow and light purple in the native state for reference, though no entanglement is present. The CA atoms of residues 271 and 288 that form the contact closing the loop segment are represented by orange spheres. Values of ⟨𝜁peptide⟩ were calculated with Eq. (16); error bars are available in Supplementary Table 8. All error bars are 95% confidence intervals computed from bootstrapping 106times.
An experimental test for structural changes associated with entanglement
To test these predictions for glycerol-3-phosphate dehydrogenase we carried out limited proteolysis mass spectrometry (LiP-MS, see “Methods”) in which whole extracts from cells were globally unfolded by incubation in 6 M guanidinium chloride, and refolded by rapid dilution. The structures of the refolding proteins were then interrogated with pulse proteolysis with proteinase K (PK), which specifically cuts at exposed or unstructured sites. The resulting fragments were identified and quantified with mass spectrometry and compared to those from native lysates that were never unfolded. Protease digestion was carried out at 1-min, 5-min, and 120-min timepoints after refolding conditions were established, and glycerol-3-phosphate dehydrogenase’s digestion pattern is observed to change over these time points (see “Methods” and Supplementary Data 1). We consider in our analysis only those peptides that show a greater than 3.5-fold difference in abundance in the refolded sample versus native sample (∣∣log2(𝑅𝑁)∣∣>|log2(RN)|> 1.8, Column W in Supplementary Data 1 sheet labeled “GlpD”) and whose difference is statistically significant (𝑝<0.01,−log10(𝑝)>2,p<0.01,−log10(p)>2, Column Y in same sheet, see “Methods”49). A total of ten unique peptides meet these criteria at one or more experimental time points. At 1 min residue V203 and residues [333–354] are significantly more exposed in the refolded sample than in the native sample. At 5 min L293, F351, Q487, and P387 are more exposed in the refolded than native sample, while V203 and [333–354] are no longer found to be different between refolded and native. After 120 min, seven exposed peptides are found: [333–354], F351, and L293 once again appear more exposed in refolded than native, while Y313, [284–302], D437, and G422 emerge as more exposed in the refolded sample. No one peptide is found to be more exposed in the refolded than native samples at all three time points, though L293, F351, and [333–354] are more exposed at two time points. These experimental data indicate that some glycerol-3-phosphate dehydrogenase molecules that fail to arrive at the native structure rapidly populate misfolded structures.
To test if the entanglements we observe in simulations of glycerol-3-phosphate dehydrogenase can explain these digestion patterns, we structurally clustered the coarse-grain conformations from the final 100 ns of our simulations (based on their 𝐺G and 𝑄overallQoverall) into eight metastable states denoted {S1, S2, …, S8}. We focus on segment [333–354] and residues F351 and L293 because these peptides persist in the experiments, being present at either the 1- or 5-min timepoints and the 120-min timepoint. In seven out of eight states an entanglement is present, with states S5, S7, and S8 the most native like (Supplementary Table 8). The entangled loop or threading segments in these states overlap with one or more peptide fragments in five out of eight states. Structure near cleavage sites is still perturbed even when the entangled region does not overlap with them. For example, the threading of residues 218–237 through the loop formed by residues 271–288 in S2 does not contain residues L293, F351, or segment [333–354]. However, this entanglement increases the solvent accessible surface area of these segments (Fig. 5i). This is most clearly seen for F351, which in the native state forms part of a β-sheet buried beneath the threading segment residues (Fig. 5i, middle panel, “Folded” structure). When this set of residues becomes entangled by threading through the loop (“Misfolded” structure in Fig. 5i), the thread is kinetically trapped in a position that exposes F351 much more than in the native fold. Calculating the solvent accessible surface area change (Eq. (16)) of these fragments in each metastable state we find broad agreement with the experimental data (Supplementary Table 8). Each of the seven entangled metastable states displays increased solvent accessibility at each of the three locations.
Discussion
Previous work has established that soluble, long-lived, non-functional protein misfolded states can arise from alteration of translation-elongation kinetics. Here, we estimate the extent of this phenomenon across the nascent proteome of an organism and examine the structural and kinetic properties of these kinetically trapped states. We predict that a majority of cytosolic E. coli proteins exhibit subpopulations of misfolded, kinetically trapped states, and that many of these misfolded states are similar enough to the native state to evade the proteostasis machinery in E. coli. We estimate that one-third of cytosolic E. coli proteins have subpopulations that misfold into near-native conformations that have reduced function and bypass the proteostasis network to remain soluble and non-functional for days or longer.
To appreciate these results, it is useful to understand the types of misfolding that can and cannot occur in our simulation model. The coarse-grain forcefield is parameterized for each protein based on its crystal structure, with this native-state conformation encoded as the potential energy minimum in the form of a Gō-based energy function (Eq. (1)). This means that the native state is the global free energy minimum at our simulation temperatures; any other state is metastable. Another consequence of this type of model is that misfolding involving non-native tertiary structure formation is not possible. Thus, the misfolded states our model can populate are topologically frustrated states that are kinetic traps50. A kinetic trap is a local minimum separated from other conformations in the ensemble by energy barriers much larger than thermal energy, making the attainment of the native state a slow process for some protein subpopulations. In our model, intra-molecular entanglements can occur. These entanglements consist of two parts: a contiguous segment of the protein that forms a ‘closed’ loop, where the loop closure is geometrically defined as a backbone segment that has a native contact between two residues at its ends, and another segment of the protein that threads through this loop (Fig. 3).
Proteins can misfold by a variety of mechanisms. For example, Bitran and co-workers51suggest that non-native contacts appear to play an important role in kinetic trapping of some proteins. Misfolding has also been observed via domain swapping52, in which highly similar portions of proteins swap with one another. Our results are not mutually exclusive with these other types of misfolding; indeed, one can imagine situations in which domain swapping involves the introduction of an entanglement, or in which non-native contacts form entanglements. Understanding the overlap and interplay of these various types of misfolding in real systems is an interesting open question.
It was previously hypothesized53 that like protein topological knots54 (which persist when pulling on both termini), this type of entanglement, which we refer to as a non-covalent lasso entanglement55, would generate topological frustration and be a kinetic trap. Simulations of proteins with topological knots in their native state50 observed that the wrong knot could form and that many of these states were long-lived kinetic traps as they required ‘backtracking’56 (i.e., unfolding) to fix the knot. While only 3 of the 122 proteins (genes rlmB, metK, and rsmE) in our study contain topological knots in the native state, the non-covalent lasso entanglement intermediates we observe are non-native pseudoknots54 (which unravel when pulling on both termini), and require either reptation of the threaded protein segment out of the closed loop (Fig. 3) or local unfolding of the loop surrounding the threaded segment to disentangle. Thus, the results of this study bridge the rich field of polymer topology with biologically important consequences for in vivo protein structure and function.
A potential criticism of this work is that the non-native entanglements we observe may be an artifact of our coarse-grained modeling of proteins. Several lines of evidence indicate this criticism is unfounded. A sufficiently long linear polymer performing a random walk will always sample knotted structures. Thus, it is a fundamental polymer property that knots and entanglements have the potential to form57. In a recent study, four entangled structures produced from our coarse-grained model were back-mapped and simulated using classical, all-atom molecular dynamics32. The entanglements, and native-like structure of these states persisted for the entire 1 μs simulation time. In another study, one-third of the protein crystal structures in the CATH database were found to contain in the native state the same types of entanglements we observe as intermediates58. Taken together, these results indicate that the entanglements we observe are realistic non-native intermediates that have the potential to be populated by many proteins.
Two differences between our simulations and the limited-proteolysis experiments lie in the preparation of the proteins and limits of detection. In the experiment, proteins are prepared in a chemically denatured state and then allowed to refold, compared to folding concomitant with or after translation. Protein’s that are prone to misfolding during translation are likely to be prone to misfolding during bulk refolding. Thus, while it is not necessary that the same misfolded states be populated under these two different situations, the consistency between the misfolded entangled states of glycerol-3-phosphate dehydrogenase and the persistent and significant protease fragments from the experiment indicates similar misfolded states do occur. Secondly, our computational workflow can detect proteins that misfold as little as 2% of the time (1 misfolded trajectory out of 50); on the other hand, to filter signal from noise, protein regions are only considered more (or less) exposed in the refolded form relative to native if the corresponding PK-fragment is >2-fold (i.e., ∣∣log2(𝑅𝑁)∣∣|log2(RN)| > 1 with 𝑝p < 0.01) more (or less) abundant in the proteolysis reaction49,59. Thus, the sensitivity of this approach to misfolded states with low populations is lower, and needs to be considered when comparing to the simulations results.
The majority of proteins simulated in this study misfold in some capacity. And 41 unique proteins, or about one-third of the proteins we simulated, have one or more trajectories that remain soluble and non-functional due to misfolding. Projecting this proportion across the entire set of 2600 proteins that make up the cytosolic E. coli proteome, we estimate that approximately 874 proteins may exhibit misfolding into soluble states. Given that a reduction in the function of a protein has the potential to influence multiple cellular processes, this result suggests that these misfolded states could exert wide-spread influences on cell behavior and phenotype. We also note that it is not only proteins that bypass all aspects of proteostasis and remain non-functional that can negatively impact cells. For example, protein conformations that avoid chaperones and degradation but then go on to aggregate may lead to the accumulation of amyloid fibrils.
Changes to the speed of translation, such as those that may be introduced by synonymous mutations in a protein’s mRNA template, can strongly influence the ability of proteins to fold7. The simulation results described here were generated using the wild-type translation rate profile for each protein (see “Methods”). Experiments have shown that changing translation speed can alter the subpopulation of soluble, less functional states several fold. Thus, the population of proteins that misfold have the potential to be significantly altered in our computer simulations what translation-elongation rates are altered. These complexities make exploration of the influence of translation kinetics on the propensity of the E. coliproteome to misfold an interesting direction for future research.
One of the most fundamental timescales of a protein is its half-life, which gives a measure of the lifetime of a typical copy of a protein between its synthesis and degradation. If misfolded states persist on the same timescale as the protein half-life then protein function will be perturbed for most of that protein’s existence. Unfortunately, we are unaware of any proteome-wide studies of protein half-lives in E. coli. However, based on studies of protein lifetimes in budding yeast60 and human cells61, which found median half-lives of 43 min (range 2 min to 81 days) and 36 h (range: 8 h to 153 days), respectively, we estimate that typical half-lives in E. coli range from minutes to hours. Many of our extrapolated folding times from our simulations are on the same order of magnitude as these values or greater, indicating that misfolded states with reduced function can persist for the entire lifetime of a protein. This is consistent with the experimental observation that misfolding can influence folding and function for extended periods1,2,62.
If the half-life is a fundamental time scale of a protein, then the cell-division time is a fundamental time scale of a bacterium. In E. coli, doubling times during exponential growth phase range from tens of minutes to hours depending on the growth medium63. A total of 31 of our 122 proteins have extrapolated folding times for the slow phase longer than 40 min. And, of the 41 proteins that misfold into soluble but less-functional states, 15 have extrapolated folding times longer than 40 min. Since these folding times are on a similar time scale as the doubling time, soluble misfolded conformations will be split between the daughter cells. This suggests that the memory of those events can be encoded in these kinetically trapped states and transferred to the daughter cells. It will be an interesting area of future study to determine whether inheritance of soluble, misfolded proteins with potentially altered function can act as a mechanism for epigenetic inheritance and influence daughter cell behavior.
A key question potentially addressed by our simulations is what allows these misfolded states to remain misfolded in non-functional states for such long timescales? Entanglements allow these misfolded states to persist for long timescales, and their largely native topologies mean they are not excessively acted upon by the proteostasis machinery. In many instances, large-scale unfolding would need to take place in order for the entangled protein to disentangle50to a state from which the native fold is more readily accessible. One interesting avenue for future research is comparison of our results concerning misfolding after ribosomal synthesis with simulations of refolding from denatured chains. Such work would provide a clearer comparison to LiP-MS experiments and enable us to test the hypothesis of whether protein synthesis reduces protein misfolding.
In summary, we have found that the majority of E. coli proteins misfold in our simulations, and that some proteins misfold into states that likely bypass cellular proteostasis machinery to remain soluble but with reduced function. We find that these misfolded conformations are able to remain soluble because they are, overall, very similar to the native state, but with certain entanglements that lead to perturbed structure and function. Given that self-entanglement is a fundamental polymer property, the entanglements we have observed represent a universal type of misfolding that has the potential to impact a range of proteins and functions. Specifically, our simulation results suggest the hypothesis that entangled states may be the source of reduced dimerization2, enzymatic function64, and small-molecular transport27 upon changes in translation kinetics induced by synonymous mutations. Future theoretical and experimental efforts should focus on the structural characterization of non-native entangled states and their influence on protein function.