
Regulation of the Ca2+ channel α2δ-1 subunit expression by epidermal growth factor via the ERK/ELK-1 signaling pathway
By Paz Duran, Alejandro Sandoval, Ricardo González-Ramírez, Natanael Zarco, and Ricardo Felix
Excerpt from the article published in American Journal of Physiology-Endocrinology and Metabolism 2020 319:1, E232-E244 02 JUL 2020 DOI: https://doi.org/10.1152/ajpendo.00007.2020
Editor’s Highlights
- CaVα2δ-1 auxiliary subunit has been shown to increase the cell-surface expression of HVA CaV channels, it is reasonable to suggest that epidermal growth factor (EGF) may be acting by promoting the transcriptional expression of CaVα2δ-1.
- EGF treatment seems to increase the proportion of classical lactotropes (cells that secrete only PRL) in both pituitary primary cell cultures from neonatal rats and the GH3 clonal cell line.
- EGF exerts its actions by binding to a family of receptors (EGFR/ErbB) consisting of four members, named ErbB1–ErbB4. The binding of the growth factor to its receptor leads to the formation of an activated ErbB dimer, which exhibits autophosphorylation.
- EGF, by activating the Ras/Raf/MEK/ERK/ELK-1 signaling pathway, increases the expression and plasma membrane localization of the CaVα2δ-1 auxiliary subunit in GH3 cells.
- CaVα2δ-1 increase by EGF treatment may influence the functional expression of HVA CaVchannels at the plasma membrane, and this effect may result in enhanced PRL secretion in pituitary GH3 cells.
Abstract
Voltage-gated Ca2+ (CaV) channels are expressed in endocrine cells where they contribute to hormone secretion. Diverse chemical messengers, including epidermal growth factor (EGF), are known to affect the expression of CaV channels. Previous studies have shown that EGF increases Ca2+ currents in GH3 pituitary cells by increasing the number of high voltage-activated (HVA) CaV channels at the cell membrane, which results in enhanced prolactin (PRL) secretion. However, little is known regarding the mechanisms underlying this regulation. Here, we show that EGF actually increases the expression of the CaVα2δ-1 subunit, a key molecular component of HVA channels. The analysis of the gene promoter encoding CaVα2δ-1 (CACNA2D1) revealed binding sites for transcription factors activated by the Ras/Raf/MEK/ERK signaling cascade. Chromatin immunoprecipitation and site-directed mutagenesis showed that ELK-1 is crucial for the transcriptional regulation of CACNA2D1 in response to EGF. Furthermore, we found that EGF increases the membrane expression of CaVα2δ-1 and that ELK-1 overexpression increases HVA current density, whereas ELK-1 knockdown decreases the functional expression of the channels. Hormone release assays revealed that CaVα2δ-1 overexpression increases PRL secretion. These results suggest a mechanism for how EGF, by activating the Ras/Raf/MEK/ERK/ELK-1 pathway, may influence the expression of HVA channels and the secretory behavior of pituitary cells.
INTRODUCTION
High voltage-activated (HVA) Ca2+ (CaV) channels regulate Ca2+ influx and thereby contribute to Ca2+ signaling in many cell types. In the endocrine system, among other actions, CaV channels are key molecular elements controlling the release of several peptide hormones (7, 48). Although in recent years, significant progress has been made in understanding the properties and the regulation of CaV channels at the molecular level, few details are known concerning its regulation at the transcriptional level. From the molecular point of view, CaV channels are heteromeric complexes composed of a main subunit that forms the ion-conducting pore (CaVα1), for which its activity can be regulated by three different auxiliary subunits, called CaVα2δ, CaVβ, and CaVγ (10, 14). Studies have shown that the CaVα2δ subunit favors the trafficking and cell-surface expression of channels, producing an increase in Ca2+ current density (2, 6, 10, 13). Four CaVα2δ subunit genes (CACNA2D1–CACNA2D4) have now been cloned, for which their expression has been documented in several cell types, including those of the endocrine system (27, 35, 46).
The pituitary gland, or hypophysis, regulates the activity of several other endocrine glands in the body. It is divided into two regions: the neurohypophysis and the anterior pituitary gland (adenohypophysis). The first comprises nerve endings from hypothalamic neurons, whereas the adenohypophysis is composed of intermediate and anterior lobes that contain various endocrine cell types responsible for secreting diverse hormones, including prolactin (PRL) (1). Many cell differentiation processes in the adenohypophysis depend on several elements, among which epidermal growth factor (EGF) plays a central role (9, 15, 24, 37). When EGF binds to its receptor (EGFR), its autophosphorylation triggers the activation of different signaling pathways, such as Ras/Raf/MEK/ERK, JAK/STAT, phosphatidylinositol 3-kinase (PI3K)/AKT/mammalian target of rapamycin (mTOR), and PLCγ/PKC, which regulate important cellular processes, including cell proliferation, migration, and differentiation (44, 49).
Previous studies in GH3 cells, a cell line derived from a rat adenoma comprising a cell population, known as lactosomatotropes, that secretes both growth hormone (GH) and PRL, have indicated that these cells can differentiate into classic somatotropes (exclusive GH secretors) or classic lactotropes (exclusive PRL secretors) (15, 16). It is also known that EGF increases the synthesis and secretion of PRL and induces the differentiation of GH3 cells into classic lactotropes (15, 26, 40, 45). Furthermore, it has been shown that chronic treatment with EGF is associated with an increase in the proportion of functional HVA CaV channels in the cell surface of GH3 cells (32).
Given that the CaVα2δ-1 auxiliary subunit has been shown to increase the cell-surface expression of HVA CaV channels (2, 6, 10, 13), it is reasonable to suggest that EGF may be acting by promoting the transcriptional expression of CaVα2δ-1. Therefore, in the present work, we investigated whether the chronic treatment of GH3 cells with EGF can increase the transcriptional activity of the CACNA2D1 gene encoding the CaVα2δ-1 subunit. In addition, we examined the signaling pathways and the possible factors involved in the transcription of the CaVα2δ-1 channel auxiliary subunit in response to EGF. We focused our attention on E twenty-six (ETS)-like 1 (ELK-1), because this transcription factor, activated by the ERK1/2 pathway, has been involved in several differentiation processes (38, 41).
…
RESULTS
We first investigated the possible signaling pathways activated by EGF treatment in the GH3 cell line. Our initial luciferase assays showed that treatment with the growth factor (5 nM) produced a rapid (in 5–10 min) and significant increase (two- to three-fold) in the activity of the promoter of the CACNA2D1 gene that codes for the CaVα2δ-1 subunit (Fig. 1A). Therefore, to determine whether Akt and ERK signaling pathways were activated by EGF treatment, the GH3 cells were incubated with 5 nM EGF at different times, and the possible activation of ERK1/2 and Akt was determined by Western blot analysis using anti-p-ERK1/2- and anti-p-Akt-specific antibodies. As shown in Fig. 1B, the results obtained for Akt, one of the molecular actors in the PI3K/AKT/mTOR signaling pathway, were that there is a significant increase in the level of Akt phosphorylation soon after the start of treatment (30 min). Conversely, the phosphorylation of ERK1/2, a protein kinase that activates transcription factors ELK-1 and CREB, also increases rapidly in response to EGF treatment (Fig. 1C). Interestingly, bioinformatics analysis of the promoter used in these assays (30) showed the presence of two binding sites for transcription factor CREB and one for ELK-1 upstream of the transcription start site (TSS). The initial deletional analysis of the promoter sequence showed that the two distal sites (one for CREB and that of ELK-1) might be important for transcriptional activity (Fig. 1D). These data suggest the possible involvement of the Ras/Raf/MEK/ERK signaling pathway in the molecular mechanism of CaVα2δ-1 subunit regulation in response to EGF treatment. Therefore, we focused our attention on the documentation of ELK-1 and CREB factors as possible transcriptional regulators of this process.
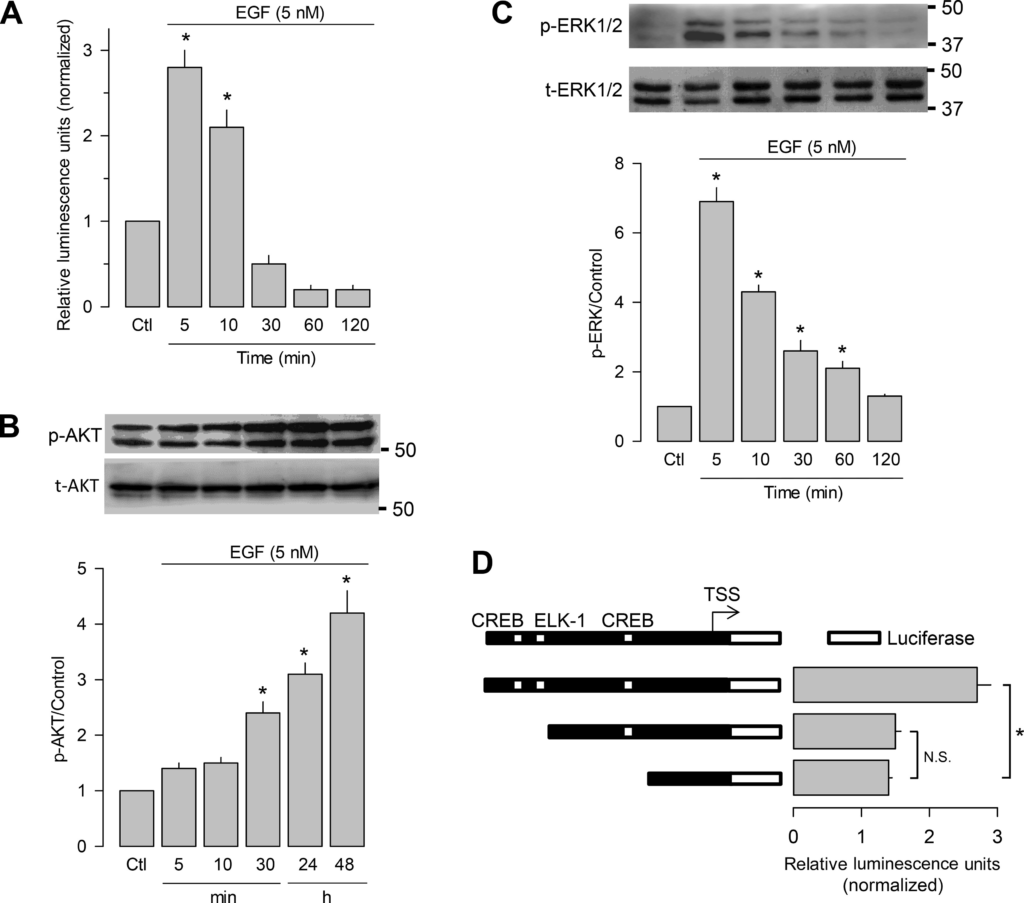
EGF increases the transcriptional activity of the CaVα2δ-1 subunit gene (CACNA2D1) promoter and induces phosphorylation of ERK and Akt in growth hormone (GH)3 cells. A: luciferase assays of the CACNA2D1 gene promoter (encoding CaVα2δ-1) in response to EGF treatment (5 nM; n = 4). B: time course of EGF treatment on phosphorylated Akt (p-AKT) and total (t-AKT), evaluated by Western blot analysis (top). Bottom: quantification of p-Akt using t-Akt as a reference protein (n = 3). C: time course of EGF treatment on phosphorylated ERK1/2 (p-ERK) and total ERK1/2 (t-ERK) expression, evaluated by Western blot analysis (top). The bar chart (bottom) shows the quantification of p-ERK using t-ERK as a reference protein (n = 3). D: analysis of the CACNA2D1 gene promoter showing the presence of binding sites for transcription factors cAMP response element-binding protein (CREB) and E twenty-six (ETS)-like 1 (ELK-1) and luciferase assays in response to EGF treatment (5 nM, 5 min; left). Summary of the results obtained in 3 separate experiments. All data are presented as the means ± SE; statistical significance: *P < 0.001 one-way ANOVA. Ctl, control; N.S., not significant; TSS, transcription start site.
We next sought to determine whether the EGF treatment indeed modifies the expression of the CaVα2δ-1 auxiliary subunit of CaV HVA channels in the GH3 cells at the level of protein. Expression of the auxiliary subunit in the presence of EGF (5 nM) in the cell culture medium is shown in Fig. 2A. As can be seen, the EGF-induced increase in CaVα2δ-1 expression reached a maximum, 24–48 h after dosing. To investigate whether this increase in the total expression of CaVα2δ-1 also increased the amount of protein in the plasma membrane, biotinylation assays of cell-surface proteins were performed. The results of this analysis also show that the treatment with the growth factor EGF induced a significant increase (∼60%) in the expression of both total and cell membrane CaVα2δ-1 protein (Fig. 2B). Given that CaVα2δ-1 facilitates the trafficking of the channels to the plasma membrane, these findings may help explain the previously observed increase in Ca2+ current density reported in GH3 cells in their transit from a bihormonal to a PRL-only secretory phenotype in response to EGF (15).
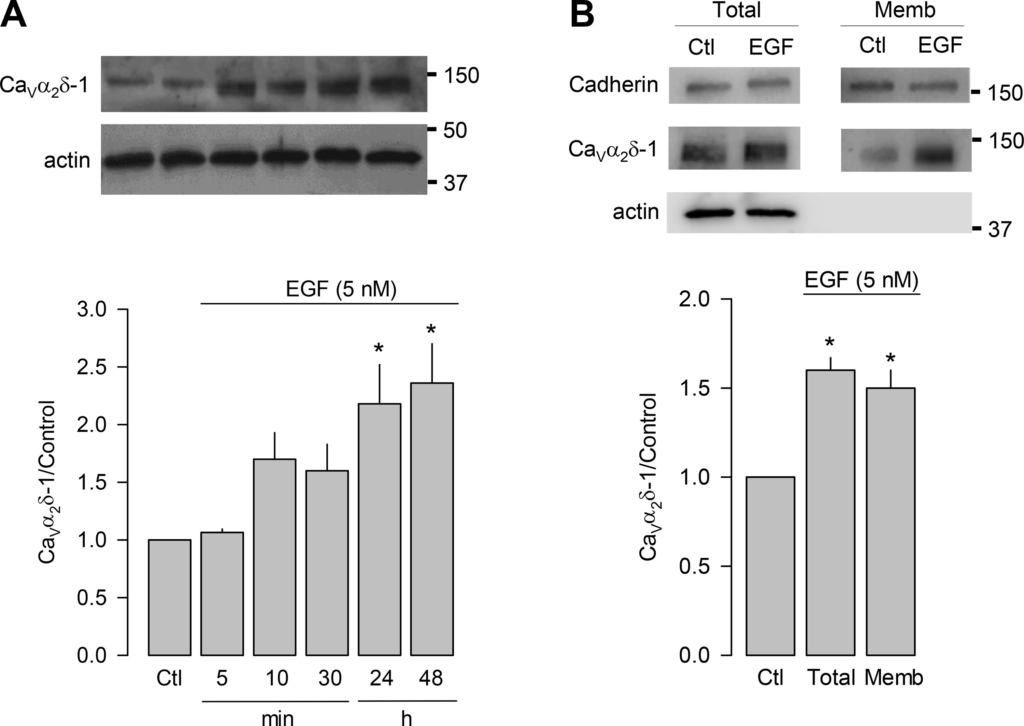
EGF induces the expression of the CaVα2δ-1 subunit of high voltage-activated (HVA) channels. A: Western blot analysis of CaVα2δ-1 expression in GH3 cells treated with 5 nM EGF for 5 min to 48 h, as indicated, using anti-CaVα2δ-1-specific antibodies and anti-actin antibodies as a load control (top). The bar chart (bottom) shows the quantification of the CaVα2δ-1 signal, normalized with respect to the control (n = 4 independent experiments; *P = 0.0036 Kruskal-Wallis one-way ANOVA). B: Western blot analysis of the amount of total or plasma membrane CaVα2δ-1, expressed in GH3 cells under control (Ctl) conditions or treated with 5 nM EGF for 48 h (top). Actin was used as a control of total protein and cadherin loading as a control of membrane protein load. The bar graph (bottom) shows the expression of CaVα2δ-1 on the cell surface with standardized EGF treatment with respect to its control. All data are presented as the means ± SE; statistical significance: *P < 0.0001 (Total) t test (n = 8); *P = 0.011 [membranal (Memb)] t test (n = 4).
Because our initial studies showed that EGF activates the Ras/Raf/MEK/ERK signaling cascades in GH3 cells, and ELK-1 and CREB may be the possible transcriptional regulators of this process, it was necessary first to determine whether these transcription factors were indeed activated in response to EGF. By performing Western blot analysis using antibodies against the phosphorylated forms of ELK-1 and CREB, we found that the treatment with the growth factor significantly stimulated the phosphorylation of the transcription factors (Fig. 3, A and B). The role of Ras/Raf/MEK/ERK on CaVα2δ-1 expression was further corroborated by experiments using the ERK inhibitor CAS 1049738-54-6 (CAS). The comparison of total and phosphorylated ELK-1, as well as CaVα2δ-1 in control and EGF-treated cells in the absence and presence of CAS, is shown in Fig. 3, C and D. These results corroborate the increase in CaVα2δ-1 subunit expression caused by EGF treatment and show that coincubation of the GH3 cells with CAS abrogates the stimulatory effect of the growth factor on CaVα2δ-1 expression. In this scenario, ERK1/2 cannot phosphorylate its effectors, including ELK-1, suggesting that the Ras/Raf/MEK/ERK signaling pathway participates directly in the molecular mechanism activated by EGF.
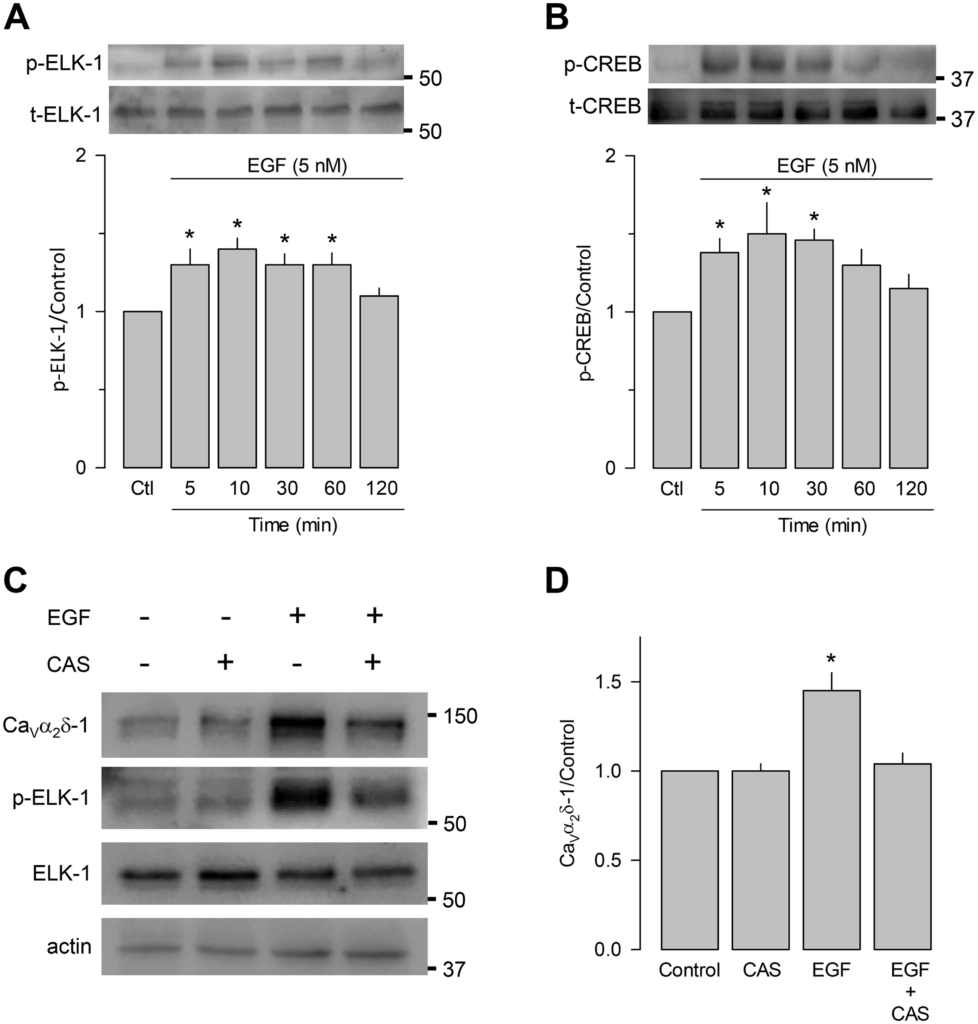
EGF induces phosphorylation of ELK-1 and cAMP response element-binding protein (CREB) transcription factors. A: comparison of total (t)- and phosphorylated (p)-ELK-1 levels in EGF-treated GH3 cells (5 nM; 5–120 min), detected by Western blot using anti-ELK-1 and anti-phospho-ELK-1 antibodies (top). The bar chart (bottom) shows the quantification of the normalized ELK-1 phosphorylation signal with respect to the control (n = 4 independent experiments; *P = 0.0014 one-way ANOVA). B: comparison of total and phosphorylated CREB levels in EGF-treated GH3 cells (5 nM; 5–120 min), detected by Western blot using anti-CREB and anti-phospho-CREB antibodies (top). The bar chart (bottom) shows the quantification of the normalized CREB phosphorylation signal with respect to the control (n = 4 independent experiments; *P = 0.023 one-way ANOVA). C: phospho-ELK-1 detection and voltage-gated Ca2+ (CaV)α2δ-1 subunit expression after ELK-1 inhibition using CAS 1049738-54-6 (CAS). D: comparison of the CaVα2δ-1 subunit expression in the absence or the presence of EGF, with and without the ELK-1 inhibitor (n = 4 independent experiments; statistical significance: *P = 0.009 one-way ANOVA). All data are presented as the means ± SE.
We next investigated whether ELK-1 or CREB knockdown could have an impact on the regulation of the promoter that drives the transcription of the gene encoding the CaVα2δ-1 subunit (CACNA2D1). To this end, GH3 cells were cotransfected with the CACNA2D1 promoter cloned in the reporter plasmid and with specific siRNAs against ELK-1 or CREB, and luciferase assays were performed to assess the activity of the promoter. Figure 4, A and B, shows that the knockdown of the transcription factors was successful in GH3 cells, as indicated by the significant decrease (~50%) in their expression in Western blot assays using specific antibodies. Loading controls were monitored with an anti-actin antibody. Interestingly, ELK-1 and CREB silencing also prevented the increase in the transcriptional activity of the CaVα2δ-1 gene promoter in response to the EGF treatment (Fig. 4C). Likewise, the possible involvement of the ELK-1 and CREB consensus-binding sites on the EGF-induced activation of the CACNA2D1gene promoter was assessed by generating the corresponding point mutations (Fig. 4D). Once the mutants were obtained, their transcriptional activity was evaluated by luciferase assays in control conditions and in response to EGF. The mutation that disrupted the CREB site exhibited full responsiveness to EGF, suggesting that this transcription factor might not be necessary for induction of CACNA2D1 gene promoter activity by the growth factor. In sharp contrast, the mutation that disrupted the ELK-1 site completely prevented the EGF-induced activation of the promoter, suggesting that the ELK-1-binding element within the promoter is necessary for CaVα2δ-1 transcriptional activation in GH3 cells.
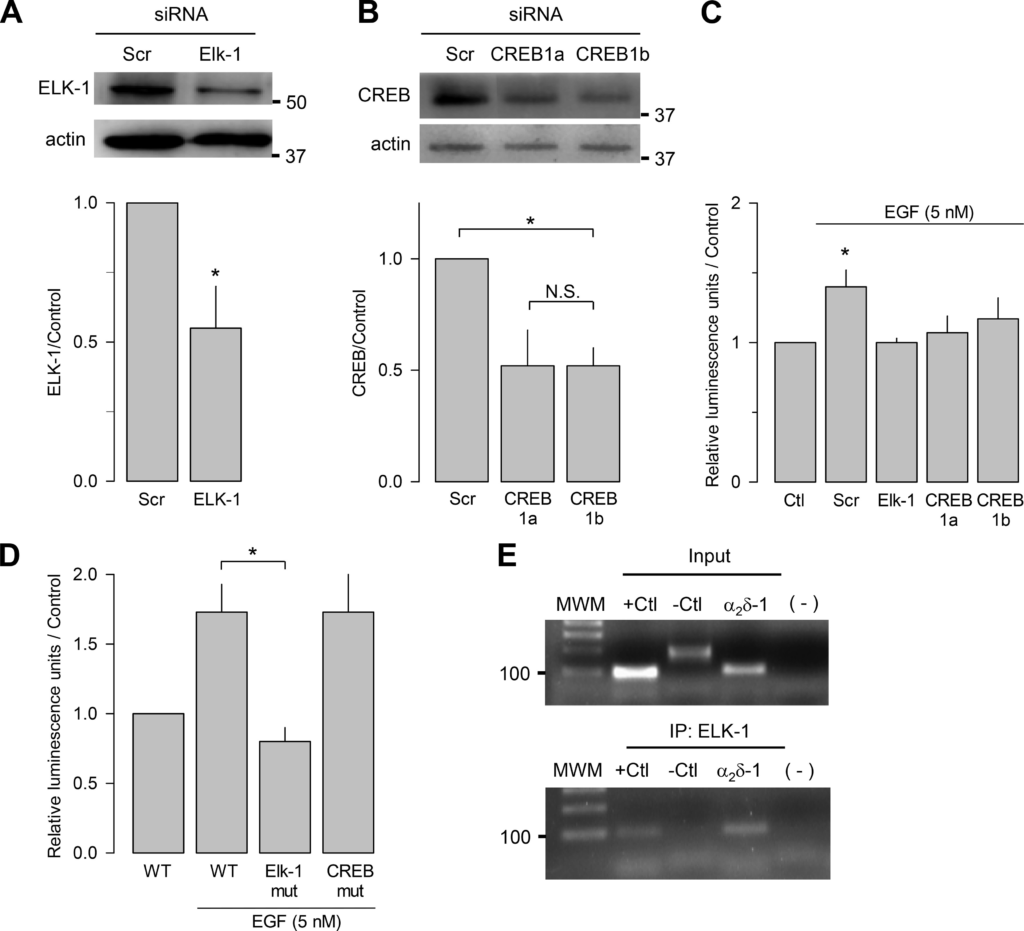
ELK-1 binds to the CaVα2δ-1 subunit gene (CACNA2D1) promoter and induces transcription. A: GH3 cells were transfected with an ELK-1 siRNA and analyzed 48 h later by Western blot using specific antibodies to verify the siRNA-mediated reduction of ELK-1 endogenous expression (top). The bar chart (bottom) shows the densitometric quantification of ELK-1 protein in control [scrambled (Scr)] and siRNA-transfected cells (n = 5 independent experiments; *P < 0.001 t test). B: Western blot analysis using specific antibodies to verify the siRNA-mediated reduction of cAMP response element-binding protein (CREB) endogenous expression (top). Cells were transfected with 2 CREB (1a and 1b) siRNAs and analyzed as in A (n = 3 independent experiments; CREB1a: *P = 0.0476 ttest, CREB1b: *P = 0.0087 t test). The bar chart (bottom) shows the densitometric quantification of CREB protein in control and siRNA-transfected cells. C: luciferase assays of the wild-type (WT) CACNA2D1 gene promoter in untransfected GH3 cells [control (Ctl)] of cells transfected with a control (Scr) or ELK-1 or CREB siRNAs in the absence and presence of EGF (5 nM; 5 min; n = 4 independent experiments; *P < 0.001 Kruskal-Wallis one-way ANOVA). D: luciferase assays of the wild-type (WT) CACNA2D1 gene promoter or CACNA2D1 gene promoter harboring mutations (mut) at the ELK-1- or CREB-binding sites in response to EGF (5 nM; n = 4 independent experiments; *P = 0.011 one-way ANOVA). E: chromatin immunoprecipitation of ELK-1 in nuclear lysates from GH3 cells in the presence of EGF (5 nM, 10 min), using an anti-ELK-1 antibody. +Ctl, positive control (c-Fos); −Ctl, negative control (GAPDH). Molecular weight markers (MWM) are indicated on the left. All data are presented as the mean ± SE, and the asterisks denote statistical significance. α2δ-1, CaVα2δ-1; IP, immunoprecipitation; N.S., not significant.
This hypothesis is supported by the analysis of the in vivo association of the transcription factor with chromatin fragments covering the ELK-1 site using chromatin immunoprecipitation (ChIP). These experiments were performed using antibodies against ELK-1, and for control purposes, we used antibodies against the unrelated protein Pet (34). The DNA immunoprecipitated by the ELK-1 antibodies was analyzed with primers that amplify the regulatory region of the CACNA2D1 encompassing the ELK-1-binding site. The promoter region of the gene encoding c-Fos and the coding region of GAPDH were used as positive and negative controls, respectively (Fig. 4E, top). Figure 4E, bottom, shows that the transcription factor ELK-1 indeed interacts in vivo with the regulatory region of the CACNA2D1 gene promoter in EGF-treated GH3 cells.
As mentioned earlier, previous reports indicate that the CaVα2δ-1 subunit modulates the functional properties and the trafficking of the HVA channels toward the cell membrane, which results in increased Ca2+ current amplitudes (2, 6, 10, 13, 14). Therefore, it was reasonable to propose that the overexpression of the auxiliary subunit may result in an upregulation of functional HVA CaV channels in the plasma membrane of the GH3 cells. To test this hypothesis, electrophysiological recordings were conducted using the whole-cell mode of the patch-clamp technique. Currents were evoked by applying voltage steps (in increments of 5 mV) from a holding potential (Vh) of −80 mV. Figure 5A shows representative superimposed current traces in the control condition and in cells overexpressing the auxiliary subunit of the HVA channels. A marked increase in current amplitude was observed in GH3 cells transiently transfected with a plasmid cDNA construct encoding CaVα2δ-1.
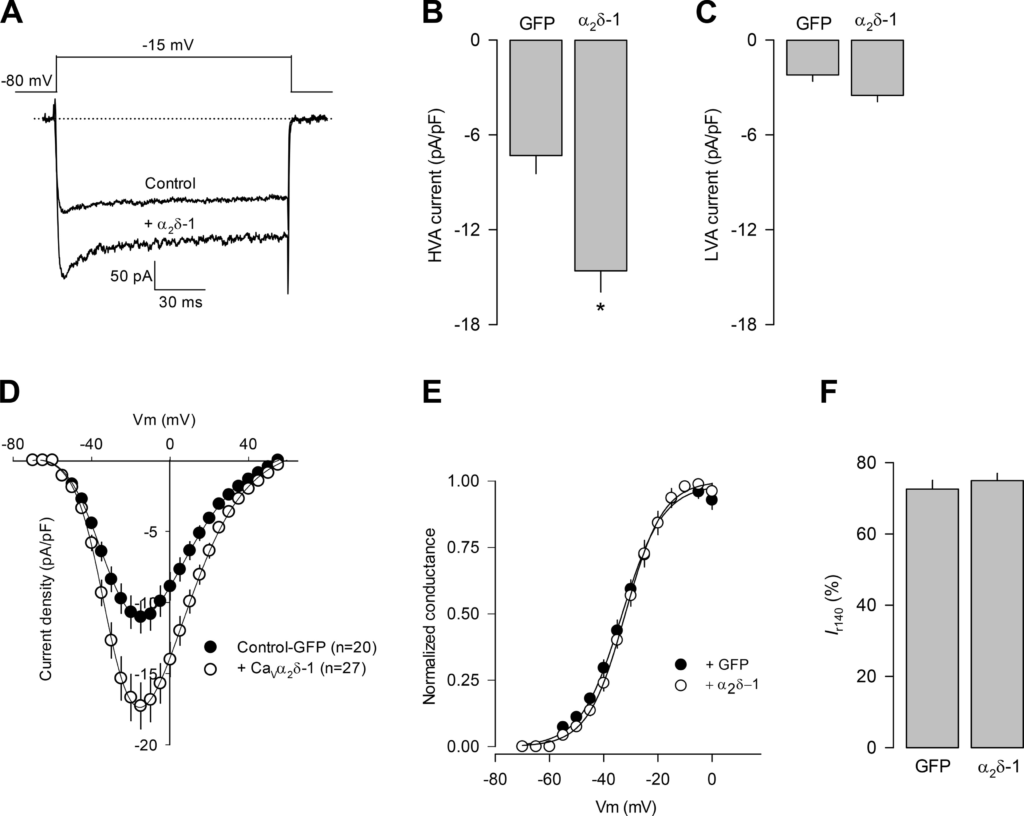
CaVα2δ-1 overexpression increases high voltage-activated (HVA) Ca2+ currents in GH3 cells. A: superimposed Ca2+ channel current traces obtained in GH3 cells in the control condition (transfected with the cDNA clone encoding GFP) or transfected with the cDNA clone encoding the CaVα2δ-1 auxiliary subunit of CaV channels. B and C: bar chart comparing the average current density (in pA/pF) through HVA and low voltage-activated (LVA) channels, respectively, after GFP or CaVα2δ-1 as in A. D: I-V plots for channel currents recorded in GH3 cells transfected as in A. E and F: comparison of the normalized maximal conductance as a function of voltage and percentage of current remaining at the end of the 140-ms voltage step (Ir140), respectively, in cells expressing GFP or CaVα2δ-1. Data are presented as the means ± SE; statistical significance: *P < 0.003 t test. Some SEs are not visible in E, because the symbols overlap the error bars. Vm, test membrane potential.
It is worth noting here that the GH3 cells express both HVA and low voltage-activated (LVA) channels and that according to what is known regarding the molecular structure of CaV channels, the expression of the auxiliary subunit should only affect the HVA component of the total current. To test this, we first separated the total current into its two components using a standard protocol, which consisted of applying two 100-ms depolarizing steps to −10 mV from a Vh of −80 mV, separated by a 10-ms interpulse interval. During the first step, the two components of the total currents are activated; however, the LVA channels undergo full inactivation by the end of this pulse. Therefore, the second step to −10 mV activates only the HVA component of the current. By subtracting the currents obtained in response to the second pulse from the currents evoked with the application of the first pulse, the magnitude of the LVA component can be estimated. The results of this analysis showed that the overexpression of the CaVα2δ-1 subunit significantly increased (>2-fold) the current through HVA channels (Fig. 5B), without apparently affecting LVA currents (Fig. 5C), corroborating the stimulatory effect of the auxiliary subunit on HVA channels. Likewise, the current density-voltage curves (Idensity–V) indicated that GH3 cells overexpressing the recombinant protein showed an increase in the currents at most of the voltages tested (Fig. 5D). Our electrophysiological analysis showed also that there were no changes in the voltage dependence of activation (Fig. 5E) and the kinetics of inactivation during the activating pulse (Fig. 5F). Voltage dependence of channel activation was estimated by generating conductance-voltage (G-V) curves, whereas inactivation kinetics was determined as the percentage of the current at the end of the activating pulse (Irem140).
Given that our results suggest that ELK-1 regulates the expression of the CaVα2δ-1 subunit, we next sought to determine whether the knockdown of the transcription factor could also regulate the functional expression of the HVA channels. We first verified the efficiency of the ELK-1 knockdown in the GH3 cells using Western blot with anti-ELK-1 antibodies (Fig. 6A). Loading controls were monitored with an anti-actin antibody. The results show that the anti-ELK-1 antibody detected an ∼62-kDa protein in the GH3 cells. In parallel assays using an anti-CaVα2δ-1 subunit antibody, a protein of ~150 kDa was also identified. The molecular size of both proteins closely resembles that reported for Elk-1 and CaVα2δ-1, respectively. Interestingly, the analysis of these data shows that ELK-1 knockdown caused a significant decrease (of ~30%) in the levels of the transcription factor and the channel auxiliary subunit (Fig. 6B).
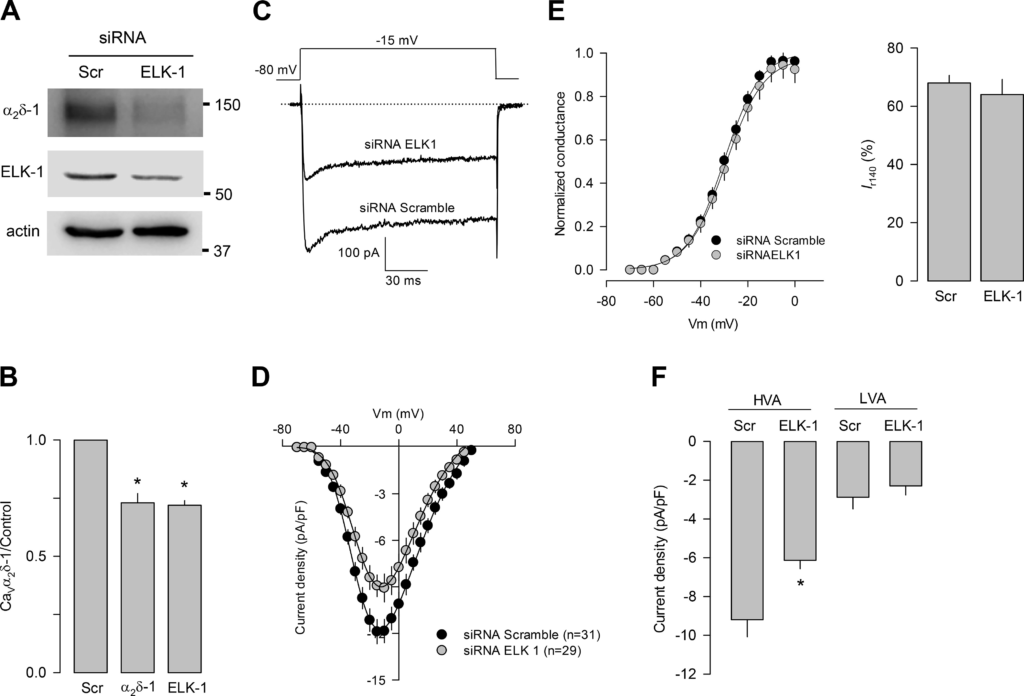
ELK-1 knockdown decreases high voltage-activated (HVA) Ca2+ currents in GH3 cells. A: Western blot showing ELK-1 and CaVα2δ-1 subunit expression in GH3 cells transfected with control [scramble (Scr)] or ELK-1 siRNAs. B: bar chart comparing the average signal for ELK-1 and CaVα2δ-1 subunit, obtained as in A, in 3 separate experiments (CaVα2δ-1: *P < 0.001 t test; Elk-1: *P < 0.001 ttest). C: superimposed Ca2+ channel current traces obtained in cells transfected with control (Scramble) or ELK-1 siRNAs. D: I-V plots for channel currents recorded in GH3 cells transfected as in C. E: comparison of the normalized maximal conductance as a function of voltage (left) and percentage of current remaining at the end of the 140-ms voltage step (Ir140) in cells expressing scramble or ELK-1 siRNAs. F: comparison of the HVA and low voltage-activated (LVA) channel current density in GH3 cells transfected with control (Scr) or ELK-1 siRNAs (*P = 0.019 t test). All data are presented as the means ± SE, and the asterisk denotes statistical significance. Vm, test membrane potential.
We next conducted patch-clamp recordings in control and ELK-1 knockdown GH3 cells. Figure 6C shows representative superimposed current traces in GH3 cells transfected with a scrambled siRNA and with the ELK-1 siRNA. As can be seen, a significant decrease in current amplitude was observed in the cells transiently transfected with the ELK-1 siRNA. The current density-voltage curves (Idensity–V) indicated that the ELK-1 knockdown results in a decrease in the currents at different voltages tested (Fig. 6D), with no apparent changes in the voltage dependence of activation (Fig. 6E, left) and the kinetics of inactivation (Fig. 6E, right). The two components of the total currents were separated, as described above, and the results showed that the ELK-1 knockdown decreased significantly (~30%) the current through HVA channels, without noticeably affecting the LVA component of the current (Fig. 6F). Here, it is worth mentioning that CREB knockdown did not significantly affect the CaVα2δ-1 subunit expression or Ca2+currents in GH3 cells and that overexpression caused actually a slight decrease in Ca2+current density (data not shown).
We next decided to carry out the reciprocal experimental maneuver, that is, to investigate whether the overexpression of ELK-1 increases the amount of CaVα2δ-1 expressed in response to EGF. To this end, GH3 cells were transfected with an HA-ELK-1 cDNA construct, and Western blot assays were performed to assess the expression of the CaVα2δ-1, HA, total ELK-1, and ELK-1 phosphorylated, using specific antibodies (Fig. 7A). Loading controls were monitored with an anti-actin antibody. We first verified the efficiency of the ELK-1 overexpression in the GH3 cells using Western blot analysis with specific anti-ELK-1 antibodies (Fig. 7B, left). In addition, we determined whether the overexpression of ELK-1 increased the expression of the CaVα2δ-1 subunit in response to the EGF treatment. The results showed that the overexpression of the transcription factor indeed increased the expression of CaVα2δ-1 (Fig. 7B, right).
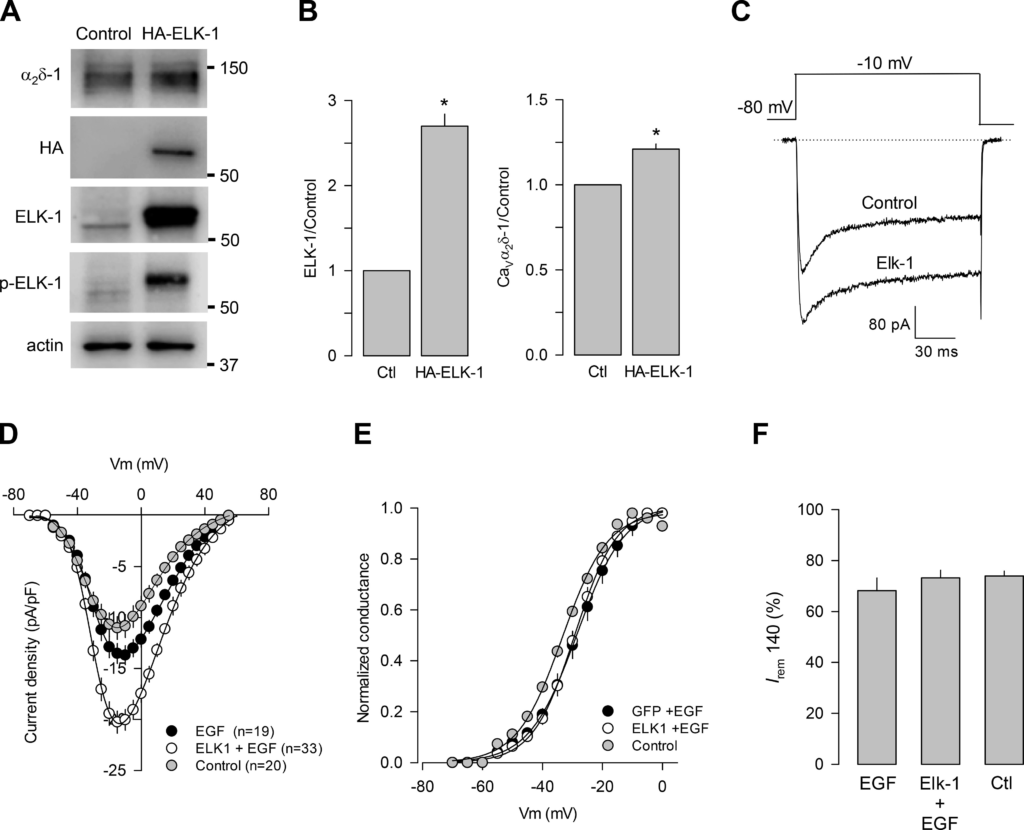
ELK-1 overexpression increases Ca2 + currents in GH3 cells. A: ELK-1 and CaVα2δ-1 subunit expression in GH3 cells transfected with GFP as control or transfected with hemagglutinin (HA)-ELK-1 in the presence of EGF (5 nM; 48 h). B: comparison of the ELK-1 expression levels using anti-HA antibodies (left) and CaVα2δ-1 using anti-CaVα2δ-1-specific antibodies (right) with respect to the control (Ctl) condition (Elk-1: *P < 0.0001 t test; CaVα2δ-1: *P < 0.0001 t test). C: typical Ca2+currents recorded in GH3 cells transfected with GFP as control or with HA-ELK-1 in the presence of EGF (5 nM; 48 h). D: I-V plots for channel currents as in C. E and F: normalized maximal conductance and percentage of remaining current at the end of the 140-ms voltage step (Irem 140), respectively, in GH3 cells in the control condition and after transfection with GFP or HA-ELK-1 in the presence of the growth factor. All data are presented as the means ± SE, and the asterisks denote statistical significance. p-ELK-1, phosphorylated ELK-1.
We also investigated whether ELK-1 overexpression increases Ca2+ currents in GH3 cells in response to EGF by performing electrophysiological recordings using the whole-cell patch-clamp technique. Currents were evoked by applying voltage steps, as mentioned earlier. Figure 7C shows typical superimposed current traces in the control condition and in cells overexpressing the transcription factor. As can be seen, a marked increase in current amplitude was observed in GH3 cells transiently transfected with a plasmid cDNA construct encoding ELK-1. Likewise, the Idensity–V curves indicated that cells overexpressing ELK-1 showed an increase in the currents at different voltages tested (Fig. 7D), and this analysis showed also that there were no changes in the voltage dependence of activation (Fig. 7E) and the kinetics of inactivation (Fig. 7F).
Last, we investigated the possible physiological impact of the EGF treatment on prolactin (PRL) release in control GH3 cells and in cells overexpressing the auxiliary subunit. PRL release, triggered by Ca2+ influx in response to high K+-induced membrane depolarization (extracellular K+ concentration was increased from 5 to 40 mM for 10 min), was significantly increased (~2.3-fold) in EGF-treated cells (Fig. 8A). Likewise, PRL release triggered by depolarization with high K+ was also significantly increased (∼35%) by the CaVα2δ-1 subunit overexpression (Fig. 8B).
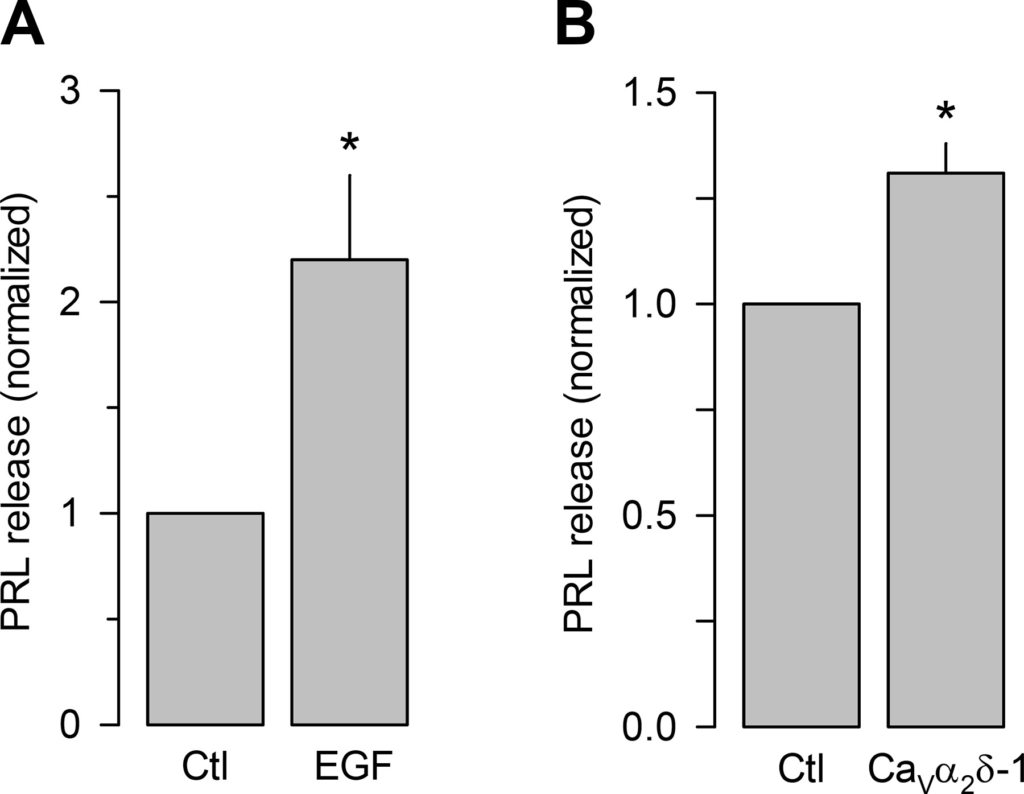
EGF treatment and overexpression of CaVα2δ-1 increase prolactin (PRL) secretion. A: ELISA assays for prolactin (PRL) secreted by GH3 cell cultures in the absence or presence of EGF (5 nM; 48 h; *P = 0.0113 t test). B: ELISA assays for PRL secreted by GH3 cell cultures after transfection with GFP as control or with the CaVα2δ-1 subunit (*P = 0.001 Mann-Whitney rank sum test). Data are presented as the means ± SE, and the asterisks denote statistical significance.
The manipulation of ELK-1 expression should also affect PRL secretion, and our hypothesis predicts that this would occur through its effect on the promoter of the gene encoding the CaVα2δ-1. One possibility to test this hypothesis could be quantifying hormone secretion after ELK-1 knockdown or using an inhibitor of the transcription factor. However, previous studies have reported that activation of the MAPK pathway in response to EGF phosphorylates the estrogen receptor-α (ERα), and this may directly affect the expression and secretion of PRL (4, 8). This would preclude distinguishing whether the possible effect of ELK-1 on PRL occurs through its action on the CaVα2δ-1 promoter or whether this occurs through the ERα. Therefore, we considered it more relevant to study directly and exclusively the role of CaVα2δ-1 overexpression on PRL secretion bypassing the action of the transcription factor on other possible signaling pathways.
DISCUSSION
In the present work, we show evidence supporting the idea that chronic treatment with EGF increases the transcriptional expression of the CaVα2δ-1 subunit and therefore, the membrane location of HVA Ca2+ channels. This increase in channel expression may help explain the changes in current density in response to EGF, previously reported in pituitary GH3 cells (15). In this context, EGF treatment seems to increase the proportion of classical lactotropes (cells that secrete only PRL) in both pituitary primary cell cultures from neonatal rats and the GH3 clonal cell line. The growth factor also significantly enhanced PRL release, suggesting that EGF promotes the differentiation of classical lactotropes, a cell type characterized by a high basal rate of hormone secretion, as previously reported (15). Our data reinforce the idea that EGF could be involved in the transition between different states during the ontogeny of lactotropes in the pituitary gland (15, 24, 25). However, additional studies are required to examine this possibility.
The distinction between the HVA channel subtypes that are regulated through the EGF-mediated pathway is an interesting topic. It is well known that GH3 cells express HVA channels comprised of the CaV1.2, CaV1.3, and CaV2.1 subunits. Because all of them are associated with CaVα2δ-1, it is expected that the activity of all of them would be affected by the increase in the expression of the auxiliary subunit after treatment with EGF. It is also known that the L-type channels (CaV1), in general (29, 32, 42), and the CaV1.3 type, in particular, are expressed in greater abundance in these cells (39). Our data corroborate this, because our Western blot analysis unambiguously shows the expression CaV1.2 and CaV1.3 (as well as CaV2.1), and the position of the current-voltage curves (I-V) on the abscissa axis shows that the activation of the currents reaches its maximum value around −15 mV, an expected value for the activation of CaV1.3 L-type channels, which are considered mid-voltage-activated channels (2, 11, 39). Thus experimental evidence suggests that L-type HVA channels (CaV1.2 and CaV1.3) are preferentially expressed in GH3 cells (29, 39). Hence, although various HVA channels are expressed in GH3 cells, it is reasonable to propose that the number of CaV1.3-type channels might be greater after EGF treatment, as they are the most abundantly expressed in GH3 cells.
The role of HVA CaV channels in the regulation of the stimulus-secretion coupling is widely documented in PRL-secreting cells. Long-term treatment of rat pituitary tumor cells with EGF increases HVA channel functional expression, intracellular Ca2+, and subsequent PRL secretion in response to membrane depolarization (15, 32, 43). In addition, it is known that EGF and thyrotropin-releasing hormone (TRH) stimulate PRL gene expression (5), although the activation of HVA channels is necessary for hormone release (12, 20). In this way, the growth factor could be exerting a dual effect on the secretory behavior of lactotropes; on the one hand, it would stimulate the production of PRL, and on the other hand, it would be favoring the synthesis of the proteins involved in its release. However, it is worth mentioning here that there is evidence indicating that EGF might be actually reducing the Ca2+ intracellular transients and PRL secretion in clonal pituitary cells in response to membrane depolarization high K+ (17, 22), suggesting that EGF may regulate channel activity and Ca2+ homeostasis in a complex manner, although the mechanisms of these actions have yet to be fully determined.
EGF exerts its actions by binding to a family of receptors (EGFR/ErbB) consisting of four members, named ErbB1–ErbB4. The binding of the growth factor to its receptor leads to the formation of an activated ErbB dimer, which exhibits autophosphorylation. Phosphorylated ErbB may activate several cell signaling pathways, including the ERK and Akt cascades, and rapidly alters gene expression (47). Therefore, we next sought to determine the molecular mechanism by which EGF regulates the expression of the CaVα2δ-1 subunit of HVA channels. We found that the transcription factor ELK-1 knockdown efficiently prevented the EGF-induced activation of the CaVα2δ-1 subunit gene promoter, suggesting a role for the ERK/ELK-1 signaling cascade to the molecular mechanism of the growth factor.
Interestingly, the use of siRNAs against the transcription factor CREB also prevented the EGF-induced activation of the CaVα2δ-1 gene promoter; however, the CaVα2δ-1 promoter construct, harboring a mutation in the CREB consensus-binding site, showed full responsiveness to EGF. Although the reason for this discrepancy is presently unknown, it may lie in the fact that the CREB knockdown may be indirectly affecting the activation of the CaVα2δ-1 gene promoter. Previous in silico characterization of the 5′ upstream region of the CACNA2D1 gene promoter revealed that it is a TATA box-less promoter, having a guanine-cytosine (GC)-rich region (30). It is well known that GC-rich regions act as major anchors for the transcriptional machinery and often function as important regions in gene transcription. Simultaneously, GC-rich regions are elements present in many promoters and enhancers and may contain binding sites for transcription factor specificity protein 1 (Sp1). Interestingly, it has been reported that Sp1 can regulate the activity of the gene promoter and in consequence, the endogenous expression of the CaVα2δ-1 subunit in SH-SY5Y human neuroblastoma cells and in dorsal root ganglion (DRG) sensory neurons (19, 30).
On the other hand, in a recent report, it has been found that CREB, bound to a distal region of the oncostatin-M gene promoter, can interact with Sp1 bound in a proximal region via an intermediary protein or coactivator, called p300 (33). This finding is remarkable, as it establishes a long-range interaction between two transcription factors mediated by a mutual coactivator. Based on these data, it is reasonable to speculate that CREB silencing could be interfering with the activity of the Sp1 transcription factor during activation of the CaVα2δ-1 gene promoter. Hence, Sp1 bound to the promoter would not find enough CREB bound to DNA and could therefore be less effective in activating CaVα2δ-1 gene transcription. Undoubtedly, this could be an interesting topic for future studies.
It has been shown also that CREB may induce gene transcription in response to mitogen or stress signals. The ability of CREB to differentiate between cAMP and these signals is not clear, but it has been proposed that the coactivators CREB-binding protein (CBP) and p300 may play a role in this signaling process. Interestingly, other transcription factors, such as Sp1 and Elk-1, also bind to CBP and p300 as coactivators. Hence, CREB may be contributing indirectly to CACNA2D1 gene transcription in response to EGF via its interaction with CBP and p300, as well as other transcription factors, such as Sp1 and Elk-1 (23, 28, 31). In addition, it has been reported that the transcription of the c-Fos gene, which has binding sites for Elk-1 and CREB in its promoter region, is highly cooperative. The transcription factors and their regulatory elements form a transcription complex that varies between cell types and may respond in different ways to regulatory signals in vivo. Therefore, the absence of one element of this complex may affect indirectly the activation of transcription (36).
Last, our electrophysiological studies also demonstrate the functional relevance of the ELK-1 transcription factor in determining the expression of CaVα2δ-1 and in consequence, the surface localization of HVA channels in the GH3 cell line. Likewise, our secretion assays showed the impact of the increase in CaVα2δ-1 expression by EGF on prolactin release in GH3 cell cultures.
In conclusion, our results suggest a mechanism for how EGF, by activating the Ras/Raf/MEK/ERK/ELK-1 signaling pathway, increases the expression and plasma membrane localization of the CaVα2δ-1 auxiliary subunit in GH3 cells. CaVα2δ-1 increase by EGF treatment may influence the functional expression of HVA CaVchannels at the plasma membrane, and this effect may result in enhanced PRL secretion in pituitary GH3 cells.