
Reduced excitatory neuron activity and interneuron-type-specific deficits in a mouse model of Alzheimer’s disease

By Moustafa Algamal, Alyssa N. Russ, Morgan R. Miller, Steven S. Hou, Megi Maci, Leon P. Munting, Qiuchen Zhao, Dmitry Gerashchenko, Brian J. Bacskai, and Ksenia V. Kastanenka
Excerpt from the article published in Communications Biology 5, 1323, 02 December 2022. DOI: https://doi.org/10.1038/s42003-022-04268-x
Editor’s Highlights
- The function of specific interneuronal cell types is impaired in Alzheimer’s disease (AD).
- The amyloid-beta accumulation affects on the spontaneous activity of distinct neuronal populations within cortical layers 2/3.
- Somatostatin-expressing (SOM) interneurons are hyperactive near amyloid plaques.
- Parvalbumin (PV)-expressing interneurons are hypoactive irrespective of their proximity to amyloid plaques.
- The hyperactivity of SOM interneurons correlating with proximity to amyloid plaques can potentially drive this dyshomeostasis since they supply aberrant inhibition to layer 2/3 pyramidal cells.
- While inhibitory circuit deficits are prevalent in AD, it is not clear whether a therapeutic strategy that broadly restores inhibitory tone, using GABA agonists or antagonists, would benefit early-stage to intermediate-stage AD patients.
- A more targeted approach to restoring inhibitory tone will be needed to overcome these network deficits since interneuron cell types were differentially affected by AD pathology.
Abstract
Alzheimer’s disease (AD) is characterized by progressive memory loss and cognitive decline. These impairments correlate with early alterations in neuronal network activity in AD patients. Disruptions in the activity of individual neurons have been reported in mouse models of amyloidosis. However, the impact of amyloid pathology on the spontaneous activity of distinct neuronal types remains unexplored in vivo. Here we use in vivo calcium imaging with multiphoton microscopy to monitor and compare the activity of excitatory and two types of inhibitory interneurons in the cortices of APP/PS1 and control mice under isoflurane anesthesia. We also determine the relationship between amyloid accumulation and the deficits in spontaneous activity in APP/PS1 mice. We show that somatostatin-expressing (SOM) interneurons are hyperactive, while parvalbumin-expressing interneurons are hypoactive in APP/PS1 mice. Only SOM interneuron hyperactivity correlated with proximity to amyloid plaque. These inhibitory deficits were accompanied by decreased excitatory neuron activity in APP/PS1 mice. Our study identifies cell-specific neuronal firing deficits in APP/PS1 mice driven by amyloid pathology. These findings highlight the importance of addressing the complexity of neuron-specific deficits to ameliorate circuit dysfunction in Alzheimer’s disease.
Introduction
Alzheimer’s disease (AD) is the most common form of dementia and the most prevalent neurodegenerative disorder in the United States1. The primary pathological hallmarks of Alzheimer’s disease include deposits of extracellular amyloid plaques as well as intracellular tau tangles, and eventually neuronal death2,3. Notably, the accumulation of amyloid-beta peptides is associated with aberrant neuronal activity and oscillatory network alterations in AD patients4 and in animal models5,6,7,8. Particularly, deficits in cognition-linked brain rhythms such as gamma and slow waves are prevalent in AD patients9,10. These neuronal activity alterations appear at the early stages of AD and correlate with the severity of cognitive impairment in AD patients11,12. Oscillatory brain rhythms are generated by complex firing patterns of individual neurons and interactions between neuronal populations across different brain regions13,14,15. Thus, there is an urgent need to understand the single-cell neuronal activity patterns in AD to restore the impaired oscillatory brain rhythms and improve cognitive function.
Several studies have assessed single-cell neuronal activity in amyloidosis mouse models in ex-vivo brain slices16,17,18,19 and in vivo5,20,21. While ex-vivo studies have monitored cell-type-specific neuronal activity, in vivo studies did not discriminate between neuronal subtypes and mainly reported the activity of excitatory neurons, which represent 80–90% of cortical neurons22. These reports have provided mixed findings of aberrant neuronal hyperactivity5,6 and hypoactivity5,21.
In addition to excitatory cells, ~10–20% of cortical neurons are inhibitory interneurons that display a wide variety of morphological and electrophysiological properties22,23,24,25. Despite constituting a small percentage, interneurons play an essential role in cortical computations and the maintenance of spontaneous network oscillations24. Interneurons are classified based on their protein expression profiles into distinct subtypes including somatostatin (SOM)- and parvalbumin (PV)-expressing interneurons, as well as others26. SOM and PV interneurons shape excitatory activity by targeting different cellular compartments of pyramidal cells24.
The function of specific interneuronal cell types is impaired in AD27,28. Particularly, PV interneuron dysfunction received considerable attention because of its role in gamma oscillatory activity27,29. For instance, hypoactivity17,18,29,30,31,32 and hyperactivity19 of PV interneurons were reported in several AD mouse models of amyloidosis. The firing activity of SOM interneurons in AD mouse models remains unexplored, but impairments in synaptic rewiring of hippocampal SOM interneurons was reported28. These cell-type-specific dysfunctions disrupt the well-regulated excitation and inhibition (E/I) balance resulting in broader, circuit-level dysfunction in AD27. Whether all interneuronal types are affected similarly in AD and whether their function is directly affected by amyloid plaques remains unclear.
During action potential firing, calcium ions (Ca2+) enter neurons through voltage gated calcium channels resulting in intracellular Ca2+ concentration changes33. As result, calcium imaging has been widely used as a proxy of neuronal action potential firing20,34,35.
Here, we determined the effect of amyloid-beta accumulation on the spontaneous activity of three distinct neuronal populations within cortical layers 2/3. To this end, we monitored the activity of excitatory neurons and two major classes of inhibitory interneurons, PV and SOM, in anesthetized APP/PS1 mice and non-transgenic littermates (WT) using the genetically encoded calcium indicator GCaMP.
We show that SOM interneurons are hyperactive, while PV and excitatory neurons are hypoactive in APP/PS1 mice. Furthermore, SOM interneurons located near amyloid plaques are more active than those located farther away. Finally, pairwise neuronal correlations of excitatory neurons show a strong trend for a decrease in APP/PS1 mice.
Results
SOM interneurons are hyperactive near amyloid plaques in APP/PS1 mice
The impact of AD on inhibitory interneuron cell-type-specific spontaneous activity is not well understood, with cortical SOM interneuron activity totally unexplored in vivo. Here, we performed in vivo multiphoton calcium imaging in anesthetized APP/PS1 (APP) mice and non-transgenic littermates (WT), to study cell-type-specific spontaneous neuronal activity.
We first monitored calcium transients in the somas of SOM interneurons using the genetically encoded calcium indicator jGCaMP7s (Fig. 1a). To target SOM interneurons selectively, we injected FLEX-jGCAMP7s into the somatosensory cortex of WT-SOM and APP-SOM mice (Fig. 1a). SOM interneurons exhibited spontaneous calcium transients in WT-SOM (Fig. 1b) and WT-APP (Fig. 1c) mice. We then estimated the number of deconvolved calcium events as a proxy measure for neuronal action potential firing (Supplementary Figure 1, Supplementary Movie 1). Due to the slower timescale of calcium indicator responses relative to action potential-related voltage changes, deconvolution of the calcium signal to the best estimate of spiking activity is required33,34. Several calcium deconvolution algorithms have been developed to address this non-trivial issue36,37,38,39. We chose to use a non-negative deconvolution algorithm39,40 to estimate the timing and the number of deconvolved calcium events in our recordings because it outperformed all other algorithms in a dataset of mutual calcium imaging and ground-truth electrophysiology recordings41. Our results show that SOM interneuron event rates were 2.7-fold higher in APP-SOM mice relative to WT-SOM mice (Fig. 1d, e). The fraction of inactive SOM cells was not different between conditions (Fig. 1f). Thus, SOM interneurons are hyperactive in APP/PS1 mice.
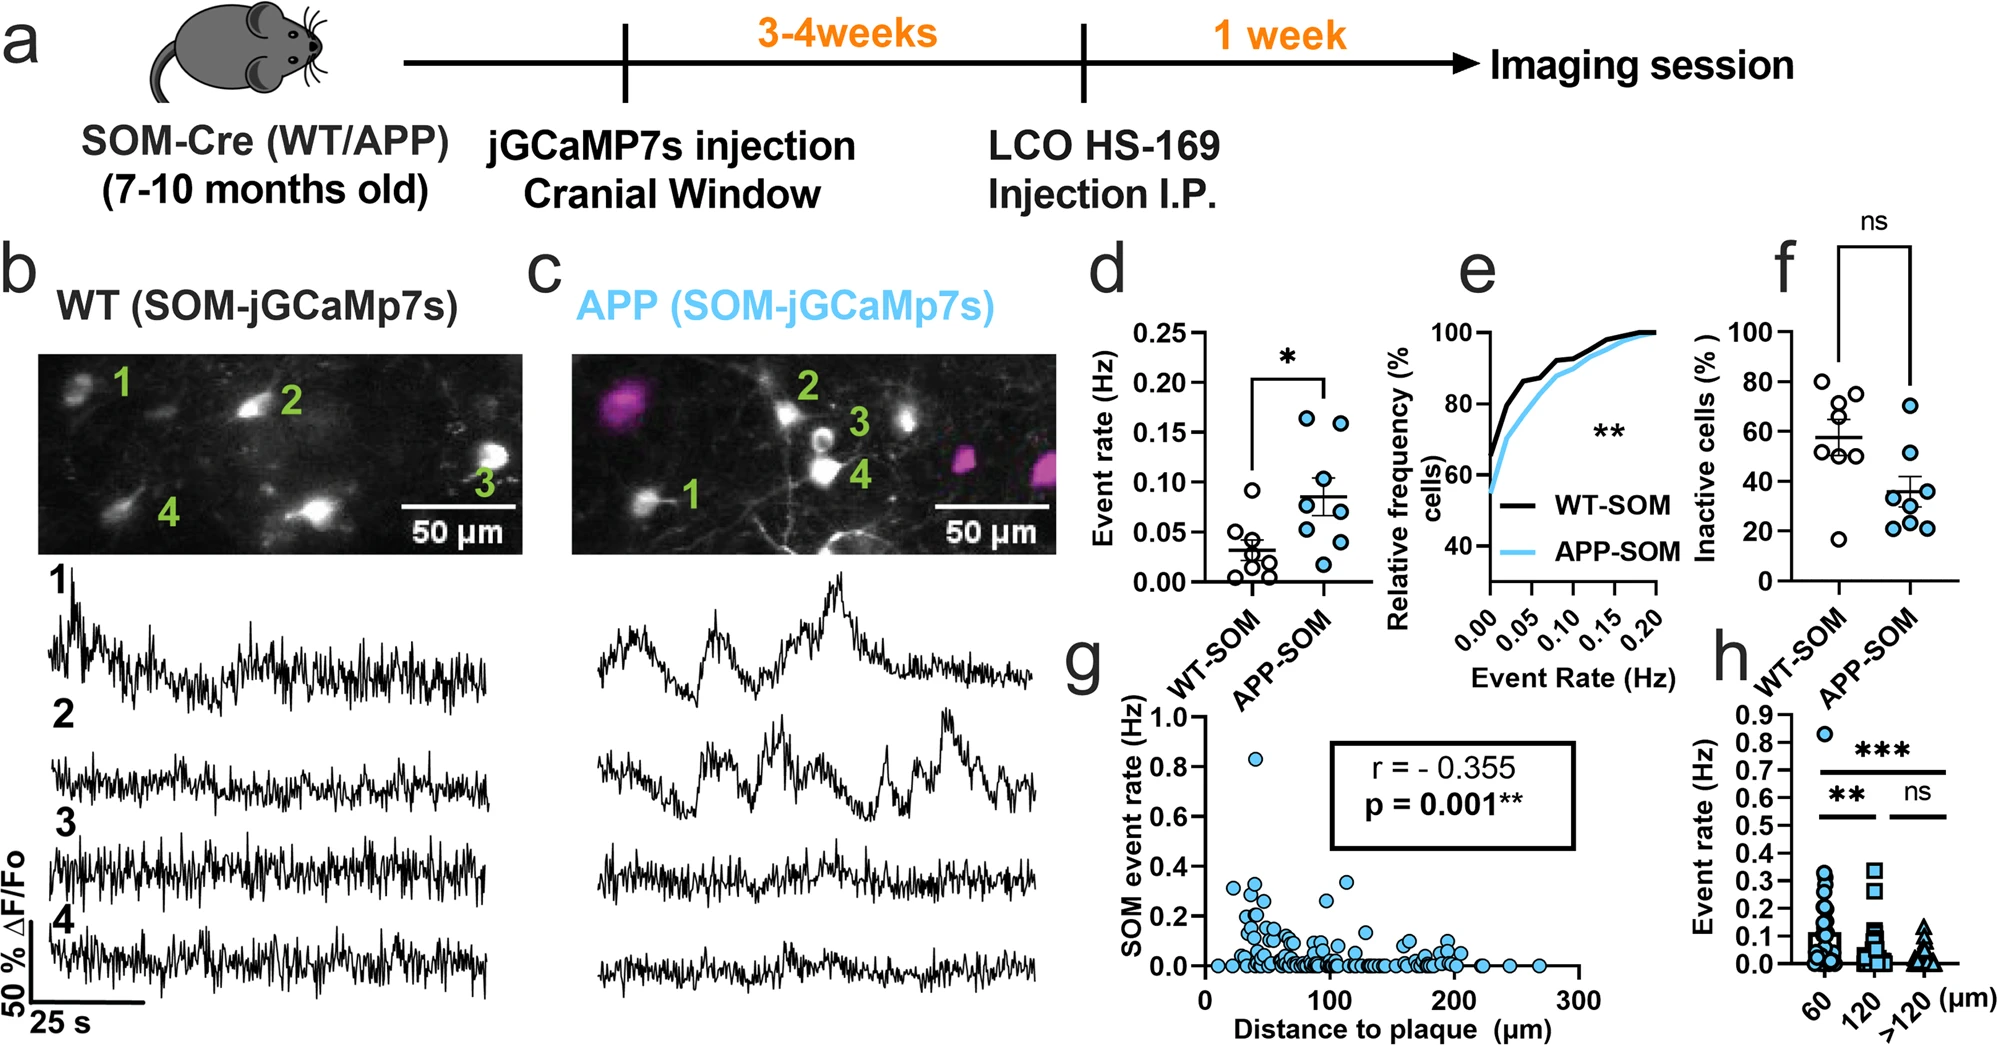
SOM interneurons are hyperactive in APP/PS1 mice relative to WT mice.
a Timeline of the experimental procedures. b, c Top, in vivo two-photon fluorescence images of jGCaMP7s (grey) in SOM expressing interneurons in layer 2/3 of the somatosensory cortex from WT (b) and APP/PS1 (c) mice. Amyloid plaques were labeled with LCO-HS-169 (magenta); Scale bars, 50 μm. Bottom, representative normalized fluorescence traces of SOM interneurons activity from control (b) and APP/PS1 (c) mice. Representative images were created by averaging 500 images from SOM interneuron recordings at 256×256 resolution with green numerical labels to the right of each representative cell. d Mean neuronal activity rates as determined by counting the rate of deconvolved Ca+2 events (Mann–Whitney U = 11, p = 0.024, two-tailed, n = 8 WT-SOM mice; 8 APP-SOM mice). e Cumulative frequency distribution of event rates in all imaged neurons (KS-test:D = 0.152, p = 0.0044, n = 210 WT-SOM neurons; 364 APP-SOM neurons). f Quantification of the fraction of inactive cells in APP-SOM mice relative to WT_SOM (Mann–Whitney U = 14, p = 0.06, two-tailed, n = 8 WT-SOM mice; 8 APP-SOM mice). g Correlations between event rates and the distance to amyloid plaque center in SOM interneurons (Spearman correlation: r(124) = −0.355, p < 0.0001. h Quantification of pooled event rates as a function of distance to amyloid plaque. Neurons were pooled into three groups depending on their distance to amyloid plaque: <60 µm, 60–120 µm, and >120 µm (Kruskal–Wallis test, H(2) = 18.41, p < 0.0001). Post hoc multiple comparisons were p = 0.0028 for SOM event rates <60 µm vs. SOM < 120 µm and p = 0.0001 for SOM event rates <60 µm vs. rates >120 µm and not significant, p = 0.715, for SOM event rates <120 µm vs. rates >120 µm. Each solid circle in d, f represents an individual animal, while each circle in g, hrepresents an individual neuron. All error bars reflect the mean ± s.e.m. Asterisks denote statistically significant differences (**p < 0.01, ****p < 0.0001), while ‘ns’ denotes no significance p > 0.05.
Studies examining spontaneous activity in indiscriminate neuronal populations in vivo have shown that neurons near amyloid plaques at distances less than 60 µm are more active than those farther away5. Therefore, to understand the relationship between amyloid plaques and the observed hyperactivity, we measured the correlation between SOM interneuron event rates and distance to amyloid plaques in APP/PS1 mice. We found a significant negative correlation between SOM interneuron activity and distance to amyloid plaques in APP/PS1 mice (Fig. 1g). SOM interneurons near amyloid plaques (<60 µm) were more active compared to those located away from plaques (Fig. 1h). Therefore, SOM interneuron hyperactivity is correlated with proximity to amyloid plaques.
Postmortem immunohistochemical analysis of WT-SOM mice confirmed that ~90% of jGCaMP7s cells were positive for SOM (Supplementary Fig. 2a, b), thus jGCaMP7s targeted SOM interneurons with high selectivity.
PV interneurons are hypoactive in APP/PS1 mice
We then asked whether the spontaneous hyperactivity in the somatosensory cortex can be generalized to other interneuron subtypes in APP/PS1 mice in vivo. PV interneurons have markedly different electrophysiological properties relative to SOM interneurons as they can reach very high firing rates42. Hence, we next used similar experimental procedures (Fig. 2a) and targeted jGCaMP7s expression to PV interneurons in the somatosensory cortex of WT-PV-Cre (WT-PV) (Fig. 2b) and APP-PV-Cre (APP-PV) mice (Fig. 2c). Mean event rates were 5.6-fold higher in WT-PV interneurons (Fig. 2d, Supplementary Movie 2, and Supplementary Fig. 3) relative to WT-SOM interneurons (Fig. 1d; mean ± s.e.m.: 0.18 ± 0.03 for PV interneurons, and 0.032 ± 0.01 for SOM interneurons). Contrary to our findings in SOM interneurons, PV interneurons showed a 1.8-fold decrease in event rates in APP-PV mice relative to WT-PV mice (Figs. 2d, e). The fraction of inactive PV cells was comparable across conditions (Fig. 2f). PV interneuron activity did not correlate with proximity to amyloid plaques (Fig. 2g, h). Therefore, PV interneurons are hypoactive in APP/PS1 mice irrespective of their proximity to amyloid plaques. These results suggest a cell-type-specific disruption in cortical interneuron activity of APP/PS1 mice.
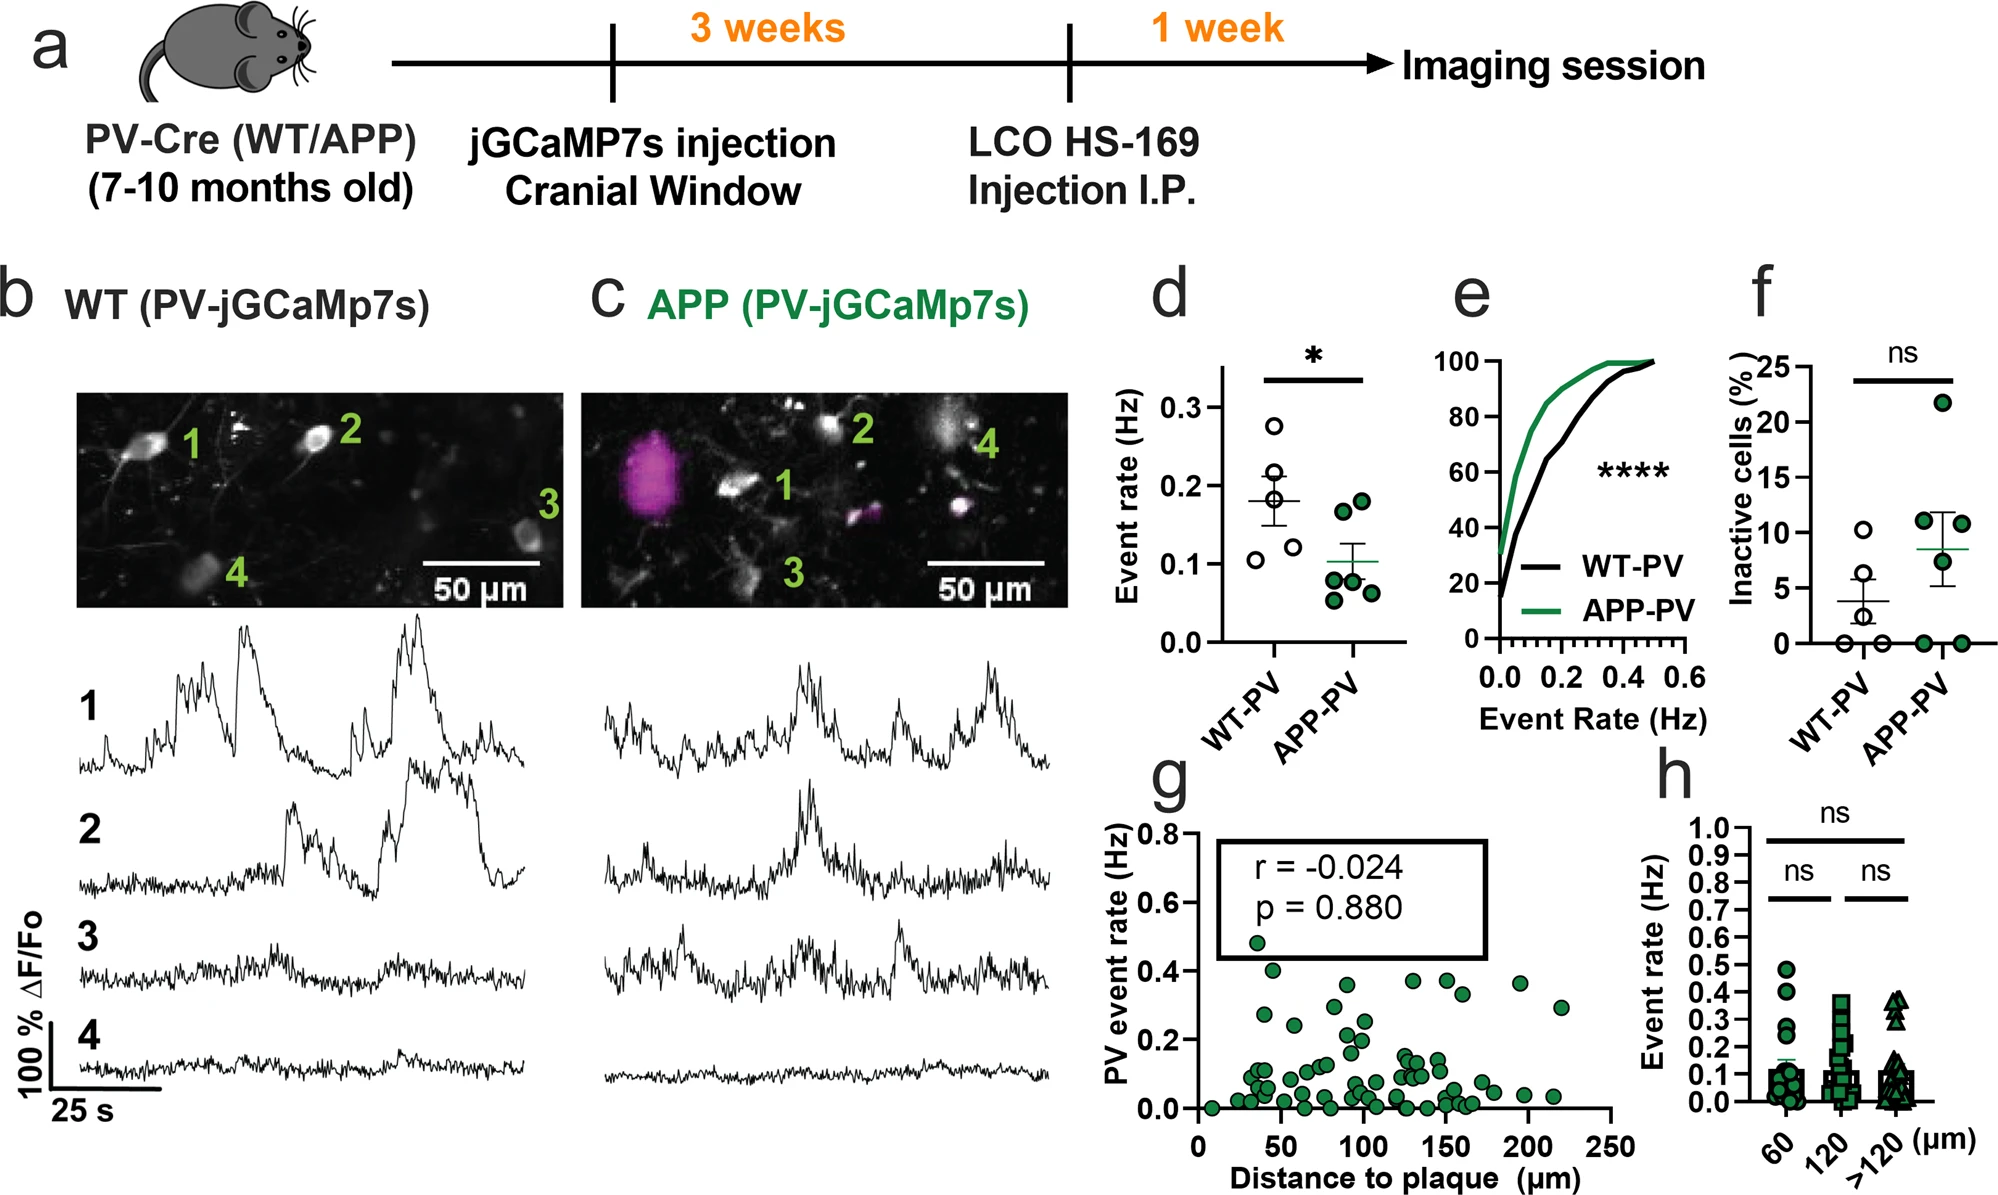
PV interneurons are hypoactive in APP/PS1 mice relative to WT mice.
a Timeline of the experimental procedures. b, c Top, in vivo two-photon fluorescence images of jGCaMP7s in PV expressing interneurons (grey) in layer 2/3 of the somatosensory cortex from WT (b) and APP/PS1 (c) mice. Amyloid plaques were labeled with LCO- HS-169 (magenta); Scale bars, 50 μm. Bottom, representative normalized fluorescence traces from control (b) and APP/PS1 (c) mice. Representative images were created by averaging 500 images from PV interneuron recordings at 256×256 resolution with green numerical labels to the right of each representative cell. d Mean event rates (Mann–Whitney U = 4, p = 0.051, two-tailed, n = 5 WT-PV mice; 6 APP-PV mice). e Cumulative frequency distribution of event rates in all imaged neurons (KS-test:D = 0.268, p < 0.0001, n = 254 WT-PV neurons; 172 APP-PV neurons). f Quantification of the fraction of inactive cells (Mann–Whitney U = 4, p = 0.28, two-tailed) in imaged WT-PV and APP-PV (n = 5 WT mice; 6 APP/PS1 mice). g Correlations between event rates and the distance to amyloid plaque center in PV interneurons (Spearman correlation: r(63) = −0.024, p = 0.88), and h quantification of pooled PV event rates as a function of amyloid plaque distance (Kruskal–Wallis test, H(2) = 0.46, p < 0.79). Each solid circle in d–f represents an individual animal, while each circle in g, h represents an individual neuron. All error bars reflect the mean ± s.e.m. Asterisks denote statistically significant differences (*p < 0.05, ****p < 0.0001), while ‘ns’ denotes no significance p > 0.05.
Postmortem immunohistochemical analysis of PV-Cre mice confirmed that 86% of jGCaMP7s cells were positive for PV (Supplementary Fig. 2c, d).
Excitatory neurons are hypoactive in APP/PS1 mice
The disrupted interneuronal activity of APP/PS1 mice prompted us to investigate whether this deficit is related to E/I imbalance. SOM and PV interneurons form inhibitory synaptic contacts onto excitatory neurons, therefore dominant hypoactivity in either or both interneuron subtypes can potentially result in hyperactivity of excitatory cells. Because of the numerous reports of hyperactive cells in APP/PS1 mice in vivo, we hypothesized that excitatory cells are hyperactive as a result of dominant hypoactivity in PV interneurons. To test this hypothesis, we imaged spontaneous activity of layer 2/3 excitatory neurons of the somatosensory cortex in WT (WT-EX) and APP/PS1 (APP-EX) mice. We targeted excitatory neurons using a human CaMKIIα promoter to drive the expression of GCaMP6s (Fig. 3a–c). These recordings were performed on a combination of SOM-and PV-Cre mice to ensure comparability to interneuron recordings (see methods). In contrast to our hypothesis, excitatory neurons of APP-EX mice showed 1.6-fold lower event rates (Fig. 3d and Supplementary Movie 3) relative to WT-EX mice, with an overall lower cumulative distribution of event rates across all recorded cells (Fig. 3e). Mean event rates of excitatory cells were stable over 2 to 3 months (Supplementary Fig. 4) and did not depend on sex or mouse model (Supplementary Fig. 5). No significant change in the fractions of inactive excitatory cells (Fig. 3f) was observed. Excitatory neuron activity did not depend on amyloid plaque distance (Fig. 3g, h and Supplementary Movie 4). Therefore, cortical excitatory neurons are hypoactive in APP/PS1 mice irrespective of their proximity to amyloid plaques. To confirm that the cell-type-specific findings reported here are not driven by the analysis method, we reanalyzed the normalized fluorescence traces for all cell types using peak counting5,43. Peak counting showed similar results compared to non-negative deconvolution for excitatory and SOM interneurons (Supplementary Fig. 6). Although PV interneuron activity was not significantly different between groups using peak counting (Supplementary Fig. 6c), the cumulative frequency distribution of event rates was different in PV-APP interneurons relative to PV-WT interneurons (Supplementary Fig. 6d). In summary, while the analysis method has a minimal effect on most of our findings, PV interneuron results are limited and should be interpreted cautiously.
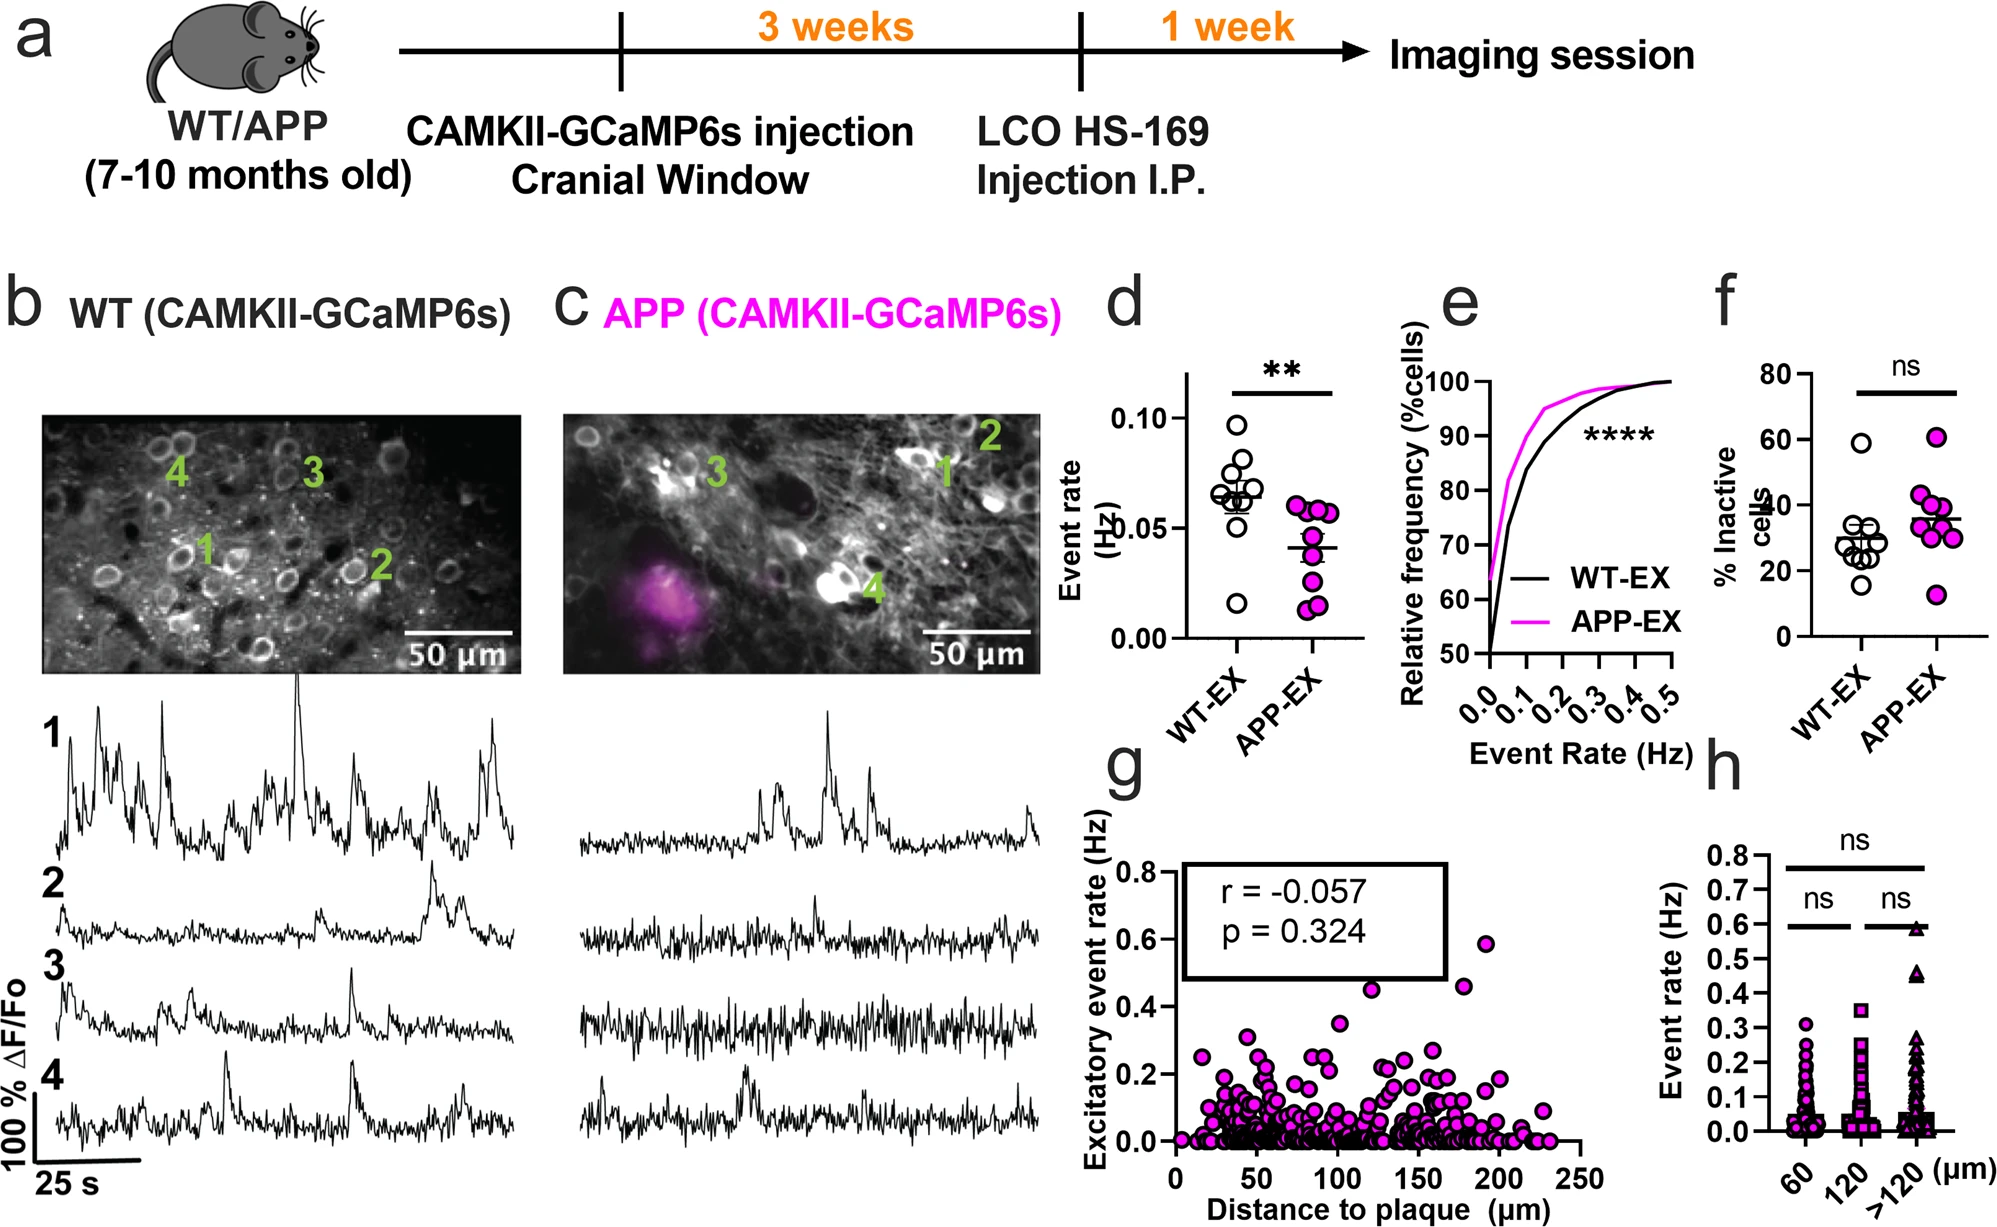
Excitatory neurons are hypoactive in APP/PS1 mice.
a Timeline of the experimental procedures. b, c Top, in vivo two-photon fluorescence images of GCaMP6s in CaMKII expressing (excitatory) neurons (grey) in layer 2/3 of the somatosensory cortex from non-transgenic controls (b) and APP/PS1 (c) mice. Amyloid plaques were labeled with LCO- HS-169 (magenta); Scale bars, 50 μm. Bottom, representative normalized fluorescence traces from control (b) and APP/PS1 (c) mice. Representative images were created by averaging 500 images from excitatory neuron recordings at 256×256 resolution with green numerical labels to the right of each representative cell. d Mean neuronal activity rates as determined by counting the rate of deconvolved Ca+2 events (Mann–Whitney U = 11, p = 0.0078, two-tailed, n = 9 WT-EX mice; 9 APP-EX mice). e Cumulative frequency distribution of event rates in all imaged neurons (KS-test:D = 0.129, p < 0.0001, n = 1412 WT-EX neurons; 1603 neuron APP-EX neurons). f Quantification of the fraction of inactive cells (Mann–Whitney U = 23, p = 0.136, two-tailed) in imaged WT-EX and APP-EX (n = 9 WT-EX mice; 9 APP-EX mice). g Correlations between event rates and the distance to amyloid plaque center in excitatory neurons (Spearman correlation: r(298) = −0.057, p = 0.324), and h quantification of pooled excitatory neurons event rates as a function of amyloid plaque distance (Kruskal-Wallis test, H(2) = 0.46, p < 0.79). Each solid circle in d–f represents an individual animal, while each circle in g–h represents an individual neuron. All error bars reflect the mean ± s.e.m. Asterisks denote statistically significant differences (*p < 0.05, ****p < 0.0001), while ‘ns’ denotes no significance p > 0.05.
Pairwise neuronal correlations in APP/PS1 mice
To evaluate the impact of amyloid accumulation on the activity synchrony of different cell types, we calculated the Pearson correlation values (ρ) for all possible pairwise combinations of active neurons within the somatosensory cortex. Mean correlation values showed a trend for a decrease in APP-EX relative to WT-EX mice (Fig. 4a and Supplementary Figs. 7a and 8). It is established that neuronal synchrony decreases as the distance between neurons increases44. Therefore, we determined the relationship between correlation values and pairwise distance between neurons (Fig. 4b). As expected, correlation values decreased as a function of increased inter-neuronal distance, a phenomenon that seemed to be similar in WT-EX and APP-EX mice (Fig. 4b and Supplementary Fig. 7b). Since correlations are known to increase when neuronal event rates increase45, we also examined the relationship between mean correlations of a given neuron and its event rate. Excitatory neuronal ρ values increased as function of neuronal event rates (Fig. 4c, and Supplementary Fig, 7c). These observations did not significantly differ in WT-EX and APP-EX mice (Fig. 4c and Supplementary Fig. 7c), suggesting that the decreased correlation values in APP-EX mice are related to decreased event rates and not synchrony. We calculated significantly fewer pairwise correlations for interneurons relative to excitatory cells because only a few cells could be recorded in each imaging frame. Nevertheless, there was no significant change in correlation values for SOM and PV interneurons in APP/PS1 mice relative to WT (Fig. 4d, e and Supplementary Fig. 7d, e).
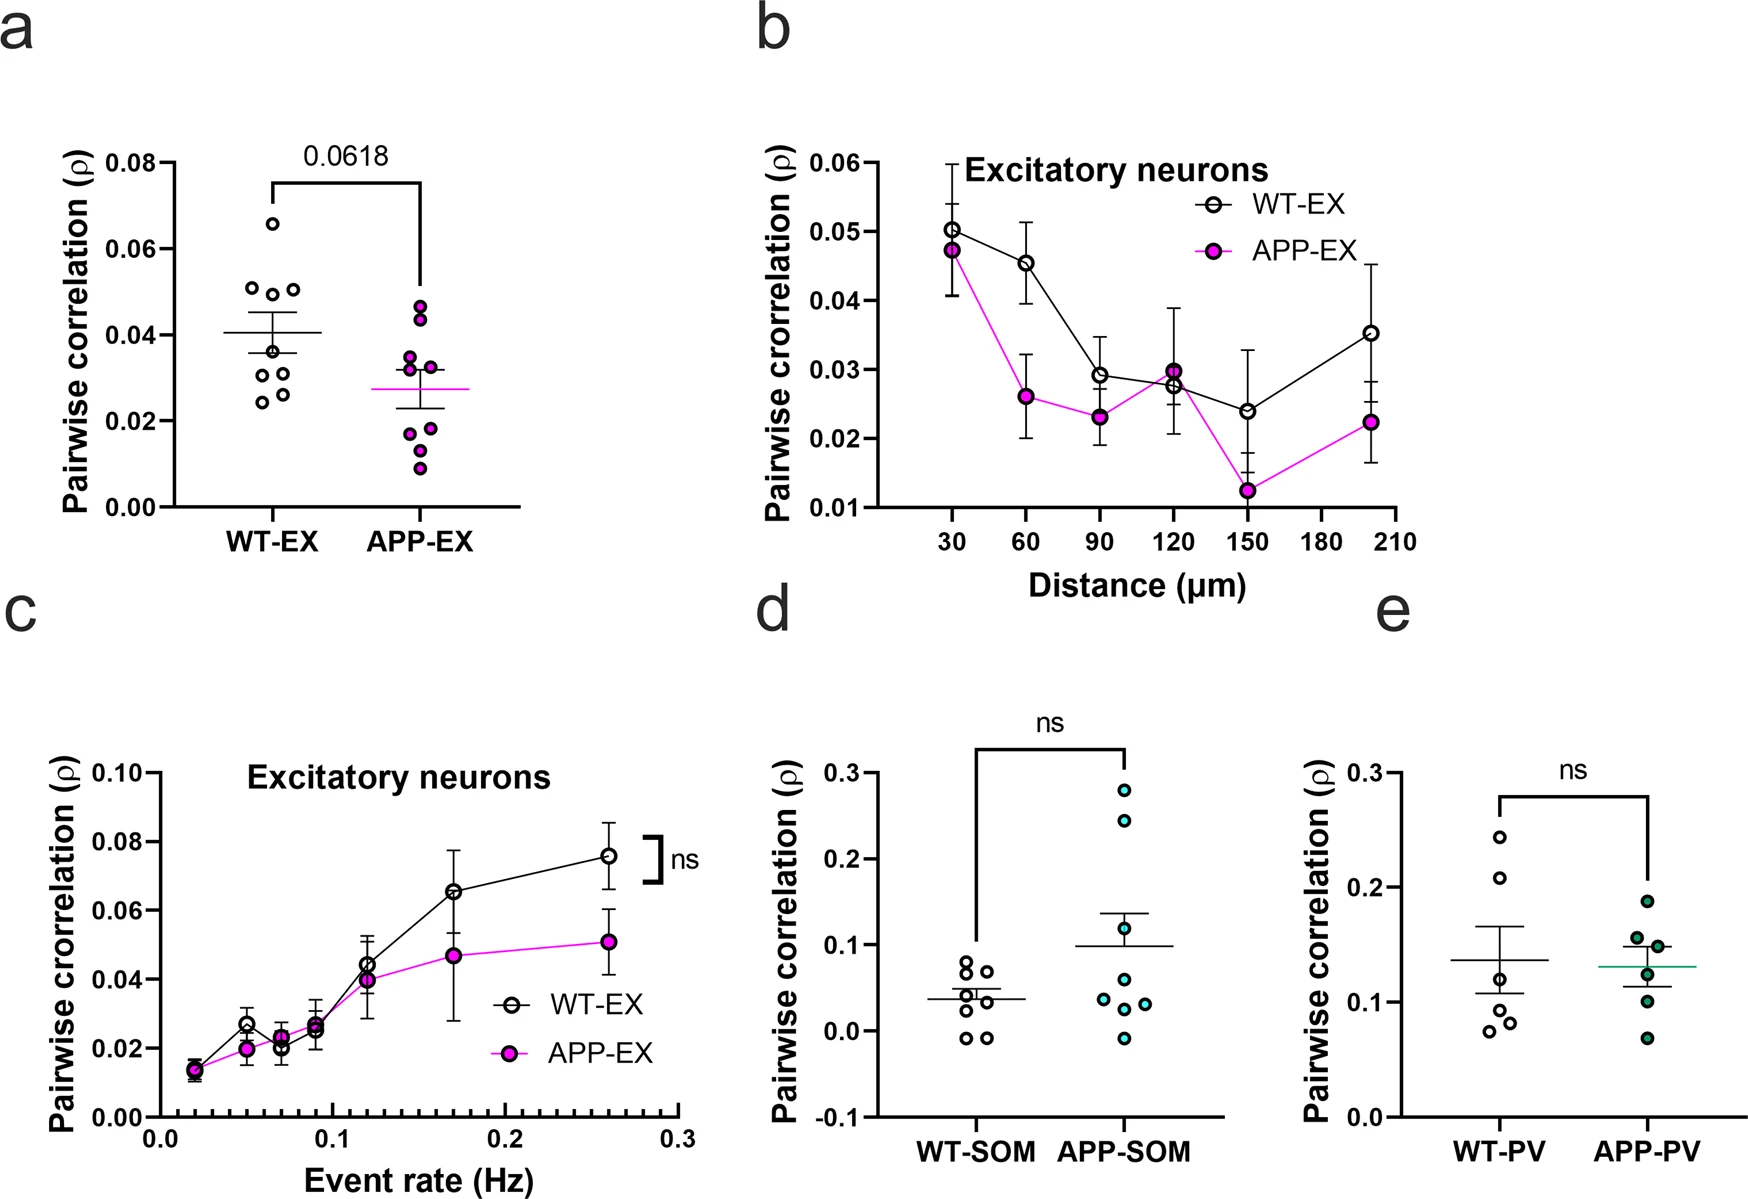
Pairwise neuronal correlations in APP/PS1 mice.
a Average pairwise Pearson correlation values for excitatory neurons in APP/PS1 and WT mice (t(16) = 2.008, n = 9WT-EX mice, n = 9 APP-EX mice, p < 0.062, two-tailed). b Relationship between pooled pairwise Pearson correlation values and pairwise interneuronal distance (Two-Way ANOVA, main distance effect F(5, 87) = 4.5, p = <0.001, main genotype effect F(1, 87) = 4.38, p = 0.039, main genotype and distance interaction F(5, 87) = 0.62, p = 0.682). The x axis values represent the maximum limit of the pooled pairwise distances. c Relationship between correlation values and event rates after pooling data according to geometric means of neuronal event rates (two-way ANOVA, main event rate effect F(6,107) = 9.7, p < 0.0001, main genotype effect F(1, 107) = 24, p = 0.1223, main genotype and event rate interaction F(6, 107) = 0.7, p = 0.58). d, e Average pairwise Pearson correlation values for SOM interneurons (d) (t(14) = 1.54, n = 8 WT-SOM mice, n = 8 APP-SOM mice, p = 0.147, two-tailed) and PV interneurons (e) (t(10) = 0.16, n = 6 WT-PV mice, n = 6 APP-PV mice, p = 0.95, two-tailed) in APP/PS1 and WT mice. All error bars reflect the mean ± s.e.m.
Discussion
Altered neuronal network activity in AD has been observed in several cerebral amyloidosis mouse models and AD patients5,6,11,12,20,29,46,47. Recent reports suggest that inhibitory circuits are particularly vulnerable, resulting in E/I imbalance and circuit-level dysfunction in AD19,29,48,49. However, the exact nature of the disrupted inhibitory activity is not yet fully understood in vivo. We report cell-type-specific interneuron dysfunction during spontaneous activity recorded in vivo in APP/PS1 mice. SOM interneurons were hyperactive while PV interneurons were hypoactive. Additionally, the changes in SOM interneuron activity, but not PV activity, correlated with proximity to amyloid plaques. These inhibitory deficits were accompanied by a decrease in excitatory neuronal activity, thus providing a detailed picture of the nature of E/I imbalance in the APP/PS1 mouse model.
Our finding of decreased excitatory neuronal activity in APP/PS1 mice may appear to conflict with reports of hyperactivity in amyloidosis models5,20,50. This discrepancy could be related to differences in animal model strains. Amyloidosis models such as APP/PS1 mice on C57BL/6J background20 exhibit seizures51. Genetic background is known to influence susceptibility to seizures in amyloidosis models52, and it is unclear if the seizure phenotype reported in C57BL/6J APP/PS1 mice would also be observed in APP/PS1 mice on C57BL/6;C3H background used in the current study53. Since seizures could be accompanied by increased excitability of pyramidal cells51,54, higher seizure incidence could result in a dominant hyperactivity phenotype in an amyloidosis mouse model. Furthermore, in agreement with our PV and excitatory cells findings, the initial reports of the hyperactivity phenotype also reported an increased fraction of hypoactive cells5,55. On the other hand, the decrease in spontaneous activity of PV interneurons reported in this study using the deconvolution method is in agreement with previous reports linking PV interneuron deficits to gamma rhythm disruption in AD6,27,29,30,56. It is important to note that our PV findings are limited and uncertain since the peak counting method did not show a significant effect. Future studies should measure PV interneuron firing rates in AD models using in vivo electrophysiological recordings to validate our findings.
Mounting evidence from in vivo and in vitro studies has shown that circuit activity is homeostatically regulated to maintain neuronal firing rates constrained to a particular functional limit57,58. Hence, neuronal circuits will respond to changes in firing activity, particularly in excitatory cells, with compensatory mechanisms to restore the perturbed firing homeostasis57,58. The process of restoring firing homeostasis involves two well-documented mechanisms. One, the circuit can adjust synaptic strength by gradually changing the ratio of inhibitory and excitatory synapses in the direction that normalizes the perturbation, or two, it can modify the intrinsic excitability to balance synaptic input and firing rates57.
We provide evidence for the failure of homeostatic mechanisms to maintain appropriate neuronal firing in APP/PS1 mice. Because the hyperactivity of SOM interneurons correlates with proximity to amyloid plaques SOM interneurons can potentially drive this dyshomeostasis since they supply aberrant inhibition to layer 2/3 pyramidal cells26,59,60. SOM interneurons were also reported to strongly inhibit PV interneurons in cortical layers 2/3 during visual processing61. SOM interneuron hyperactivity could thus suppress PV interneuron firing in APP/PS1 mice. Indeed, we saw hypoactivity within PV interneurons.
In addition to the synaptic mechanisms, alterations in the intrinsic excitability of different cell types can account for the changes in their activity patterns57. While the evidence for altered intrinsic excitability of excitatory cells in amyloidosis mouse models has been inconsistent19,62,63, a decrease in intrinsic excitability of pyramidal cells could potentially account for their hypoactivity in APP/PS1 mice.
Our results have important implications for future studies targeting the inhibitory circuit as a treatment strategy for AD. While inhibitory circuit deficits are prevalent in AD, it is not clear whether a therapeutic strategy that broadly restores inhibitory tone, using GABA agonists or antagonists, would benefit early-stage to intermediate-stage AD patients. Our results suggest that a more targeted approach to restoring inhibitory tone will be needed to overcome these network deficits since interneuron cell types were differentially affected by AD pathology. Future studies using approaches to control neuronal activity, such as optogenetics, should aim to decrease SOM or increase PV interneurons activity. Indeed, several studies have targeted PV interneurons activation using optogenetic and pharmacological approaches to restore oscillatory gamma activity and improve cognitive functions in preclinical animal models27,30,56,64.
Our study assumes that the Ca+2 indicator (GCaMP) concentration distribution across cells in different models is similar. A violation of this assumption could result in inaccurate estimation of event rates due to changes in indicator sensitivity and potentially cellular Ca+2 buffering capacity65. We opted to perform our experiments under low isoflurane anesthesia to reduce experimental variability66 and compare our findings to previous reports of altered single-cell activity in AD5,20. However, anesthesia is known to reduce neuronal activity and presents a limitation to our current findings44. Therefore, future experiments should include reproducing these findings in awake behaving animals using calcium imaging and multi-electrode array electrophysiology.
Together, these findings show an association between amyloid pathology and interneuron-related circuit deficits in an Alzheimer’s disease mouse model. These results should guide future therapeutic approaches targeting circuit dysfunction at the early to intermediate stages of Alzheimer’s disease.