
Presynaptic APP levels and synaptic homeostasis are regulated by Akt phosphorylation of huntingtin

By Julie Bruyère, Yah-Se Abada, Hélène Vitet, Gaëlle Fontaine, Jean-Christophe Deloulme, Aurélia Cès, Eric Denarier, Karin Pernet-Gallay, Annie Andrieux, Sandrine Humbert, Marie-Claude Potier, Benoît Delatour, and Frédéric Saudou
Excerpt from the article published in eLife, May 26, 2020, DOI: https://doi.org/10.7554/eLife.56371
Editor’s Highlights
- Huntingtin (HTT), the scaffolding protein involved in Huntington’s disease, regulates neuritic transport of amyloid precursor protein (APP).
- Defects in APP trafficking could also contribute to synaptic defects observed in HD, as we found that the Akt-HTT pathway is down-regulated in HD patient brain.
- Several studies have reported a notable reduction in the number of synapses particularly within the corticostriatal circuit, which is the most profoundly affected in HD.
- A better understanding of HTT-APP relationship could help unravel mechanisms of interest for both Huntington’s disease and Alzheimer’s disease.
Abstract
Studies have suggested that amyloid precursor protein (APP) regulates synaptic homeostasis, but the evidence has not been consistent. In particular, signaling pathways controlling APP transport to the synapse in axons and dendrites remain to be identified. Having previously shown that Huntingtin (HTT), the scaffolding protein involved in Huntington’s disease, regulates neuritic transport of APP, we used a microfluidic corticocortical neuronal network-on-a-chip to examine APP transport and localization to the pre- and post-synaptic compartments. We found that HTT, upon phosphorylation by the Ser/Thr kinase Akt, regulates APP transport in axons but not dendrites. Expression of an unphosphorylatable HTT decreased axonal anterograde transport of APP, reduced presynaptic APP levels, and increased synaptic density. Ablating in vivo HTT phosphorylation in APPPS1 mice, which overexpress APP, reduced presynaptic APP levels, restored synapse number and improved learning and memory. The Akt-HTT pathway and axonal transport of APP thus regulate APP presynaptic levels and synapse homeostasis.
Introduction
Synaptic homeostasis stabilizes neural circuits and ensures faithful communication within networks that are being continuously remodeled. It involves a complex interplay between presynaptic and postsynaptic proteins that modulates synaptic morphology and strength (Südhof, 2018). Several studies suggest that amyloid precursor protein (APP) contributes to synapse homeostasis (for reviews see Hoe et al., 2012; Müller et al., 2017), and although the evidence is not entirely consistent, this possibility has intuitive appeal because of APP’s involvement in diseases of cognition (e.g., Alzheimer’s disease, Lewy body dementia, and cerebral amyloid angiopathy)(Müller et al., 2017). Some studies suggest that loss of APP reduces synapse density (Weyer et al., 2014), while others show that it increases the number of synapses (Bittner et al., 2009). More firmly established is the fact that APP is transported both in axons and dendrites and localizes in both the pre- and post-synaptic compartments, where it could associate with synaptic release machinery to regulate neuronal transmission (Buggia-Prévot et al., 2014; Das et al., 2016; Fanutza et al., 2015; Groemer et al., 2011; Klevanski et al., 2015). In addition, APP may function as an adhesion molecule at the synapse (Müller et al., 2017; Soba et al., 2005). Any modification in the transport of APP in either axons or dendrites thus has the potential to disrupt synaptic function or homeostasis. Therefore, there is a need to identify mechanisms and/or pathways that specifically regulate APP transport both in axons and/or dendrites and to determine whether manipulating these pathways control APP accumulation and synapse homeostasis.
APP is transported from the Golgi apparatus to the synapse in either dendrites or axons, and in both anterograde and retrograde directions by kinesin-1 and dynein, respectively (Brunholz et al., 2012; Gibbs et al., 2015; Toh and Gleeson, 2016). We and others have shown that wild-type huntingtin (HTT), but not the polyglutamine-expanded HTT that causes Huntington’s disease (HD), facilitates APP transport by increasing the velocity of APP-containing vesicles (Colin et al., 2008; Her and Goldstein, 2008). HTT is a large scaffold protein that interacts with various protein complexes including molecular motor proteins and, regulates consequently the transport of several cargos (Saudou and Humbert, 2016). APP transport into neurites is altered upon reduction of HTT levels or by the presence of polyQ expansion on HTT (Colin et al., 2008; Her and Goldstein, 2008). However, these studies did not distinguished axons from dendrites and did not investigate the consequences on APP levels at the synapse both in vitro and in vivo. Consequently, several questions remain to be addressed regarding the interplay between HTT and APP and its physiological consequences.
To answer these questions, we studied APP and HTT in a microfluidic device that reconstitutes a corticocortical neuronal network with separate presynaptic, synaptic, and postsynaptic compartments, and further tested our findings in APPPS1 mice, which display AD-like pathology. We find that subtle modifications of axonal transport of APP change synaptic levels of APP and have dramatic consequences on synapse function.Results
Developing an in vitro corticocortical network using microfluidic chambers
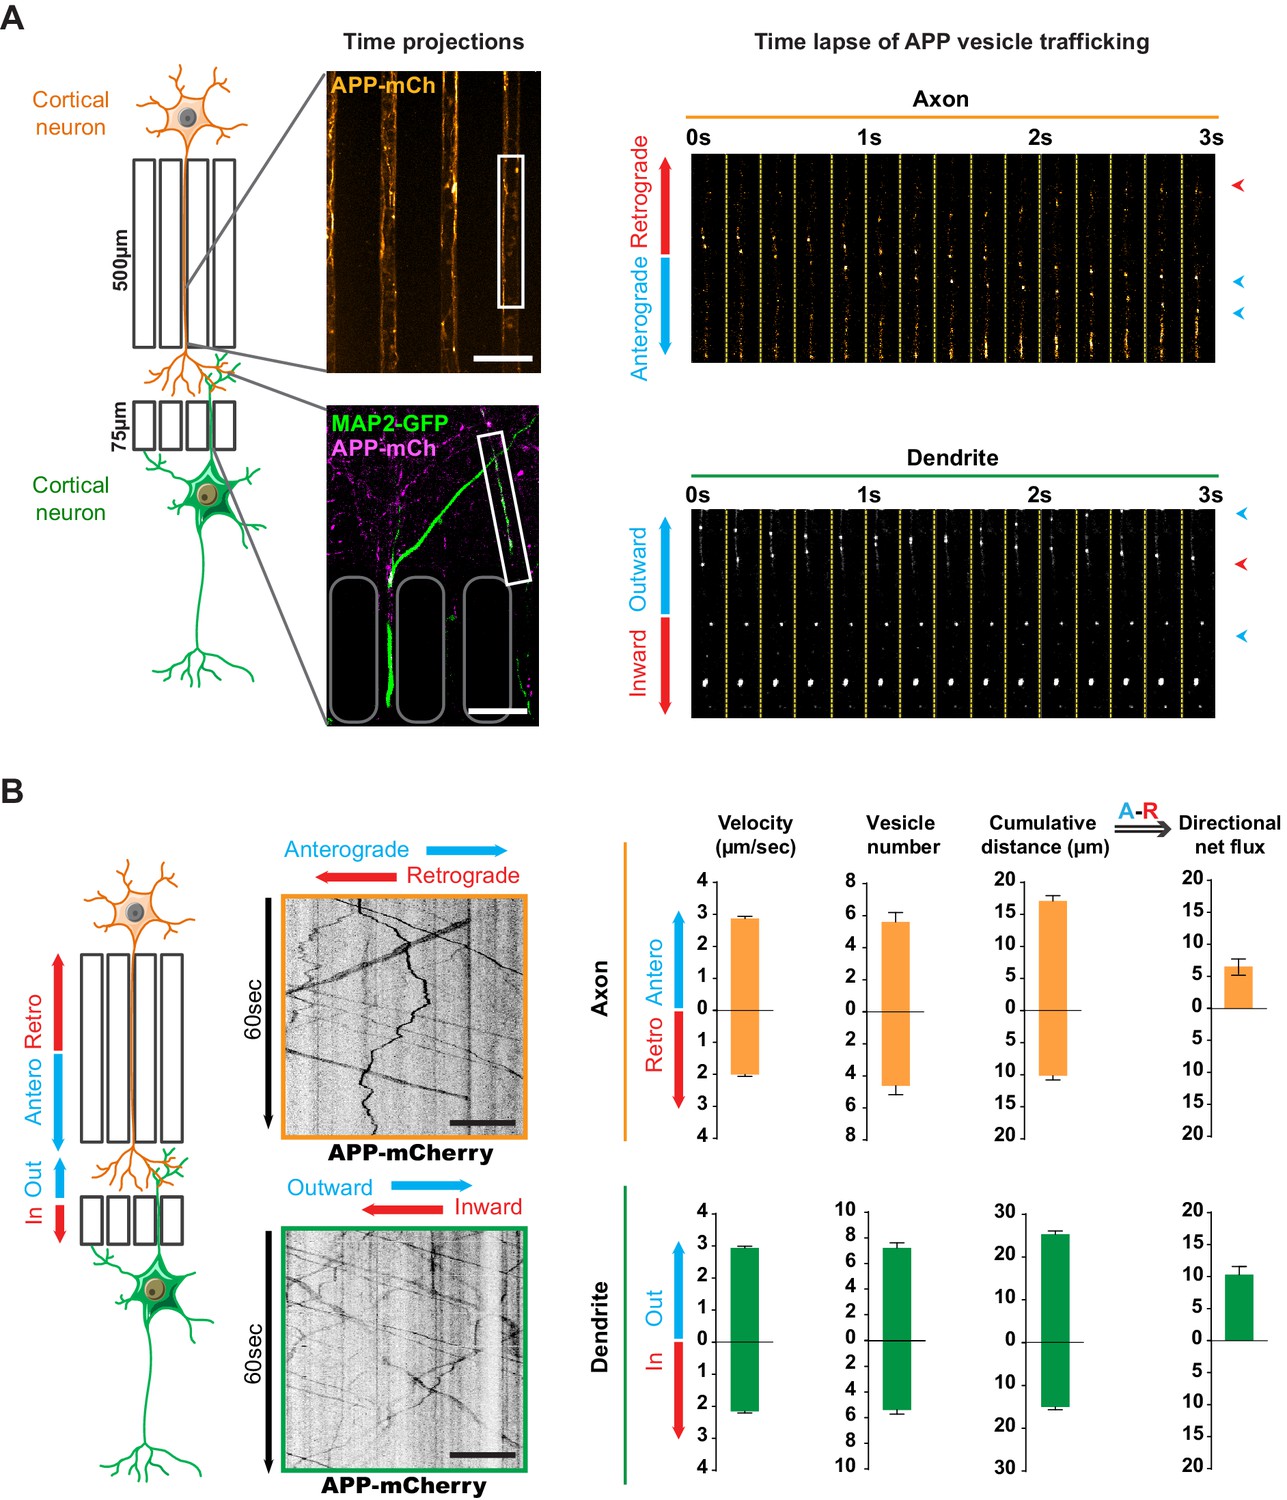
One of the major impediments to assessing APP transport in axons and dendrites under physiological conditions is the difficulty of recreating a mature neuronal network in a dish. Primary cultures are usually randomly distributed, with multidirectional, random connections. The use of Campenot chambers or microfluidic devices made it possible to separate axons from dendrites and soma, but neurons in these chambers are still not integrated into networks as they would be in vivo (Taylor et al., 2005). We therefore turned to later-generation devices (Taylor et al., 2010) and modified them to reconstitute an oriented network with optimized connections (Moutaux et al., 2018; Virlogeux et al., 2018). These devices contain three compartments (presynaptic, synaptic, and postsynaptic) that are fluidically isolated and separated by microchannels that are 5 μm high and 5 μm wide, but of two different lengths: 500 μm and 75 μm (Figure 1A). The 500 μm channels allow only axons from the presynaptic compartment to reach the synaptic compartment (Taylor et al., 2005). The 75 μm long microchannels allow dendrites to cross from the postsynaptic to the synaptic compartment, where MAP2 staining shows they connect with axons coming from the presynaptic compartment (Figure 1B). We reconstructed a corticocortical network-on-a-chip since APP protein is expressed in the cortex, and AD largely targets iso- and archicortical brain regions. In these microfluidic devices, we observed full maturation of the corticocortical neuronal network between days in vitro (DIV) 10 and 15, as revealed by uptake of FM4-64, an indicator of endocytosis/exocytosis of functional synapses (Figure 1C). This device is thus optimized for studying the sub-cellular dynamics of APP.

Reconstituted corticocortical mature neuronal circuit.
(A) Image and schematic representation of the 3-compartment microfluidic chamber that allows the reconstitution of a corticocortical mature network compatible with live-cell imaging of axons and dendrites. (B) Presynaptic neurons were transduced with GFP (green) to visualize axons into microgrooves and MAP2 (red) immunostaining was applied on the entire microchambre at DIV13. Magnification shows axons into distal part of long microchannel but not MAP2-positive dendrites (C) Functional synapses were detected using FM4-64 dye (purple) that labels active presynaptic boutons on GFP dendrites (green) upon 50 mM KCl stimulation. Images represent a projection of 5 µm Z stacks. The highest number of functional corticocortical synapses is visualized between DIV10 and DIV15 in this microfluidic device. Scale bar = 20 µm.
APP is transported to synapses from both pre- and post-synaptic neurons
We transduced mouse cortical neurons at DIV eight with lentiviruses expressing APP tagged with mCherry at the C terminus (APP-mCherry), which retains APP characteristics (Kaether et al., 2000; Marquer et al., 2014). We recorded the movements of APP-mCherry vesicles at high frequency frame rate using spinning disk confocal microscopy and found that velocities reach a maximum at DIV13, when the network is fully mature, with established synapses (Figure 1B and C, Figure 1—figure supplement 1). To assess axonal transport, we first focused on the distal part of the 500 μm long microchannels (Figure 1B) to follow APP-mCherry vesicles within neurons transduced in the presynaptic compartment (Figure 2A, Video 1), which can be reached only by presynaptic axons (Moutaux et al., 2018; Taylor et al., 2005; Virlogeux et al., 2018). To assess dendritic transport of APP-mCherry vesicles, we transfected the postsynaptic neurons with a MAP2-GFP plasmid and selected only the APP-mCherry vesicles that crossed the 75-μm-long microchannels (Figure 2A, Video 2). MAP2-GFP transfection did not modify the transport of APP by itself (data not shown).
Transport of APP in axons and dendrites in reconstituted corticocortical mature neuronal circuit.
(A) APP-mCherry was transduced into the presynaptic compartment for axonal transport analysis or into the postsynaptic compartment for dendritic trafficking. Postsynaptic neurons were transfected with MAP-2-GFP (green) to visualize dendrites that cross the short microchannels. APP-mCherry transport along the axons or the dendrites are represented in time projections of maximum signal intensities for 60 s (middle panels) and real time-lapse analysis of anterograde/retrograde or inward/outward vesicles in axons and dendrites respectively (right panel). Scale bars = 20 µm. (B) Kymograph analyses of APP-mCherry axonal or dendritic transport at DIV13 from time-lapse images acquired every 200 ms during 60 s. Transport characteristics such as the anterograde/retrograde or inward/outward vesicle velocities, moving vesicle number per 100 µm of neurite length, the cumulative distances travelled by vesicles and thus the directional net flux of APP-mCherry trafficking into axons (upper panel) or dendrites (lower panel) are represented by means +/- SEM of 3 independent experiments, 40 axonal and 120 dendritic axons and 674 axonal and 1160 dendritic vesicles. Scale bars = 20 µm. (see also Videos 1 and 2).
Axonal Transport of APP-mCherry in presynaptic cortical neurons at DIV13.
Vesicles were recorded for 60 s at 5 Hz. Axons are oriented from soma (top of the channel) to neurite terminals (bottom) with anterograde vesicles going down. Scale bar, 20 µm.
Transport of APP-mCherry (right panel) in MAP2-GFP positive postsynaptic cortical dendrites (left panel) at DIV13.
Vesicles were recorded for 60 s at 5 Hz. Dendrites are oriented from soma (top of the channel) to neurite terminals (bottom) with outward vesicles going down. Scale bar, 20 µm.
We generated kymographs from the axonal and dendritic recordings (Figure 2B) and measured several transport parameters (see Materials and methods): the velocity of APP-mCherry vesicles, their number, and the cumulative distance they travelled in anterograde and retrograde directions within axons. We defined the overall direction of APP-mCherry vesicle transport in axons by adding the anterograde cumulative distance to the negative retrograde cumulative distance, so that positive values indicate a net anterograde flux from the soma towards the synapse (Figure 2B). We also measured dendritic transport, expressed as inward (from postsynaptic compartment to soma) or outward (from soma to postsynaptic site), since microtubules in dendrites (unlike in axons) are not fully oriented with the plus ends towards the dendrite’s extremities (Kapitein and Hoogenraad, 2015; van Beuningen and Hoogenraad, 2016; Figure 2B). Our analysis showed a net anterograde axonal and outward dendritic flux for APP-mCherry-containing vesicles, indicating that there is a significant transport of APP to the synapse from both pre- and postsynaptic neurons (Figure 2B). These findings in a mature network are in accordance with the reported velocities of APP vesicles (Fu and Holzbaur, 2013; Her and Goldstein, 2008; Marquer et al., 2014; Rodrigues et al., 2012; Vagnoni et al., 2013).
Huntingtin phosphorylation regulates axonal but not dendritic transport of APP
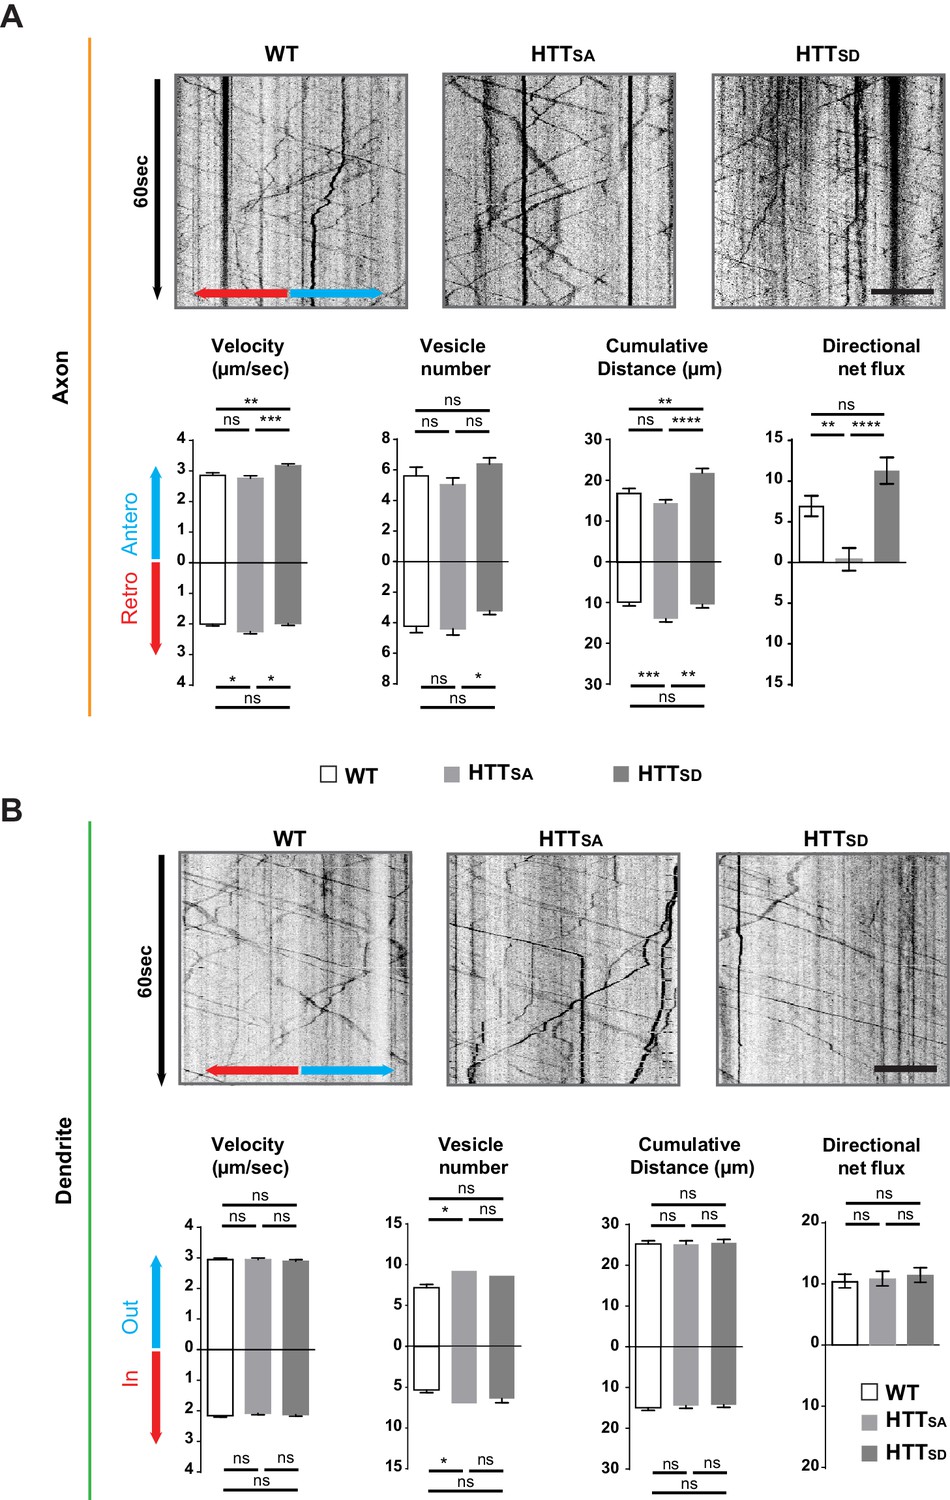
We had previously shown that phosphorylation of HTT at Serine 421 determines the direction in which various cargoes are transported in neurites (Colin et al., 2008). These experiments over-expressed short HTT fragments containing mutations at Serine 421 in neurons that were randomly cultured (i.e., not integrated into a mature network) and in which axons and dendrites could not be discriminated. To study the role of HTT phosphorylation at S421 in APP transport in axons versus dendrites, we took advantage of our microfluidic system and two lines of homozygous knock-in mice: one in which Serine 421 is replaced by an alanine (HttS421A/S421A or HTTSA), mimicking the absence of phosphorylation, and another in which Serine 421 is replaced by aspartic acid (HttS421D/S421D or HTTSD), mimicking constitutive phosphorylation (Thion et al., 2015). It is important to note that neither mutation affects the level of HTT expression (Ehinger et al., 2020).
We isolated HTTSA and HTTSD cortical neurons from the mice and plated them in both pre- and postsynaptic compartments of our microfluidic device as in Figure 1A. Abolishing HTT phosphorylation at Serine 421 increased the velocity of retrograde vesicles, increased their cumulative distance travelled, and reduced the net anterograde flux of APP vesicles in axons (Figure 3A, Video 3), whereas HTTSD neurons showed an increase in anterograde velocity and greater cumulative distance travelled by APP compared to HTTSA or wild type (WT) neurons. Nevertheless, the net flux, which reflects the flow of vesicles from the soma to axon terminals, was not significantly different from that observed in WT neurons. This indicates that in our experimental conditions, most of the WT HTT is in its phosphorylated form. Phosphorylation status did not, however, modify APP transport in dendrites (Figure 3B). We conclude that HTT phosphorylation regulates axonal but not dendritic transport of APP to the synapse.
Axonal but not dendritic transport of APP depends on HTT phosphorylation.
(A) Kymographs and quantifications of APP-mCherry into WT, HTTSA and HTTSD axons. Velocity, vesicle number per 100 µm of neurite length, cumulative distance and directional net flux were measured. Histograms represent means +/- SEM of 3 independent experiments, 41 WT, 52 HTTSAand 63 HTTSD axons and 674 WT, 602 HTTSA and 493 HTTSD vesicles. Significance was determined using an unpaired t-test; *p<0.05, **p<0.01, ***p<0.001, ****p<0.0001, ns = not significant. Scale bar = 20 µm. (B) Kymographs and quantifications of APP-mCherry into WT, HTTSA and HTTSD dendrites. Dendritic inward and outward velocity, vesicle number per 100 µm of neurite length, cumulative distance and directional net flux were measured. Histograms represent means +/- SEM of 4 independent experiments, 122 WT, 99 HTTSA and 109 HTTSD dendrites, 1171 WT, 1119 HTTSA and 1074 HTTSD vesicles. Significance was determined using an unpaired t-test; *p<0.05; ns = not significant. Scale bar = 20 µm. (see also Video 3).
APP-mCherry transport in WT (left panel) or HTTSA (right panel) axons at DIV13.
Vesicles were recorded for 60 s at 5 Hz. Axons are oriented from soma (top of the channel) to neurite terminals (bottom) with anterograde vesicles going down. Scale bar, 20 µm.
Given that microtubule polarity influences selective cargo trafficking in axons and dendrites (van Beuningen and Hoogenraad, 2016), it is interesting to note that the axon-specific effect of HTT phosphorylation correlates with axons’ preferential plus-end microtubule orientation (dendrites have mixed microtubule polarity). To further understand the selective effect in axons versus dendrites, we investigated the interaction of non-phospho HTT with kinesin-1, the molecular motor responsible for the transport of APP (Matsuda et al., 2001; Verhey et al., 2001). Because most WT HTT is already in its phosphorylated form in our experimental conditions, we compared HTTSAwith WT (rather than HTTSD) neurons. We found no difference between WT and HTTSA neurons in their total kinesin heavy chain (KHC) levels (Figure 3—figure supplement 1A), but HTTSA neurons had less KHC in the vesicular fraction than in the cytosolic fraction (Figure 3—figure supplement 1B). These results are in agreement with our previous study suggesting HTT dephosphorylation decreases the association of kinesin-1 with vesicles (Colin et al., 2008).
HTT regulation of APP anterograde axonal transport is mediated by akt phosphorylation
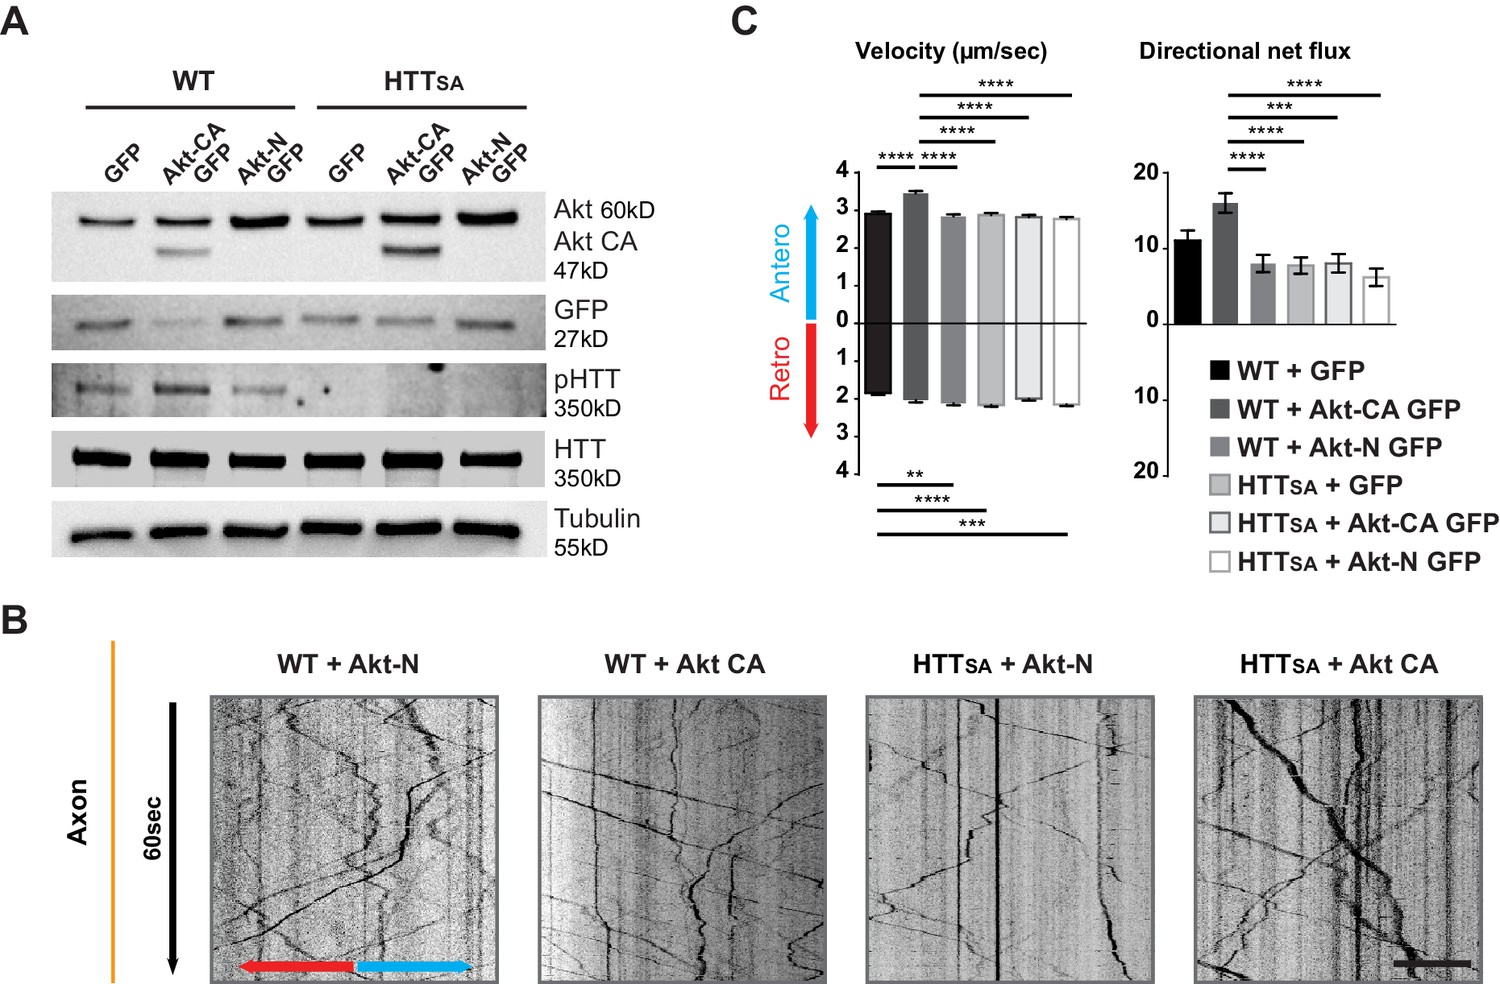
HTT phosphorylation at S421 depends on the Akt kinase (Humbert et al., 2002). We therefore investigated whether Akt could modify anterograde transport of APP and whether this required HTT phosphorylation. We transduced cortical neurons with APP-mCherry and a construct encoding constitutively active Akt (Akt-CA) or a form of Akt (Akt-N) that has no kinase activity with and IRES-GFP or the corresponding empty GFP vector (GFP) as a control. As expected, Akt induced endogenous HTT phosphorylation in WT neurons but was unable to do so in HTTSA neurons (Figure 4A). In addition, HTT phosphorylation was reduced upon Akt-N expression.
Akt regulates APP transport in a HTT phospho-dependent manner.
(A) WT and HTTSA neurons transduced with constitutively active Akt (Akt-CA GFP) or an inactive form of Akt (Akt-N GFP) in IRES GFP constructs or with empty GFP vector (GFP) were analyzed by western blotting with Akt, GFP, phosphorylated HTT, total HTT and tubulin antibodies. (B) Kymographs of APP-mCherry from WT and HTTSA neurons seeded in microchambers and transduced with APP-mCherry and GFP, Akt-CA GFP or Akt-N GFP. Scale bar 20 µm. (see also Video 4). (C) Velocity and directional net flux of APP-mCherry vesicles were quantified. Histograms represent means +/- SEM of 3 independent experiments, 936 WT GFP, 988 WT AKT CA, 1261WT AKT N, 1357 HTTSA GFP, 1048 HTTSA AKT CA and 1177 HTTSA AKT N vesicles. Significance was determined using one-way ANOVA followed by Tukey’s post-hoc analysis for multiple comparisons; *p<0.05, **p<0.01, ***p<0.001, ****p<0.0001.
To ensure Akt was not affecting neuronal growth and maturation, we transduced neurons at DIV8 and analyzed APP trafficking at DIV13. Expressing Akt-CA and APP-mCherry in WT cortical neurons had no effect on vesicle number but markedly increased anterograde velocity of APP and the cumulative distances travelled by anterograde APP-mCherry-containing vesicles, which in turn led to an increase of their net anterograde flux (Figure 4B and C, Video 4). In contrast, in HTTSA neurons, Akt-CA was unable to modify the different transport parameters. Thus, Akt activation increases APP anterograde transport in axons by phosphorylating HTT at Serine 421. These results identify Akt-HTT signaling as a new mechanism that regulates axonal trafficking of APP.
Effect of Akt on the axonal transport of APP-mCherry in presynaptic cortical neurons from WT or HTTSA mice at DIV13.
Vesicles were recorded for 60 s at 5 Hz. Axons are oriented from soma (top of the channel) to neurite terminals (bottom) with anterograde vesicles going down. Scale bar, 20 µm.
Huntingtin-mediated axonal transport determines presynaptic APP levels
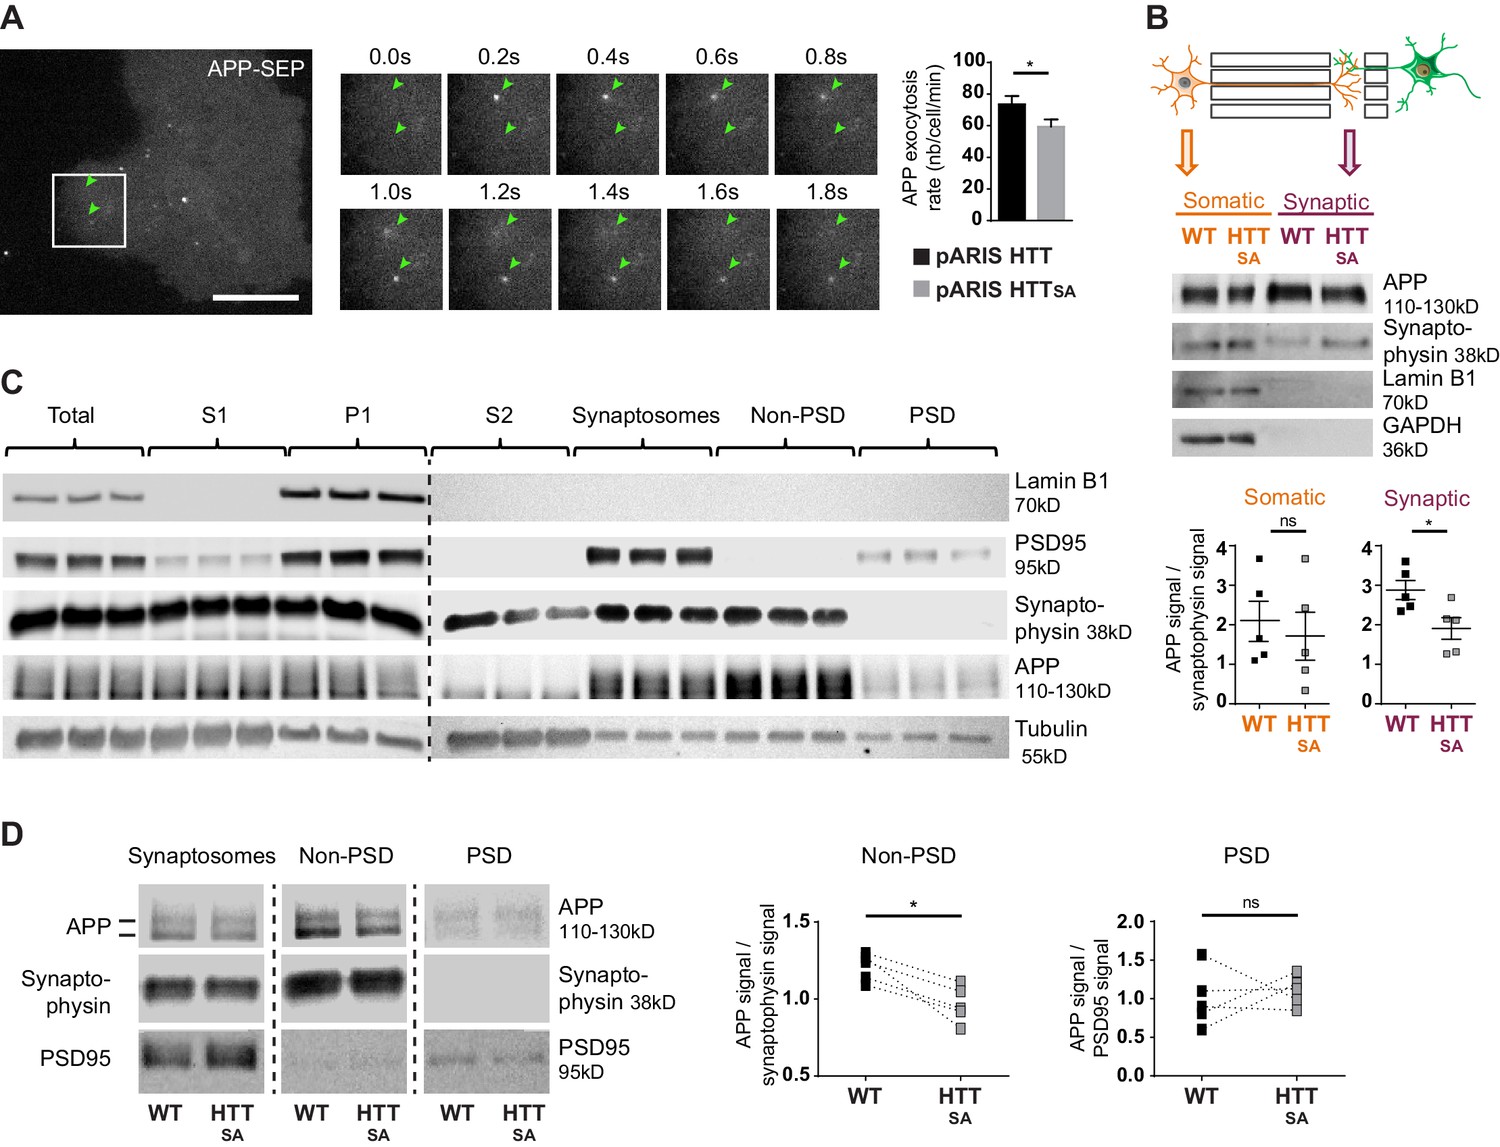
To determine whether reduced anterograde axonal transport of APP affects the targeting of APP at the plasma membrane, we used TIRF (total internal reflection fluorescence) microscopy and a super-ecliptic version of pHluorin (SEP) fused to the N-terminal part of APP to monitor insertion of APP into the plasma membrane. As we could not reliably detect APP-SEP at the membrane in primary cultures of neurons, we transfected the APP-SEP construct with versions of full-length wild type HTT (pARIS HTT) (Pardo et al., 2010) or full-length HTT containing the S421A mutation (pARIS HTTSA) into COS cells that are known to have their plus-end microtubules oriented toward the plasma membrane (Takemura et al., 1995). We detected far fewer APP-SEP dots per minute in cells expressing pARIS HTTSA than in cells expressing pARIS HTT (Figure 5A, Video 5). This result suggests that reducing transport of APP to the plasma membrane by dephosphorylating HTT decreases APP targeting at the plasma membrane.
HTT S421 phosphorylation affects presynaptic APP targeting.
(A) Effect of HTT S421 phosphorylation on exocytosis rate of APP was analyzed in COS cells co-transfected with APP-SEP (Super Ecliptic pHluorin) and with pARIS HTT or pARIS HTTSA visualized by TIRF microscopy. Magnification represents a time lapse of events showing 2 events of APP vesicle exocytosis (green arrows). Histograms represent means +/- SEM of exocytosis event number per minute in 39 HTT and 40 HTTSA cells from four independent experiments. Significance was determined using an unpaired t-test; *p<0.05. Scale bar = 20 µm. (see also Video 5). (B) Effect of HTT S421 phosphorylation on APP targeting at the synapse was assessed by anti-APP western blotting (22C11) analysis of extracts from synaptic chambers of a WT or HTTSAcorticocortical network. SNAP25 was used as a control for protein content in the synaptic compartment and nuclear marker Lamin B1 for the somatic compartment. Histograms represent means +/- SEM of APP signal per synaptophysin signal on five independent experiments. Significance was determined using a Mann-Whitney test; *p<0.05, ns = not significant. (C) Western blotting analysis of pre- and postsynaptic fractions obtained from synaptosome preparations. Fractionation gives the first pellet, P1, the first supernatant, S1, and the second supernatant, S2. Lamin B1, a nuclear marker is enriched in P1 fraction. The pre- (non-PSD) and the post-synaptic (PSD) fractions are respectively enriched in synaptophysin and PSD95. (D) APP from WT or HTTSA cortices fractions was quantified by western blotting analyses. APP signal was quantified as the ratio of synaptophysin signal for non-PSD fraction and as the ratio of PSD95 signal for PSD fraction. One line represents one experiment. Significance was determined using Mann-Whitney test; *p<0.05, ns = not significant.
APP-SEP co-transfected in COS cells with pARIS WT HTT (left panel) or pARIS HTTSA (right panel) visualized by TIRF microscopy.
Vesicle exocytosis of APP was recorded at 5 Hz. Scale bar, 20 µm.
The fluidic isolation of the synaptic compartment enabled us to collect proteins and investigate the targeting of APP at synapses by measuring APP levels by western blot. We first verified that the synaptic chamber is enriched with synaptic marker synaptophysin and empty of nuclear marker lamin B1 (Figure 5B). Lack of HTT phosphorylation led to a reduction of APP protein levels at synapses but no real change in the soma-containing chamber (Figure 5B).
We then investigated APP targeting in vivo. We first prepared synaptosomal fractions from WT mouse brains and purified post-synaptic density fractions (PSD, enriched in postsynaptic proteins) and non-PSD fractions that are enriched with presynaptic proteins. As expected, we detected synaptophysin, a presynaptic marker, and PSD95, a postsynaptic marker, in the non-PSD and PSD enriched fractions, respectively (Figure 5C). We detected APP in both fractions. We found that most of the synaptosomal APP was enriched in the non-PSD fraction, which suggests that a significant fraction of APP found at synapses originates from the presynaptic compartment. Since anterograde axonal transport of APP is controlled by HTT phosphorylation, we measured APP within fractions prepared from HTTSA homozygous mouse brains (Figure 5D). APP levels were lower in the non-PSD fraction of HTTSA mouse brains (enriched with presynaptic proteins), but APP levels did not differ significantly between WT and HTTSA mouse brains in the PSD fraction (Figure 5D). Together, our results indicate that the absence of HTT phosphorylation reduces anterograde transport of APP in axons, but not in dendrites, and subsequently regulates the levels of APP in the presynaptic compartment both in vitro and in vivo.
HTT chronic dephosphorylation alters brain morphology and synapse size and number
The previously generated HTTSA mice have no obvious phenotype but were not fully characterized for brain-related behavior and morphology (Thion et al., 2015). Subsequent analyses of the mice at 6 months of age did not reveal any behavioral abnormalities (Ehinger et al., 2020). Given our observation that anterograde transport and presynaptic accumulation of APP are both reduced in HTTSA mice and that APP is associated with late-onset defects, we subjected the mice to complete behavioral analysis (SHIRPA Rogers et al., 1997, open field, grip test and elevated plus Maze) when they were 12 months old, and again found no significant differences in behavior (Figure 6—figure supplement 1 and Supplementary file 1).
We then performed anatomical ex vivo MRI of young adult WT and HTTSAmice (Figure 6A and B). HTTSA mice between 8 and 11 weeks of age showed greater whole brain volume (4.8%) affecting the hippocampus (8.5%) and the cortex (3.7%) but not the striatum. To determine whether HTTSA produced more subtle changes in synapse number and morphology, we quantified synaptic density and spine size in WT and HTTSA mice by electron microscopy. HTTSA mice had more synapses than WT mice but no difference in spine size (Figure 6C).

HTT dephosphorylation induces changes in brain morphology and synapse number.
(A) Representative 3D reconstructions of WT brain areas built from high spatial resolution ex vivo MRI-T1w data. Each brain structure is represented with a specific color: cortex (purple), hippocampal formation (pink), striatum (green), and other structures (light grey). (B) Quantification of the volumes of the different cerebral regions represented in (A). The graphics show volumes for these regions (in mm3) of 2 and 3-month-old WT and HTTSA mice. Black bars represent the mean of 4 WT and 4 HTTSA mice, Mann and Whitney two tails, *P < 0.05; **P < 0.01; ***P < 0.001). (C) Synapse number and size in CA1 region of 19-month-old WT or HTTSA mice were quantified by electron microscopy. Axon terminals (AxT) and spines (Sp) are colored with green and purple respectively. Histograms represent means +/- SEM of 3 brains with 134 (WT) and 203(HTTSA) fields analyzed and 225 (WT) and 218 (HTTSA) synapses. Significance was determined using an unpaired t-test; **p<0.01, ns = not significant. Scale bar = 1 µm.
To further investigate the contribution of transport and APP levels on synapse number, we took advantage of the microfluidic devices and, using pre- and post-synaptic markers (synaptophysin and PSD95, respectively), measured the number of synaptic contacts in the synaptic compartment within WT and HTTSA mature neuronal circuits at DIV12. In agreement with our in vivo experiments (Figure 6C), we found an increase in the number of synaptic contacts in the HTTSA circuit (Figure 7A).
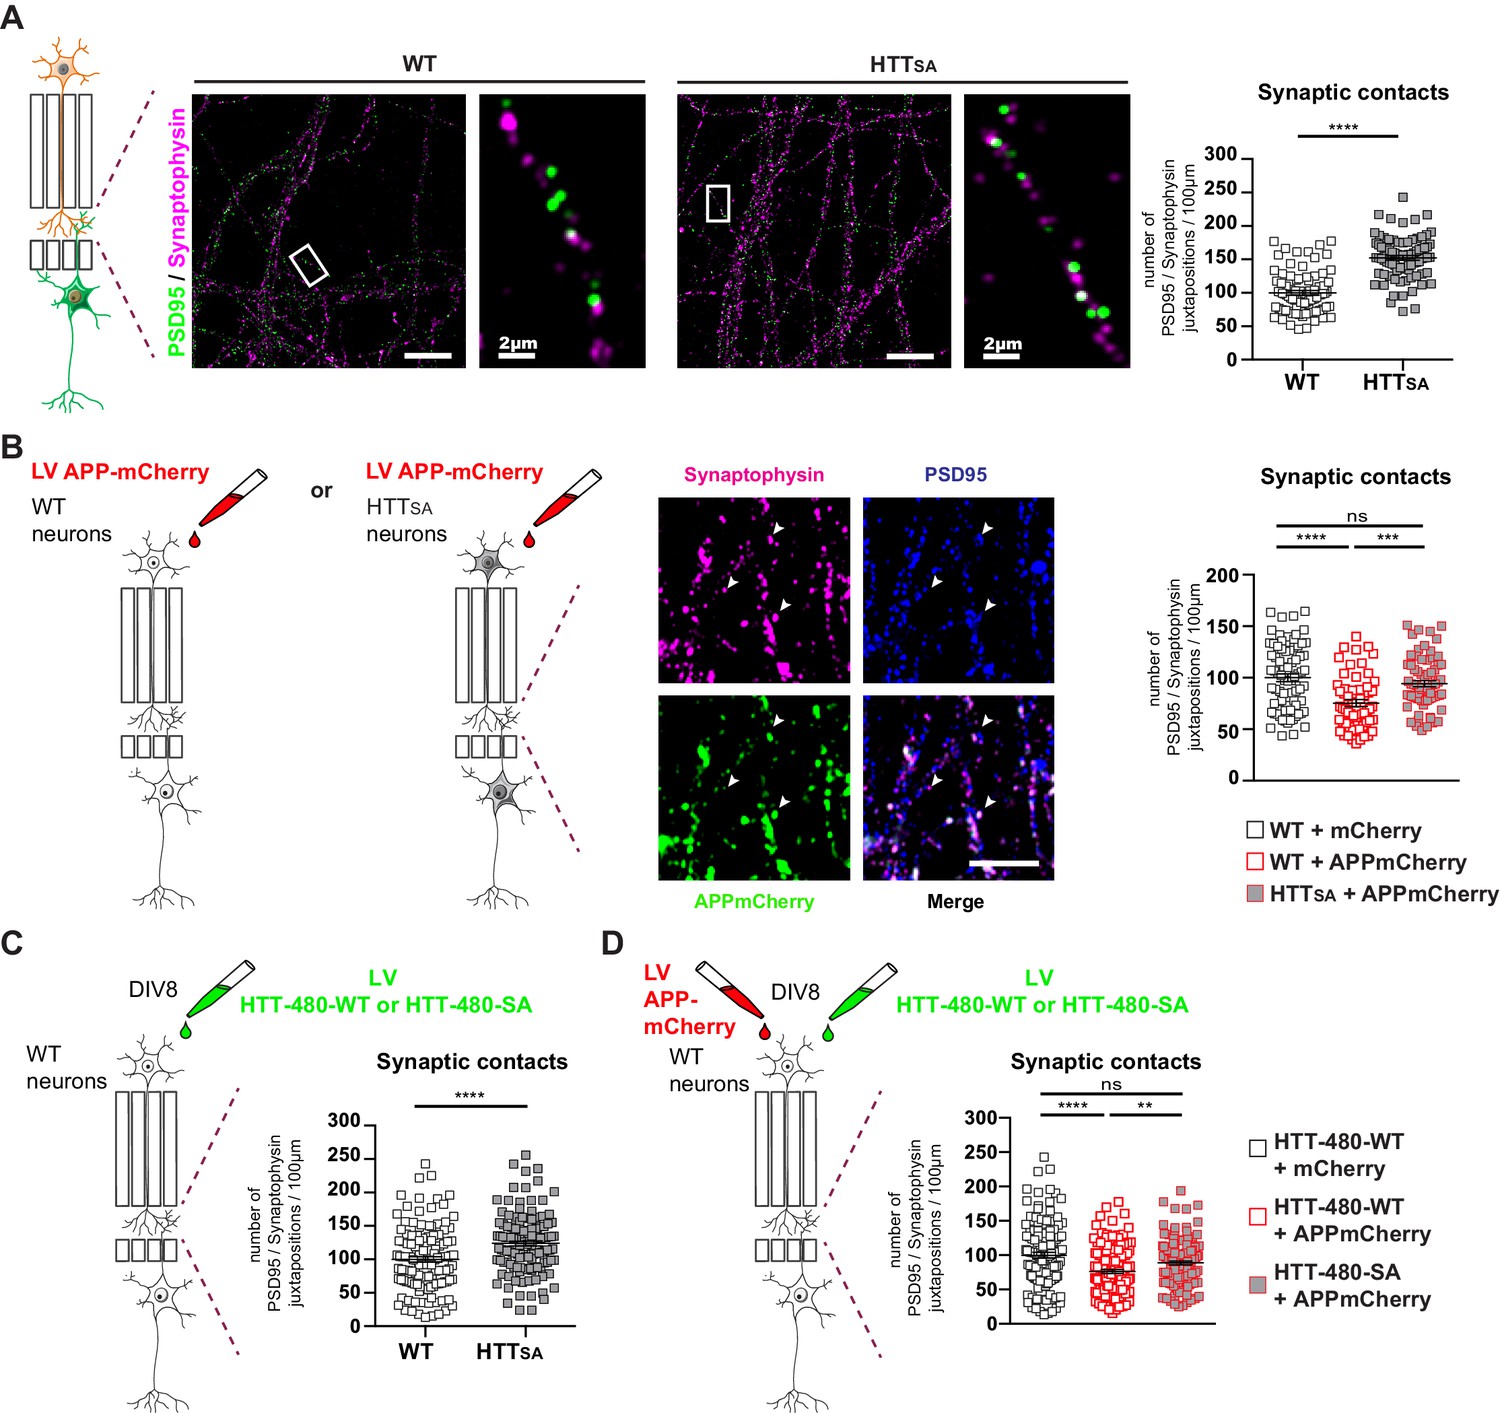
HTT phosphorylation regulates synaptic contacts by reducing presynaptic APP levels.
(A) Number of PSD95/Synaptophysin contacts in the synaptic chamber of WT and HTTSAnetwork. Right microphotographs for each genotype show magnification of representative neurites. Scale bars = 20 µm (low magnification) or 2 µm (high magnification). Histograms represent means +/- SEM of 3 independent experiments and 85 WT and 91 HTTSA neurites. Significance was determined using an unpaired t-test; ****p<0.0001. (B) Representative image of APP-mCherry transduced presynaptic neurons. APP-mCherry is present in axon terminals positive for synaptophysin (white arrows). Scale bar = 2 µm. Number of PSD95/Synaptophysin contacts in the synaptic chamber of WT and HTTSA network transduced at presynaptic site with APP-mCherry or mCherry as a control. Histograms represent means +/- SEM of 3 independent experiments and 75 WT + mCherry; 59 WT + APP-mCherry and 71 HTTSA APP-mCherry neurites. (C) Number of PSD95/Synaptophysin contacts in the synaptic chamber of WT mature network transduced at presynaptic site with a lentivirus encoding an HTT construct containing the first 480 amino acids without (HTT-480-WT) or with the S421A mutation (HTT-480-SA). Histograms represent means +/- SEM of at least three independent experiments and 132 HTT-480-WT and 130 HTT-480-SA neurites. Significance was determined using Mann and Whitney test; ****p<0.0001. (D) Number of PSD95/Synaptophysin contacts in the synaptic chamber of WT mature network transduced at presynaptic site with APP-mCherry or mCherry as a control and with a lentivirus encoding a HTT-480-WT or HTT-480-SA. Histograms represent means +/- SEM of 3 independent experiments and 132 HTT-480-WT + mCherry, 134 HTT-480-WT + APP mCherry and 136 HTT-480-SA + APP mCherry neurites. Significance was determined using one-way Kruskal-Wallis test followed by Dunn’s post-hoc analysis for multiple comparisons; **p<0.01, ***p<0.001, ****p<0.0001, ns = not significant.
To determine whether APP overexpression would increase the quantity of APP within the presynaptic cortical compartment of a WT or HTTSA network (Figure 7B), we transduced WT or HTTSA neurons with a lentivirus expressing APP-mCherry at DIV7 and measured synapse number at DIV12. Overexpressing APP-mCherry in WT presynaptic cortical neurons decreased synaptic contacts, but overexpressing APP-mCherry in HTTSA presynaptic cortical neurons restored synaptic contacts back to the levels seen in WT neurons (Figure 7B). The presynaptic level of APP thus appears to determine synapse number and can be modulated by HTT phosphorylation; this further supports a role for the Akt-HTT-APP pathway in synapse homeostasis. To ensure that the HTTSA mutation was not affecting neurodevelopment, we transduced a WT circuit at DIV8, when axon growth has ended (Moutaux et al., 2018), with lentiviruses expressing APP-mCherry and either an N-terminal HTT construct containing the first 480 amino acids (HTT-480-WT) or a construct in which the S421 has been mutated into alanine (HTT-480-SA). We found that expressing the HTT-480-SA construct in mature neurons led to an increase in synaptic contacts similar to what is observed in HTTSA neurons differentiated in microchambers (Figure 7A and C). This suggests that the HTT S421A mutation has no major role in axon growth and/or that the increase of synaptic contacts seen in HTTSA neurons is not due to changes in neurodevelopment but rather results from reduced transport and accumulation of APP at the presynapses. We then investigated the effect of APP overexpression in WT neurons. As in Figure 7B, APP-mCherry overexpression in WT neurons transduced with HTT-480-WT led to a decrease in the number of synaptic contacts. However, it had no effect in neurons expressing HTT-480-SA, indicating that HTT dephosphorylation attenuates the effect of APP overexpression on synapse number (Figure 7D). We conclude that reducing anterograde axonal transport of APP either during axonal growth or in mature networks is sufficient to modulate synaptic contact number.
Unphosphorylatable HTT reduces APP presynaptic levels in APPPS1 mouse model
HTT-mediated transport clearly modulates presynaptic levels of APP in a corticocortical circuit, but we wanted to investigate the consequences of chronic HTT dephosphorylation in vivo, in a mouse line that overexpresses APP. We chose APPPS1 mice—double transgenics that bear a human APP transgene with the Swedish mutation (APPSwe) and a mutant human presenilin 1 (PS1L166P) transgene (Radde et al., 2006)—which express human APP at three times the level of murine APP and mimic familial Alzheimer’s. These mice show reduced synapse density (Alonso-Nanclares et al., 2013; Bittner et al., 2012; Hoe et al., 2012; Müller et al., 2017; Priller et al., 2009; Radde et al., 2006; Zou et al., 2015). We crossed HTTSA phospho-mutant mice with APPPS1 mice to generate APPswe;PS1L166P;HttS421A/S421A mice, heretofore referred to as APPPS1/HTTSA mice.
The levels of APP in the non-post-synaptic density fraction of APPPS1/HTTSAmice were significantly lower than in APPPS1 mice at 10 months (Figure 8A and B). Since the PS1L166P mutation promotes APP cleavage, thereby increasing Aβ42 production (Radde et al., 2006), we biochemically quantified Aβ levels (Figure 8—figure supplement 1A) and performed histological measurements of plaque loads using the 4G8 antibody that recognizes both human and murine Aβ (Figure 8—figure supplement 1B). We also measured amyloid burden using Congo red to stain amyloid plaques, and OC and A11 antibodies to recognize amyloid fibrils, fibrillary oligomers, and prefibrillar oligomers (Kayed et al., 2007) in 19-month-old APPPS1 and APPPS1/HTTSA mouse brains, a time that corresponds to the final behavioral evaluation of the mice before histopathological analyses (Figure 8—figure supplement 1C). We found no significant differences between genotypes, indicating that loss of HTT phosphorylation has no effect on Aβ level, amyloid load, Aβ oligomer load or plaque aggregation. These results indicate that HTT dephosphorylation regulates presynaptic levels of APPSwe without affecting downstream Aβ production and/or accumulation.
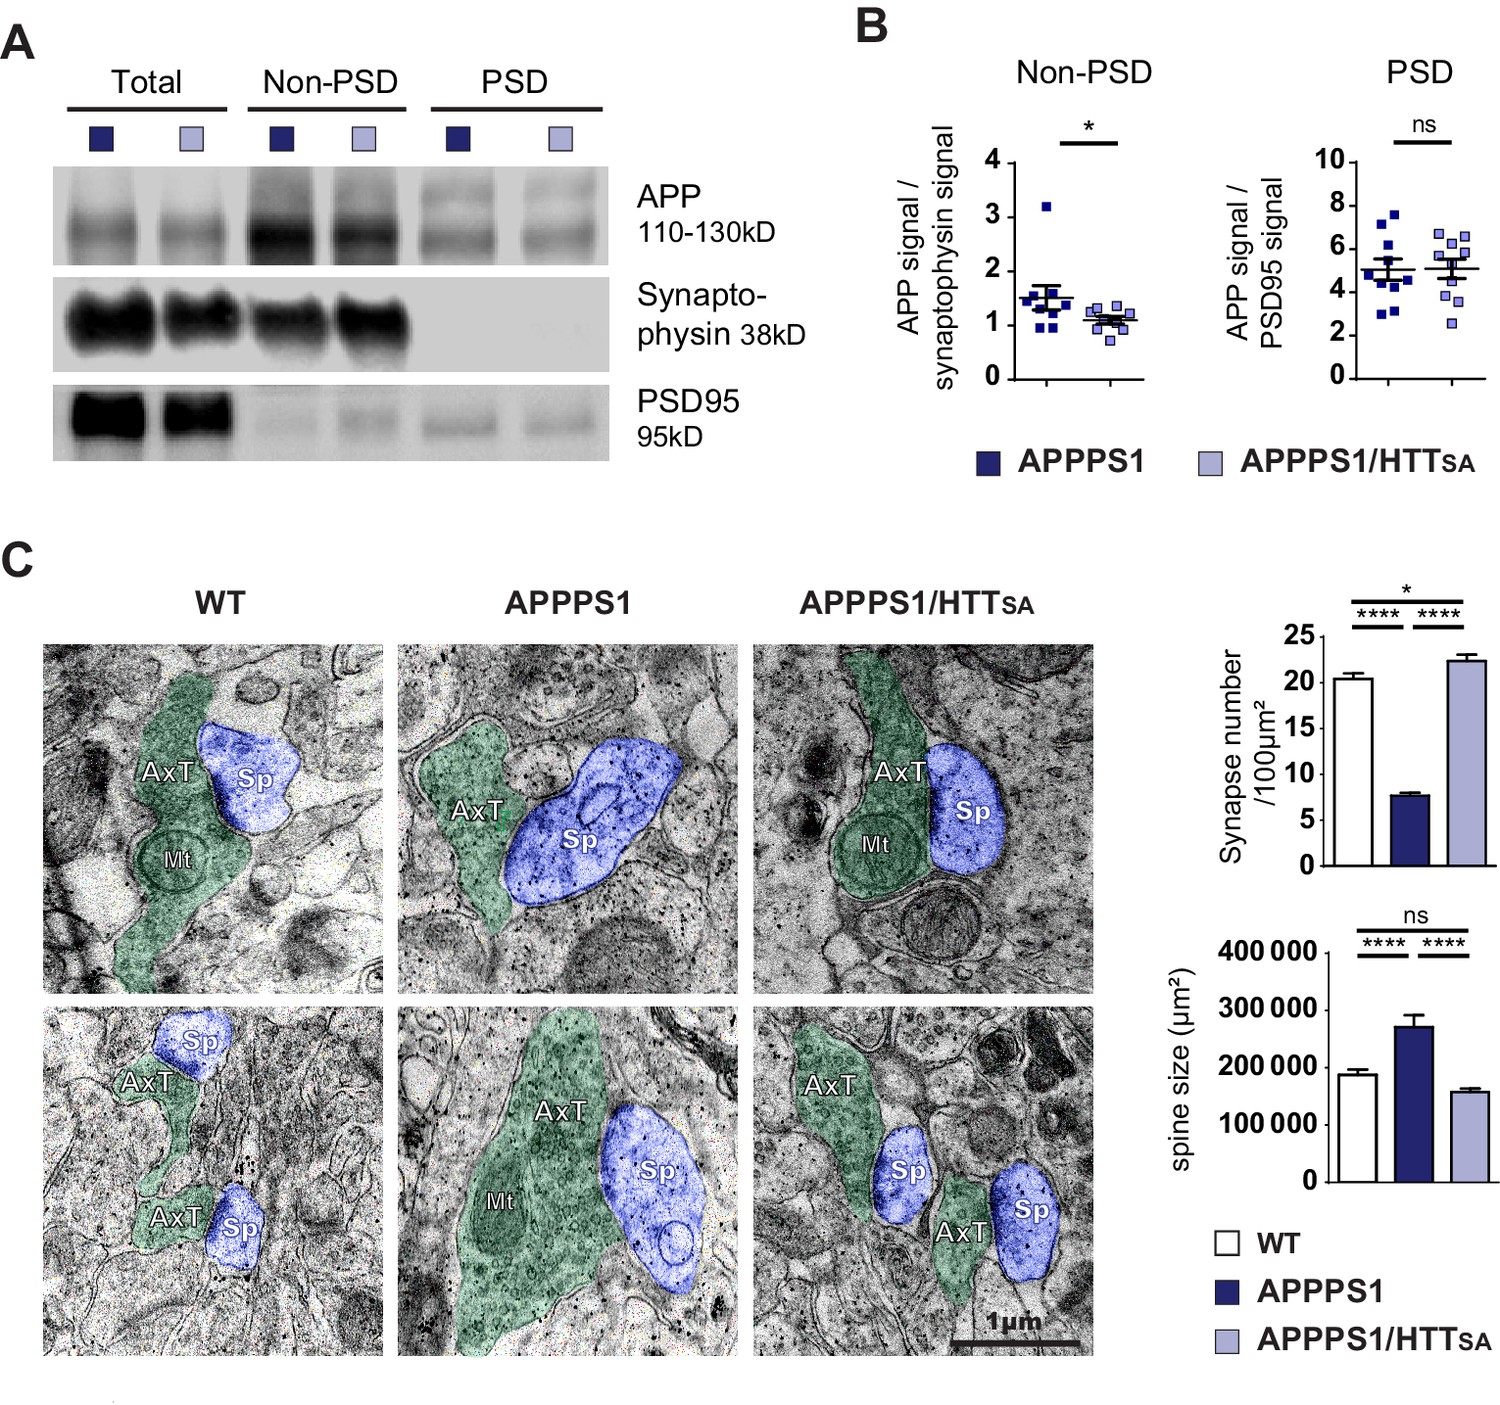
HTT S421 dephosphorylation rescues synapse number in APPPS1 mice.
(A) APP levels from APPPS1 and APPPS1/HTTSA cortical fractions were quantified by western blotting analyses after synaptosomes fractionation. (B) APP signal was quantified as the ratio of synaptophysin signal for non-PSD fraction and as the ratio of PSD95 signal for PSD fraction. Histograms represent means +/- SEM of 9 experiments. Significance was determined using Wilcoxon test; *p<0.05, ns = not significant. (C) Synaptic number and postsynaptic density (PSD) length of CA1 region of hippocampi from 19-month-old APPPS1 and APPPS1/HTTSA mice were quantified by electron microscopy. Axon terminals (AxT) and spines (Sp) are colored with green and purple, respectively. Scale bar = 1 µm. (D) Histograms represent means +/- SEM of 3 brains; 153 APPPS1 and 152 APPPS1/HTTSA fields and 182 APPPS1 and 350 APPPS1/HTTSA synapses were analyzed. Significance was determined using one-way ANOVA followed by Tukey’s multiple comparisons test; *p<0.05, ****p<0.0001; ns = not significant.
We next quantified the number and the size of the spines in the CA1 region of 19-month-old mice by electron microscopy. As previously described for APPSwe-PS1ΔE9 mice, 5xFAD Tg mice, and APPxPS1-KI mice (Androuin et al., 2018; Koffie et al., 2009; Neuman et al., 2015), APPPS1 mice showed lower synaptic density and larger spines than WT mice (Figure 8C). Strikingly, unphosphorylatable HTT (HTTSA) significantly increased spine density and completely rescued APPPS1-induced increase of spine size (Figure 8C).
Unphosphorylatable HTT improves learning and memory in APPPS1 mice
We next investigated the behavior of WT, APPPS1, and APPPS1/HTTSA mice. Extensive phenotypic analysis of the HTTSA mice using a modified SHIRPA primary screen and various behavioral tests (Figure 6—figure supplement 1and Supplementary file 1) revealed no significant changes in the behavioral-neurological status of 12 to 15 month-old HTTSA mice compared to WT mice. When we compared WT, APPPS1, and APPPS1/HTTSA mice, we found no significant differences in locomotor activity or anxiety-related behavior in the open field test (Figure 9—figure supplement 1).
We then evaluated spatial learning of 12- to 15-month-old APPPS1 and APPPS1/HTTSA mice in the Morris water maze paradigm. As expected, APPPS1 mice took longer paths to reach the platform of the water maze (Figure 9A). APPPS1/HTTSA mice performed better than APPPS1 mice, although not to the level of WT mice. Comparing the early and late stages of learning in the APPPS1/HTTSA mice, we found that APPPS1/HTTSA mice performed about as poorly as the APPPS1 mice in the early stages of learning (first training sessions). In the late training sessions, however, they performed much better than APPPS1 mice and showed a substantial recovery of performance (Figure 9B). Finally, we evaluated their memory of the platform location by subjecting the mice to a probe trial. APPPS1 mice explored all quadrants of the pool equally, whereas both WT and APPPS1/HTTSA mice showed a preference for the target quadrant, indicating that their memory of the platform was intact (Figure 9C).
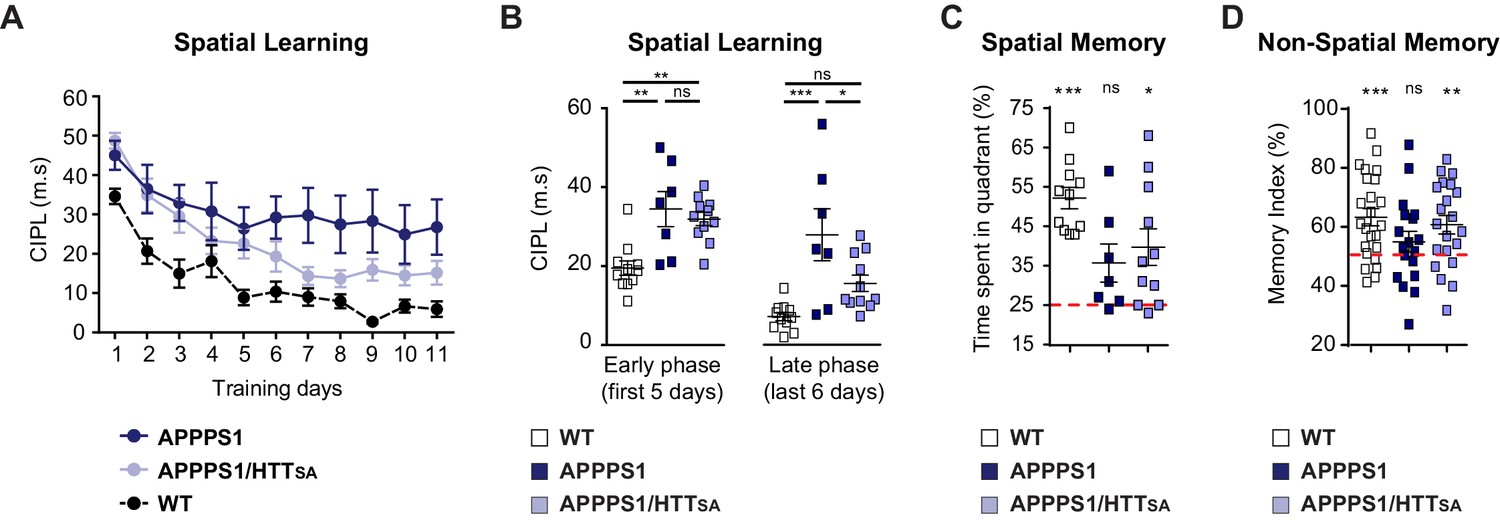
HTT S421 dephosphorylation enhances learning and memory in APPPS1 mice.
(A) Spatial learning of 7 APPPS1 mice (dark blue), 11 APPPS1/HTTSA mice (light blue), and 11 WT mice (black dotted line) was assessed by measuring CIPL (Corrected Integrated Path Length), an unbiased measure of learning in the Morris water maze test over 11 days of training. Data are represented as mean ± SEM. (B) Cumulative CIPL during the early phase (first 5 days) and the late phase (last 6 days) of training is depicted for WT, APPPS1 and APPPS1/HTTSA mice. All values are means ± SEM. Significance was determined using one-way ANOVA test followed by Tukey’s post-hoc analysis for multiple comparisons; *p<0.05, **p<0.01, ***p<0.001; ns = not significant. (C) Spatial memory of 11 WT, 7 APPPS1 and 11 APPPS1/HTTSA mice was assessed on a probe trial performed 72 hr after the last training day and during which the percentage of time spent in the target quadrant was quantified. All values are means ± SEM. Significance above the 25% chance level was determined using a one-sample t-test for each group. *p<0.05, ***p<0.001; ns = not significant. (D) Non-spatial memory of 24 WT, 18 APPPS1 and 21 APPPS1/HTTSA mice was assessed by the novel object recognition memory test. Memory index is calculated as the percentage of time spent exploring a novel object versus the time spent exploring both familiar and novel objects after a retention interval of 3 hr. All values are means ± SEM. A score of 50% indicates no preference (i.e., no memory). Performance significantly above the 50% chance level was determined using a one-sample t-test for each group. **p<0.01, ***p<0.001; ns = not significant.
We also subjected the mice to the novel object recognition test (Figure 9D). APPPS1 mice spent similar time investigating familiar and novel objects, indicating a memory deficit (indicated by a memory index close to 50%). In contrast, APPPS1/HTTSA mice behaved as WT mice and showed a marked preference for the novel object (significantly different from the theoretical 50% random score), suggesting that unphosphorylatable HTT can mitigate the memory deficit observed in APPPS1 mice.
We conclude that blocking Akt phosphorylation at HTT S421 reduces APP presynaptic levels, improving learning and memory in APPPS1 mice.Discussion
We used high-resolution live-cell imaging of isolated axonal and dendritic compartments in a mature corticocortical network-on-a-chip to investigate the influence of HTT phosphorylation on APP trafficking. We then evaluated the consequences of HTT phosphorylation on brain morphology and function in both wild-type mice and in transgenic mice with AD-like neuropathology. We propose a model in which axonal transport of APP, APP presynaptic levels, and synapse homeostasis require an intact Akt-HTT pathway.
HTT links APP axonal transport to presynaptic levels of APP
We find that axonal, but not dendritic, transport of APP is regulated by Akt-phosphorylated HTT. We previously showed that HTT phosphorylation at Serine 421 recruits kinesin-1 to the molecular motor complex and promotes anterograde transport of vesicles to the plus end of microtubules in axons (Colin et al., 2008). Given the mixed polarity of microtubules in dendrites (Kapitein and Hoogenraad, 2015; Yau et al., 2016), modifying HTT phosphorylation affects APP transport only in axons, where all the microtubules are oriented with the plus end towards the axon terminal. Our finding that the modulation of axonal transport of APP regulates synaptic APP homeostasis is in agreement with nerve ligation studies, which showed early on that blocking traffic from the entorhinal cortex to the dentate gyrus greatly reduced APP levels at the synapse (Koo et al., 1990). Results obtained by pulse-chase labeling experiments and unilateral lesions of the perforant path, a circuit by which axons from the entorhinal cortex connect to the dentate gyrus, also accord with these results (Buxbaum et al., 1998; Lazarov et al., 2002). Moreover, studies investigating the composition of APP vesicles report that most proteins co-transported with APP are presynaptic (Kohli et al., 2012; Szodorai et al., 2009) and that APP colocalizes with presynaptic proteins at the presynaptic bouton (Groemer et al., 2011). Notwithstanding the contribution of dendritic APP to synapse homeostasis (Niederst et al., 2015), our results demonstrate that APP levels at presynaptic membranes rely on HTT-dependent axonal transport.
HTT phosphorylation, APP presynaptic levels and synapse homeostasis
The absence of HTT phosphorylation reduced presynaptic levels of APP, restored synapse number and PSD length, and attenuated memory deficits in APPPS1 mice. In contrast, there was no effect of the HTT S421A mutation on amyloid plaques, on different pools of Aβ oligomers, or on extracellular and intracellular Aβ42 levels in brain, although the existence of a pool of vesicular presynaptic Aβ has been recently reported (Yu et al., 2018). These results suggest that HTT dephosphorylation regulates synapse homeostasis by modulating presynaptic APP levels rather than modulating APP-derived Aβ production. Notwithstanding the synaptic toxicity of Aβ peptides (Klementieva et al., 2017; Mucke and Selkoe, 2012; Palop and Mucke, 2010; Selkoe and Hardy, 2016; Wei et al., 2010), our findings dovetail nicely with previous results showing presynaptic APP contributes to synapse formation, function, and maintenance (Hoe et al., 2012; Müller et al., 2017; Nicolas and Hassan, 2014).
Our results are also in accord with reports that App knockout increases the number of functional synapses in vitro (Priller et al., 2006) and augments synaptic density in vivo, as visualized by two-photon in vivo microscopy through a cranial window (Bittner et al., 2009). Indeed, we found that reducing APP presynaptic levels by blocking HTT phosphorylation increases synapse density, and that this effect can be reversed by over-expressing APP in presynaptic neurons. Conversely, and again in agreement with previous studies (Alonso-Nanclares et al., 2013; Bittner et al., 2012; Priller et al., 2009), we found that overexpressing APP and PS1 mutations in vivo reduced synaptic density, an effect that can be restored by HTT-mediated reduction of APP presynaptic levels, without having significant effects on Aβ levels. Although the precise physiological function of APP at the synapse remains to be elucidated, changes in synapse homeostasis could be linked to the potential function of APP as an adhesion molecule that forms homo and/or heteromeric complexes with APP family members (Müller et al., 2017; Soba et al., 2005).
Relevance to disease pathogenesis
Our identification of an Akt-HTT pathway that regulates APP and synapse homeostasis might be of relevance for AD pathophysiology. Post-mortem analyses of AD patient brains report increased levels of activated Akt in mid-temporal and mid-frontal cortex soluble fractions (Rickle et al., 2004) as well as increased phosphorylation of Akt and of Akt substrates in membrane-bound fractions (Griffin et al., 2005). Our finding that inhibiting Akt-mediated HTT phosphorylation reduces APP presynaptic levels in APPPS1 mice suggests that increased Akt activity might contribute to higher presynaptic APP levels in AD brains, leading to synapse loss and cognitive decline. Our findings may also relate to studies that show rescue of synaptic and behavioral deficits in AD mouse models by knocking down the IGF-1 receptor and inhibiting the phosphoinositide three kinase (PI3K), which are upstream of Akt-HTT (Cohen et al., 2009; Humbert et al., 2002; Martínez-Mármol et al., 2019). Prior to this study, the JNK-interacting protein 1 (JIP1) was identified as a scaffold for APP (Muresan and Muresan, 2005). JIP1 determines the directionality of APP trafficking through its phosphorylation at a JNK-dependent phosphorylation site (Fu and Holzbaur, 2013) and could regulate amyloid-independent mechanisms of AD pathogenesis (Margevicius et al., 2015). This study and ours highlight the complexity of the regulation of APP trafficking in neurons, with different kinases (JNK and Akt) responding to specific signaling pathways.
Defects in APP trafficking could also contribute to synaptic defects observed in HD, as we found that the Akt-HTT pathway is down-regulated in HD patient brain samples and lymphoblasts as well as in HD rodent models (Colin et al., 2005; Humbert et al., 2002). Several studies have reported a notable reduction in the number of synapses particularly within the corticostriatal circuit, which is the most profoundly affected in HD (Virlogeux et al., 2018). A better understanding of HTT-APP relationship could help unravel mechanisms of interest for both Huntington’s disease and Alzheimer’s disease.