
PLD3 affects axonal spheroids and network defects in Alzheimer’s disease

By Peng Yuan, Mengyang Zhang, Lei Tong, Thomas M. Morse, Robert A. McDougal, Hui Ding, Diane Chan, Yifei Cai, and Jaime Grutzendler
Excerpt from the article published in Nature, 30 November 2022. DOI: https://doi.org/10.1038/s41586-022-05491-6
Editor’s Highlights
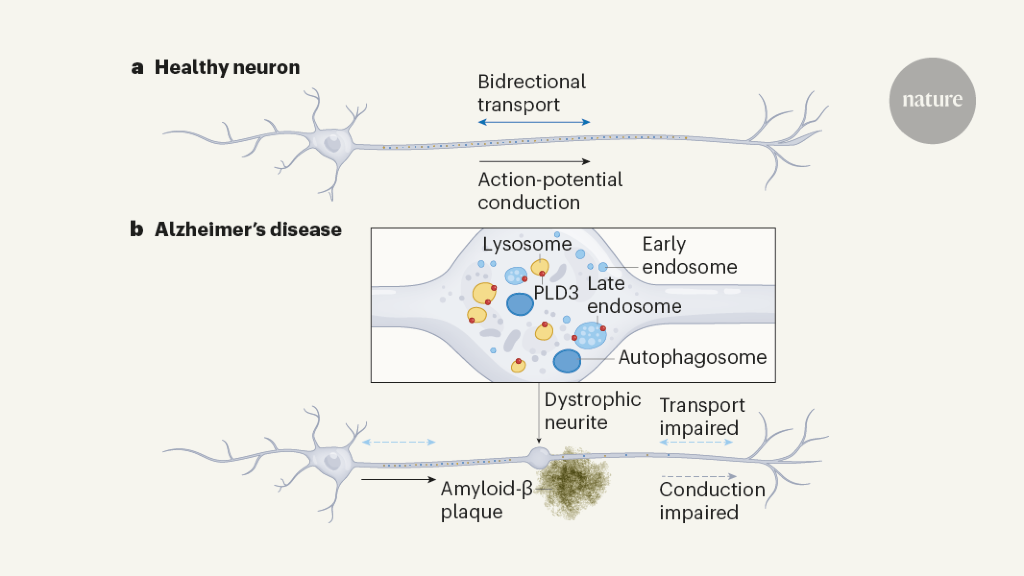
- Axonal spheroids are found abundantly around individual amyloid plaques in human patients with Alzheimer’s disease (AD).
- Hundreds of axons around each amyloid plaque develop spheroids and, rather than being retraction bulbs from degenerating axons, these structures are stable for extended periods of time and could therefore have an ongoing detrimental effect on neuronal connectivity.
- The glial microenvironment around plaques has been shown to have a key role in preventing the formation of plaque-associated axonal spheroids (PAASs).
- Spheroid growth is associated with an age-dependent accumulation of large endolysosomal vesicles and was mechanistically linked with Pld3—a potential Alzheimer’s-disease-associated risk gene that encodes a lysosomal protein.
- β42 accumulation within Multivesicular bodies (MVBs) may also impair the ubiquitin–proteasome system, leading to defects in protein sorting. Protein-sorting abnormalities could in turn exacerbate the accumulation of PLD3.
- PLD3 and Aβ may constitute a cycle in which axonal endocytosis and/or intracellularly produced Aβ facilitate the generation and accumulation of aberrantly enlarged lysosome-associated membrane protein 1 (LAMP1)-positive vesicles (ELPVs).
- Internalization of Aβ from extracellular deposits may be critical for PLD3-induced ELPV accumulation.
Abnormal protein aggregates are a hallmark of Alzheimer’s disease. It emerges that these plaques cause swellings in neuronal projections called axons that prevent proper circuit function. Inma Cobos & Jorge J. Palop
Abstract
The precise mechanisms that lead to cognitive decline in Alzheimer’s disease are unknown. Here we identify amyloid-plaque-associated axonal spheroids as prominent contributors to neural network dysfunction. Using intravital calcium and voltage imaging, we show that a mouse model of Alzheimer’s disease demonstrates severe disruption in long-range axonal connectivity. This disruption is caused by action-potential conduction blockades due to enlarging spheroids acting as electric current sinks in a size-dependent manner. Spheroid growth was associated with an age-dependent accumulation of large endolysosomal vesicles and was mechanistically linked with Pld3—a potential Alzheimer’s-disease-associated risk gene1 that encodes a lysosomal protein2,3 that is highly enriched in axonal spheroids. Neuronal overexpression of Pld3 led to endolysosomal vesicle accumulation and spheroid enlargement, which worsened axonal conduction blockades. By contrast, Pld3 deletion reduced endolysosomal vesicle and spheroid size, leading to improved electrical conduction and neural network function. Thus, targeted modulation of endolysosomal biogenesis in neurons could potentially reverse axonal spheroid-induced neural circuit abnormalities in Alzheimer’s disease, independent of amyloid removal.
Main
Alzheimer’s disease (AD) is a neurodegenerative condition that is characterized by widespread disruption in neural circuits and network connectivity4. The extracellular deposition of the β-amyloid (Aβ) peptide is thought to trigger a cascade of events, eventually leading to cognitive decline5. However, the cellular underpinnings linking Aβ deposition and neural network disruption are not well understood6, limiting the rational design of new therapies. Extensive previous research has focused on mechanisms such as synapse loss and cell death as potential causes of neural dysfunction7,8, and therapeutic efforts have mainly focused on strategies for extracellular amyloid removal9. However, an important and understudied pathological hallmark of AD is the markedly enlarged neuronal processes, traditionally termed dystrophic neurites, that are found around Aβ deposits10,11,12. These processes were previously shown to be all axonal rather than dendritic in origin13,14 (Fig. 1a,b), so we therefore name them plaque-associated axonal spheroids (PAASs). Although various hypotheses regarding their development have been proposed over the years15,16,17,18,19, these structures have not been a major focus of mechanistic investigation and their pathophysiological importance remains uncertain.
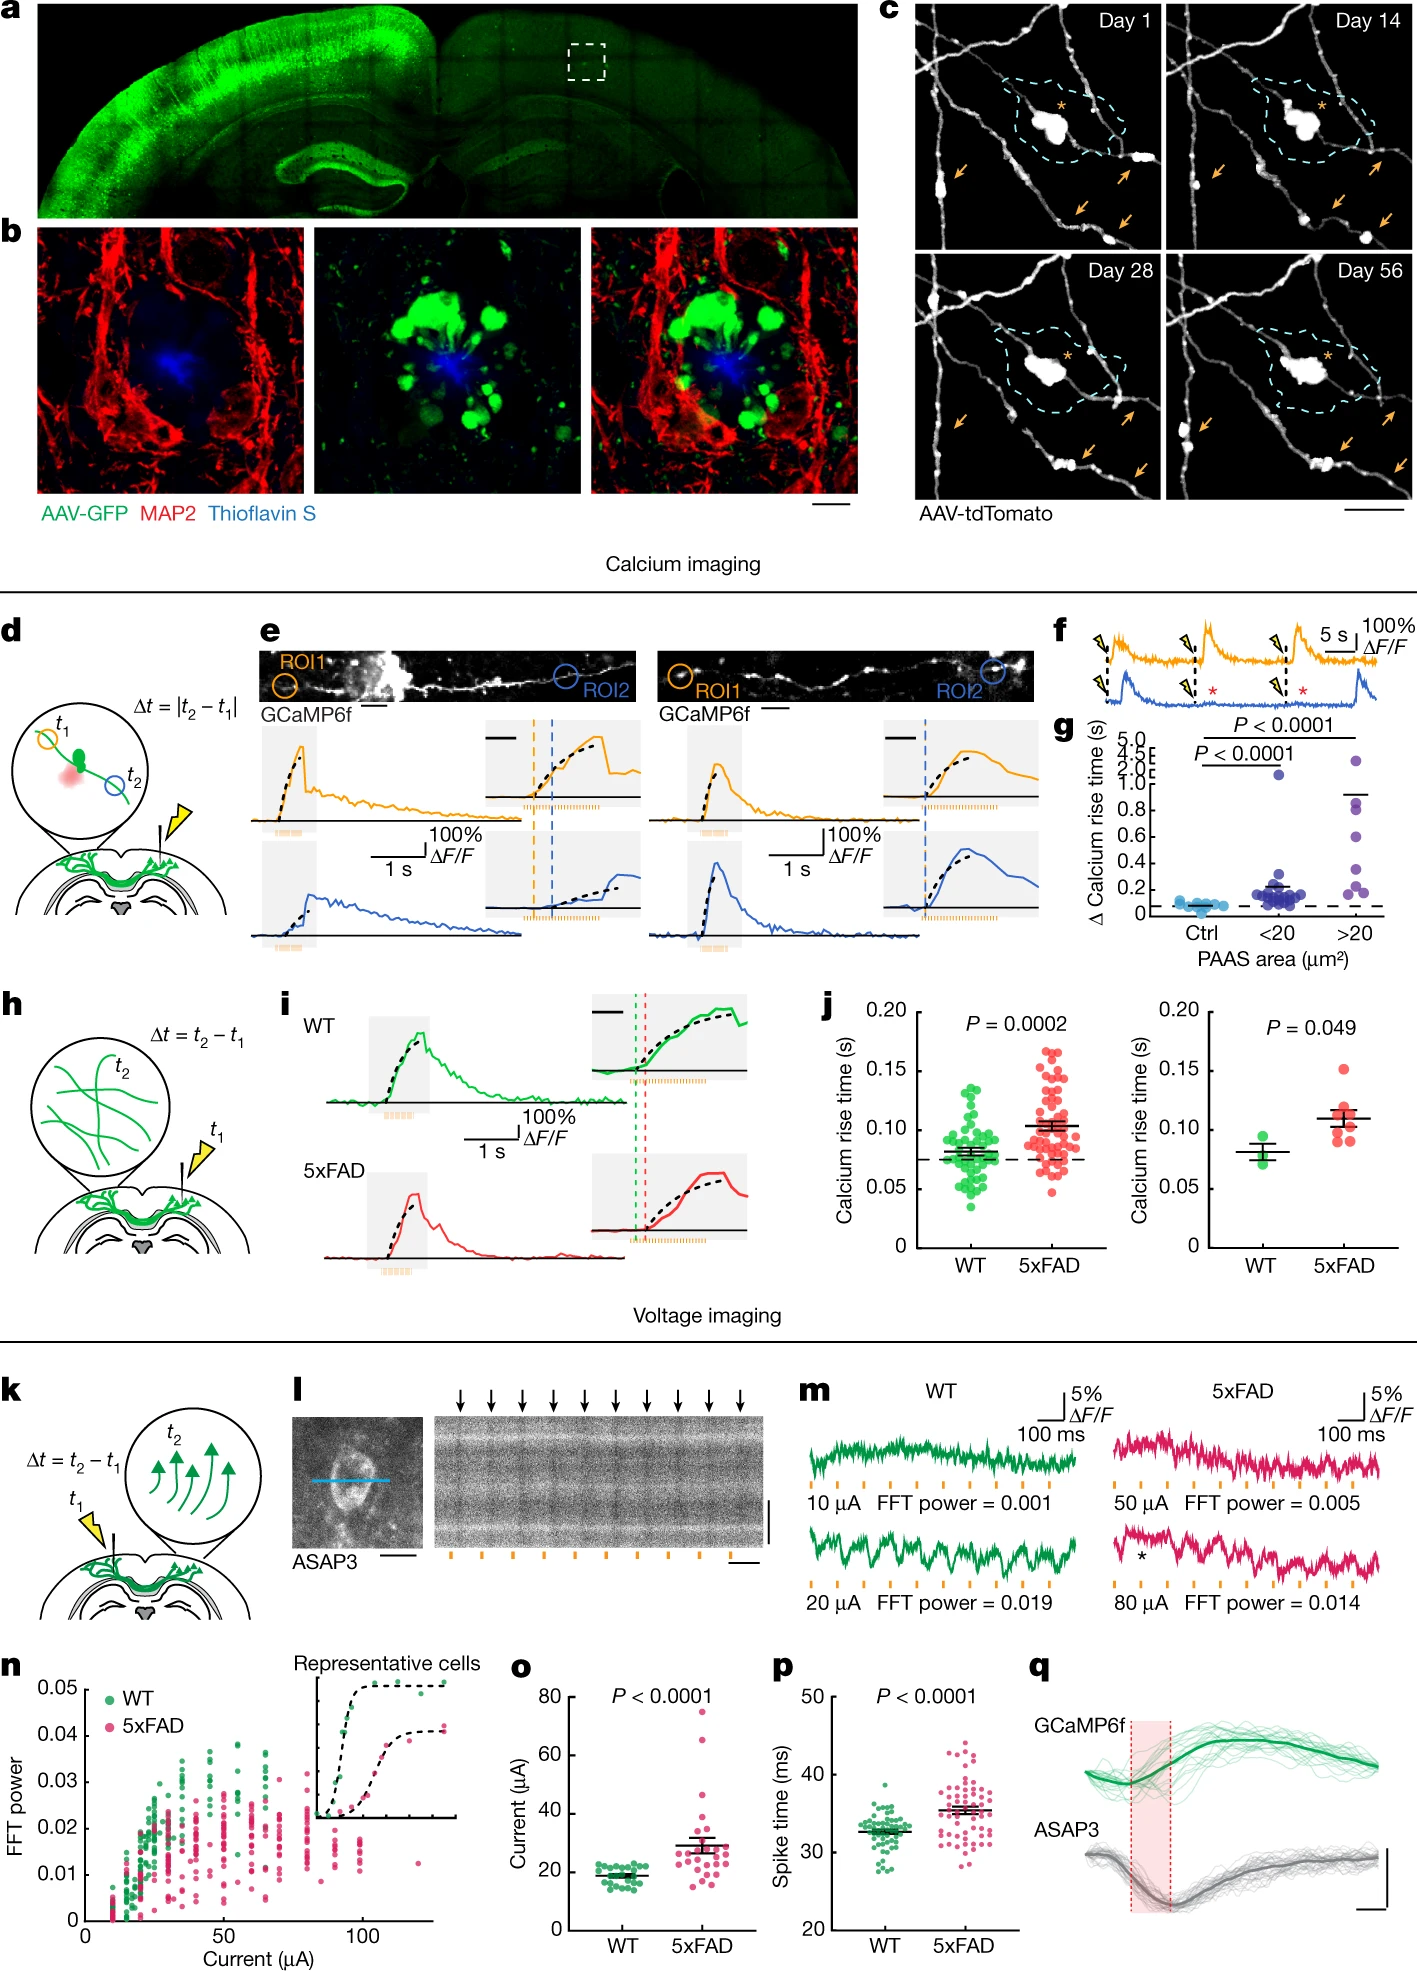
Plaque-associated axonal spheroids block AP propagation and disrupt interhemispheric connectivity.
a, Confocal images of a mouse brain after unilateral injection of AAV2-GFP. b, Images from the region in a indicated by a dashed box showing axonal spheroids that can only come from transcallosal projecting axons (green) that are not associated with the dendritic marker MAP2 (red). Scale bar, 5 μm. c, In vivo two-photon time lapse of axonal spheroids near an amyloid plaque (cyan dashed lines), showing dynamic (arrows) and stable (asterisk) structures. Scale bar, 5 μm. d, Schematics of axonal calcium imaging at two sides of an axonal spheroid (green) near a plaque (red) after electrical stimulation of the contralateral hemisphere. e, Example of GCaMP6f-labelled axons with (left) and without (right) spheroids and traces of axonal calcium dynamics in ROIs at both sides of the plaque (orange and blue). The y axis indicates the ΔF/F of calcium transients. The orange bars show the 50 Hz stimulus pulse train. The insets show magnified plots (grey rectangles). The black dotted lines indicate exponential regressions of the rising phase. The orange and blue dashed lines show estimated calcium rise times. Scale bars, 10 μm (top images) and 200 ms (insets). f, Traces showing conduction blockade (asterisks) after stimulation (yellow flash icons). g, Differences in estimated calcium rise times at axonal segments on both sides of an individual spheroid. n = 10, n = 21 and n = 8 axons for the no spheroid, small spheroid and large spheroid groups, respectively; obtained from n = 14 mice. h, Stimulation and calcium-imaging strategies to measure long-range interhemispheric axonal conduction. i, Traces of calcium dynamics in transcallosal axons imaged on the contralateral hemisphere. Scale bar, 200 ms (inset). j, The time interval between stimulation and the rise time presented by individual axons (left) or mice (right). n = 51 axons in n = 3 WT mice; n = 58 axons in n = 8 5xFAD mice. k, The strategy for axonal stimulation and two-photon voltage imaging of cell bodies to measure antidromic axonal conduction. l, Example of a voltage-sensor (ASAP3)-labelled cell body and the region of line scan (blue line) (left). Right, 1 kHz line scan kymograph after electrical stimulations (orange bars). The black arrows indicate APs. Scale bars, 10 μm (left and right vertical) and 100 ms (right horizontal). m, ASAP3 fluorescence traces. The orange bars indicate electrical stimulation. The electric current applied and the fast Fourier transform (FFT) power of 10 Hz are indicated below each trace. n, The probability of AP generation (FFT power) for each cell at a defined current. The inset shows examples of two individual cells at various current stimulations. o, The currents needed for 50% successful AP conduction for each cell (individual dots). n = 25 cells from n = 2 WT mice; n = 27 cells from n = 3 AD mice. p, The time interval between stimulation and AP spike time. n = 59 cells from n = 4 WT mice; n = 62 cells from n = 4 AD mice. q, The rise times (red shade) measured at the soma after stimulation of contralateral axons show similarity between GCaMP6f (green) or ASAP3 (grey). Scale bars, 10 ms (horizontal) and 1 arbitrary unit (AU) (vertical). Statistical analysis was performed using two-tailed Mann–Whitney U-tests (g, j(left), o and p) and a two-tailed paired t-test (j (right)). Data are mean ± s.e.m.
Here we undertook a multipronged approach to investigate PAASs using high-resolution structural imaging, time-lapse intravital calcium (Ca2+) and voltage imaging, as well as single-axon molecular manipulations and computational modelling. We found that hundreds of axons develop PAASs around each amyloid deposit and, rather than being associated with degenerative retracting neuronal processes, they are persistent and undergo dynamic changes in size over extended imaging intervals. PAASs markedly disrupt the propagation of action potentials (AP) by acting as electric current sinks in a spheroid-size-dependent manner, leading to abnormal long-range axonal connectivity and neuronal network dysfunction. We uncovered neuronal endolysosomal/multivesicular body (MVB) biogenesis as a critical determinant of PAAS size, and identified the neuronal lysosomal protein PLD3—a possible genetic risk factor for AD1,20,21—as a key mediator of endolysosomal abnormalities and PAAS enlargement. We further show that modulation of PLD3 levels can reverse axonal conduction abnormalities and restore neuronal network function in an AD mouse model. Together, our findings suggest a paradigm in which modulation of neuronal endolysosomal biogenesis can have a substantial effect on axonal electrical conduction and neural circuit function. Thus, targeting PAAS formation could be a strategy for ameliorating neural network abnormalities in AD.
Functional impact of axonal spheroids
Axonal spheroids are found abundantly around individual amyloid plaques in both AD-like mice and human patients with AD (Figs. 1b and 2i,l). On the basis of the average volume of individual PAASs and the total volume of the PAAS halo around plaques, we estimated that individual plaques can affect hundreds of axons on average (Extended Data Fig. 1a–c and Supplementary Discussion 1). Given the abundance of amyloid plaques in the AD brain, this suggests that substantial numbers of axons and their downstream interconnected neurons can be affected, highlighting the potential importance of PAASs as a mechanism of neural network dysfunction. In 5xFAD mice, time-lapse imaging of virally labelled axons around plaques revealed that PAASs can be very stable over intervals of up to months (Fig. 1c and Extended Data Fig. 1d–f). Although most PAASs increased in size over time, a substantial number decreased in volume or disappeared during this interval without the loss of the parent axon (Fig. 1c and Extended Data Fig. 1d–f), consistent with previous reports11,15. This supports the idea that PAASs are not a feature of degenerating axons but, rather, are stable structures that may affect neuronal circuits for extended intervals, while at the same time having the potential for reversibility.
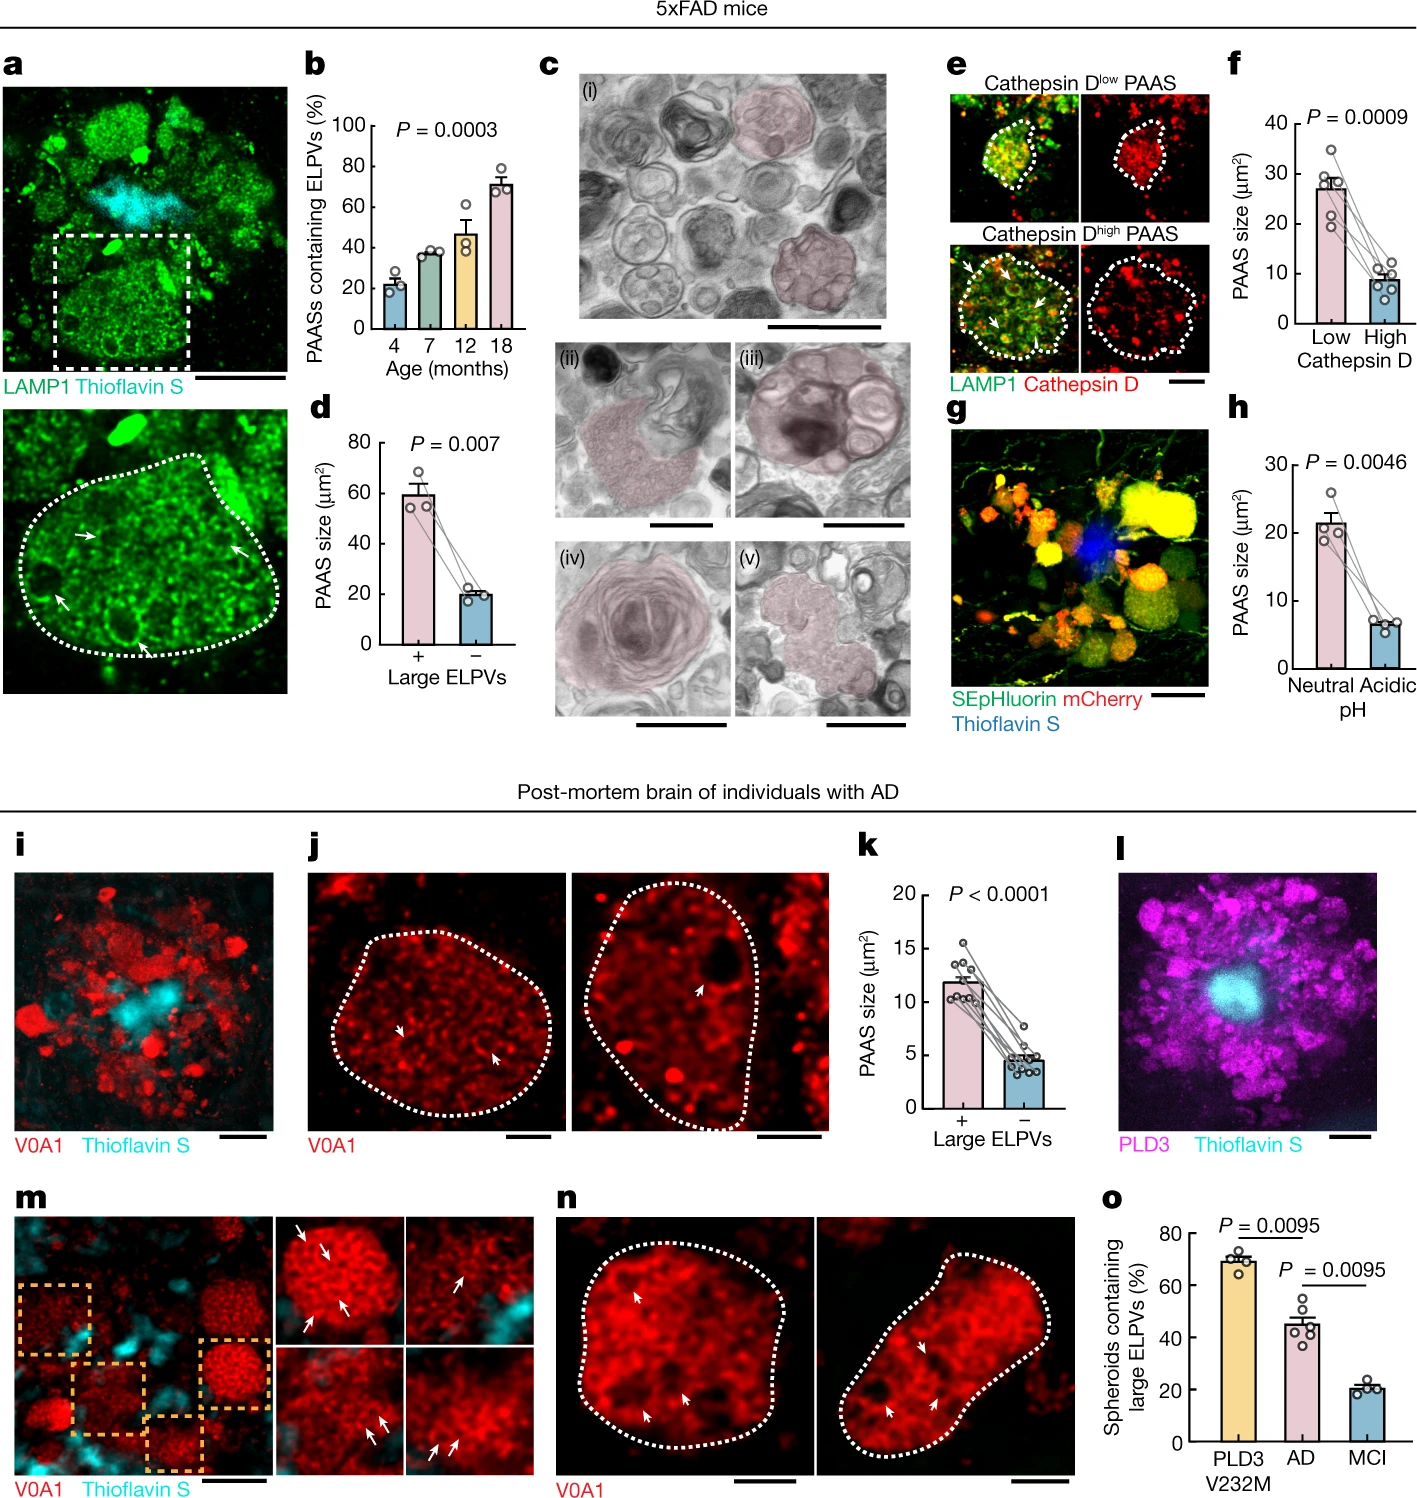
Accumulation of abnormally ELPVs is associated with spheroid expansion and cognitive decline.
a–h, Analyses in 5xFAD mice. a, Confocal image of spheroids labelled by LAMP1 (green) around an amyloid plaque (cyan). Bottom, magnified image (dashed box in the top image) of a large spheroid (white dotted outlines). The arrows indicate ELPVs. Scale bar, 10 μm. b, ELPV occurrence within spheroids at different ages in 5xFAD mice. n = 3 mice for each group. c, Electron microscopy images of spheroids showing diverse endolysosomal and autophagic vesicles (red shade). MVBs (i); an MVB, possibly fusing with an autophagosome (ii); an organelle with ILVs (iii); an autophagosome (iv); and the fusion of multiple MVBs (v) are shown. Scale bars, 500 nm. d, Spheroid size with the presence or absence of ELPVs. n = 3 mice from each group. e, Confocal images of spheroids (white dotted lines) with high or low levels of cathepsin D. Scale bar, 5 μm. f, Spheroid size as a function of cathepsin D levels. n = 6 mice for each group. g, Confocal image of spheroids expressing the pH sensor SEpHluorin-mCherry. Scale bar, 10 μm. h, Spheroid size as a function of pH (red–green fluorescence ratio). n = 4 mice for each group. i–o, Analyses of post-mortem brains of individuals with AD. i, Confocal image showing human spheroids around an amyloid plaque labelled by V0A1 (red). Scale bar, 10 μm. j, Confocal imaging of individual V0A1-labelled spheroids (white dotted lines). The arrowheads indicate enlarged vesicles. Scale bars, 2 μm. k, Spheroid size with the presence or absence of enlarged V0A1-labelled vesicles. n = 10 human individuals from each group. l, PLD3 (magenta) enrichment within spheroids. Scale bar, 10 μm. m,n, Confocal images of spheroids labelled with V0A1 in the brain of a human with AD with the PLD3(V232M) variant. Right, images of individual spheroids indicated by the orange boxes. Enlarged vesicles are indicated by arrows. The arrowheads indicate enlarged vesicles. Scale bars, 5 μm (m) and 2 μm (n). o, Occurrence of enlarged vesicle in PLD3(V232M) variant, AD and MCI post-mortem human brain tissues. n = 4 individuals with AD with the PLD3 variant, n = 6 individuals with AD and n = 4 individuals with MCI. Statistical analysis was performed using a Kruskal–Wallis test (b), two-tailed paired t-tests (d,f,h and k) and two-tailed Mann–Whitney U-tests (o). In all of the graphs, each pair of dots represents the average measurement from spheroids in the same mouse and data are mean ± s.e.m.
To examine how PAASs might disrupt neuronal circuits, we computationally modelled how these spheroids could affect axonal electrical conduction. We found that the likelihood of disruption in the conduction of APs, for a particular axonal segment, markedly increased as a function of the total PAAS surface area (Extended Data Fig. 2). This in silico model predicted that PAASs behave as capacitors that function as electric current sinks for incoming APs and can therefore cause conduction blocks or prolonged delays (Extended Data Fig. 2, Supplementary Discussion 2 and Supplementary Video 1). To experimentally examine the electrical conduction properties of axons, we developed a strategy for measuring the propagation of APs in individual axons through Ca2+ imaging in the live-mouse brain. We virally expressed the calcium sensor GCaMP6f through delivery of adeno-associated viral (AAV) vectors to one brain hemisphere (as in Fig. 1a) and performed Ca2+ imaging of individual projection axons on the contralateral cortex (Fig. 1d). We measured AP propagation after electrically stimulating the ipsilateral hemisphere with trains of electrical pulses and compared the rise times of Ca2+ transients at two regions of interest (ROIs) located on both sides of individual PAASs, along selected axonal segments (Fig. 1d). We found that the onset of the rise times was consistently delayed over intervals of tens to hundreds of milliseconds (Fig. 1e–g and Supplementary Video 2). Given that we used a series of pulses of electrical stimulation to induce trains of AP spikes, we concluded that the unusually long delays in the Ca2+ rise times observed were due to conduction blocks of a substantial proportion of individual AP spikes, once they reached individual spheroids (Extended Data Fig. 2b). By contrast, a comparison of the rise times at two ROIs in axon segments without spheroids or at ROIs located on the same side of axonal segments adjacent to spheroids (Fig. 1e (right)) demonstrated no difference in the onset of rise times, strongly suggesting a deleterious effect of PAASs, rather than a broad spheroid-independent disruption in axonal electrical conduction. Furthermore, in addition to electrically evoked responses, we also imaged spontaneous Ca2+ transients in individual axons and observed similar conduction abnormalities in segments with PAASs (Extended Data Fig. 3 and Supplementary Video 2). Regardless of whether the APs were the result of spontaneous or electrically induced neuronal activity, we observed that larger spheroids caused more severe conduction blocks (Fig. 1g and Extended Data Fig. 3d). These experimental observations were consistent with our computational modelling demonstrating that the size of individual PAASs is a critical determinant of the degree of axonal conduction defects (Extended Data Fig. 2f,f′).
Disruption of long-range connectivity
Given that we found marked abnormalities in local axonal conduction around plaques, we further investigated whether this was associated with more widespread defects in long-range cortical connectivity. Thus, we developed a strategy for measuring interhemispheric conduction velocity through calcium imaging in live 5xFAD mice. To achieve this, we stereotaxically injected AAV9-Syn-GCaMP6f to label a homogeneous population of closely located cortical neurons in the somatosensory cortex, which assured comparable axonal distances to the imaged regions on the contralateral hemisphere across different mice. We then imaged contralateral projecting axons while electrically stimulating the ipsilateral GCaMP6f-labelled neurons (Fig. 1h). We found that the interhemispheric conduction velocities in wild-type (WT) mice were of a similar magnitude to those previously reported using slice electrophysiology recordings22. However, in 5xFAD mice, we found that Ca2+ rise times in projecting axons were markedly delayed (Fig. 1i–j). This suggests that local AP conduction abnormalities caused by PAASs lead to a disruption in long-range axonal conduction. To further validate that our observations, as measured using calcium imaging, reflected actual AP delays or blockades, we implemented in vivo voltage imaging using the genetically encoded voltage sensor ASAP323. We intracortically injected AAV2-Syn-ASAP3 in the same manner as we did for GCaMP6f (Fig. 1k). Given the relatively low signal-to-noise ratio when imaging with genetically encoded voltage sensors23, it was not feasible to perform single-trial experiments to visualize AP propagation in individual axons. Instead, we stimulated axons in one hemisphere and recorded antidromic APs at neuronal cell bodies on the contralateral hemisphere (Fig. 1k,l), which markedly improved the signal-to-noise ratio. Using this strategy, we found that, in 5xFAD mice, there was a marked increase in the electric current required to induce the interhemispheric propagation of APs through single-trial stimulations (Fig. 1m–o), consistent with PAASs acting as current sinks. Furthermore, we also observed frequent delays in AP propagation when comparing 5xFAD and WT mice (Fig. 1p,qand Supplementary Discussion 3) in agreement with our Ca2+ imaging experiments. Together, our imaging data as well as our computational modelling highlight the prevalence of AP conduction blocks resulting from spheroid pathology in AD-like mice.
Given the long interhemispheric distances, the probability of axons encountering amyloid plaques and developing spheroids is high. Although the density of amyloid plaques in humans is lower than that in mice, we hypothesize that the much greater axonal lengths in humans markedly increase the probability of adjacency to amyloid plaques and the likelihood of disruption in axonal connectivity. In support of this idea, through a quantitative analysis of post-mortem brains, we found a greater average number of axonal spheroids per amyloid plaque and larger PAAS size in individuals with moderate to severe AD, compared with those with mild cognitive impairment (MCI) (Extended Data Fig. 4a–c), consistent with previous literature12,24. Although this clinical–pathological correlation has various limitations, it suggests that both PAAS number and size could be important factors that determine the degree of neural circuit disruption and cognitive deficits in AD.
Aberrant endolysosomes drive PAAS growth
High-resolution confocal imaging revealed that, as mice aged, there was a progressive accumulation of aberrantly enlarged lysosome-associated membrane protein 1 (LAMP1)-positive vesicles (ELPVs) within axonal spheroids (Fig. 2a,b). Transmission electron microscopy imaging revealed the accumulation of a heterogeneous population of vesicular organelles, including endosomes/MVBs, endolysosomes, amphisomes and autolysosomes (Fig. 2c and Extended Data Fig. 5), some of which could overlap with the ELPVs that we observed by optical imaging. This diversity potentially reflects distinct stages of organelle maturation through the lysosomal biogenesis and autophagic pathways25,26. There was a notable correlation between the presence of ELPVs and the overall size of individual spheroids (Fig. 2d). Furthermore, we also found that small PAASs were predominantly filled with vesicles that contained higher levels of the protease cathepsin D and were acidic—characteristic of more mature lysosomes (Fig. 2e–h and Extended Data Fig. 6f,g). By contrast, as PAASs increased in size, their overall acidification and cathepsin D levels declined (Fig. 2e–h and Extended Data Fig. 6f,g), consistent with the accumulation of ELPVs, which have not acquired sufficient lysosomal proteases and acidic pH27. Overall, this suggests that spheroid enlargement could be mechanistically linked to the accumulation of ELPVs.
Similar to mice, in post-mortem human brains, spheroids containing enlarged vesicles with low levels of cathepsin D (Fig. 2i,j and Extended Data Fig. 6a,b) were observed by immunolabelling of the lysosomal proton pump v-ATPase subunit V0A1 (Extended Data Fig. 6e,e′), and their presence was also associated with an overall larger spheroid size (Fig. 2k). Consistent with our observation that PAAS size is inversely correlated with premortem cognitive function (Extended Data Fig. 4b), we found a similar correlation between premortem cognition, the abundance of large ELPVs and low levels of cathepsin D within PAASs (Fig. 2o and Extended Data Fig. 6c,d). Together, our mouse and human data support a hypothesis in which the accumulation of ELPVs may drive the enlargement of axonal spheroids, leading to the disruption of axonal conduction and ultimately cognitive dysfunction.
Role of PLD3 in spheroid enlargement
We next investigated the potential mechanisms of ELPV accumulation within axonal spheroids. PLD3 is a lysosomal protein2,3,28 that is of potential interest because it strongly accumulates in axonal spheroids in both humans and mice28,29 (Figs. 2l and 3a) and its expression is not detectable in other cell types such as microglia and astrocytes (Extended Data Fig. 7), despite mRNA presence in glial cells30. Moreover, PLD3 genetic variants may increase the risk of AD, although this remains a controversial topic1,20,21. We found that there was an overall increased abundance of ELPVs in axonal spheroids of patients with AD who have the PLD3 variant V232M1 (Fig. 2m–o), suggesting a role of this variant in aberrant axonal endolysosomal function.
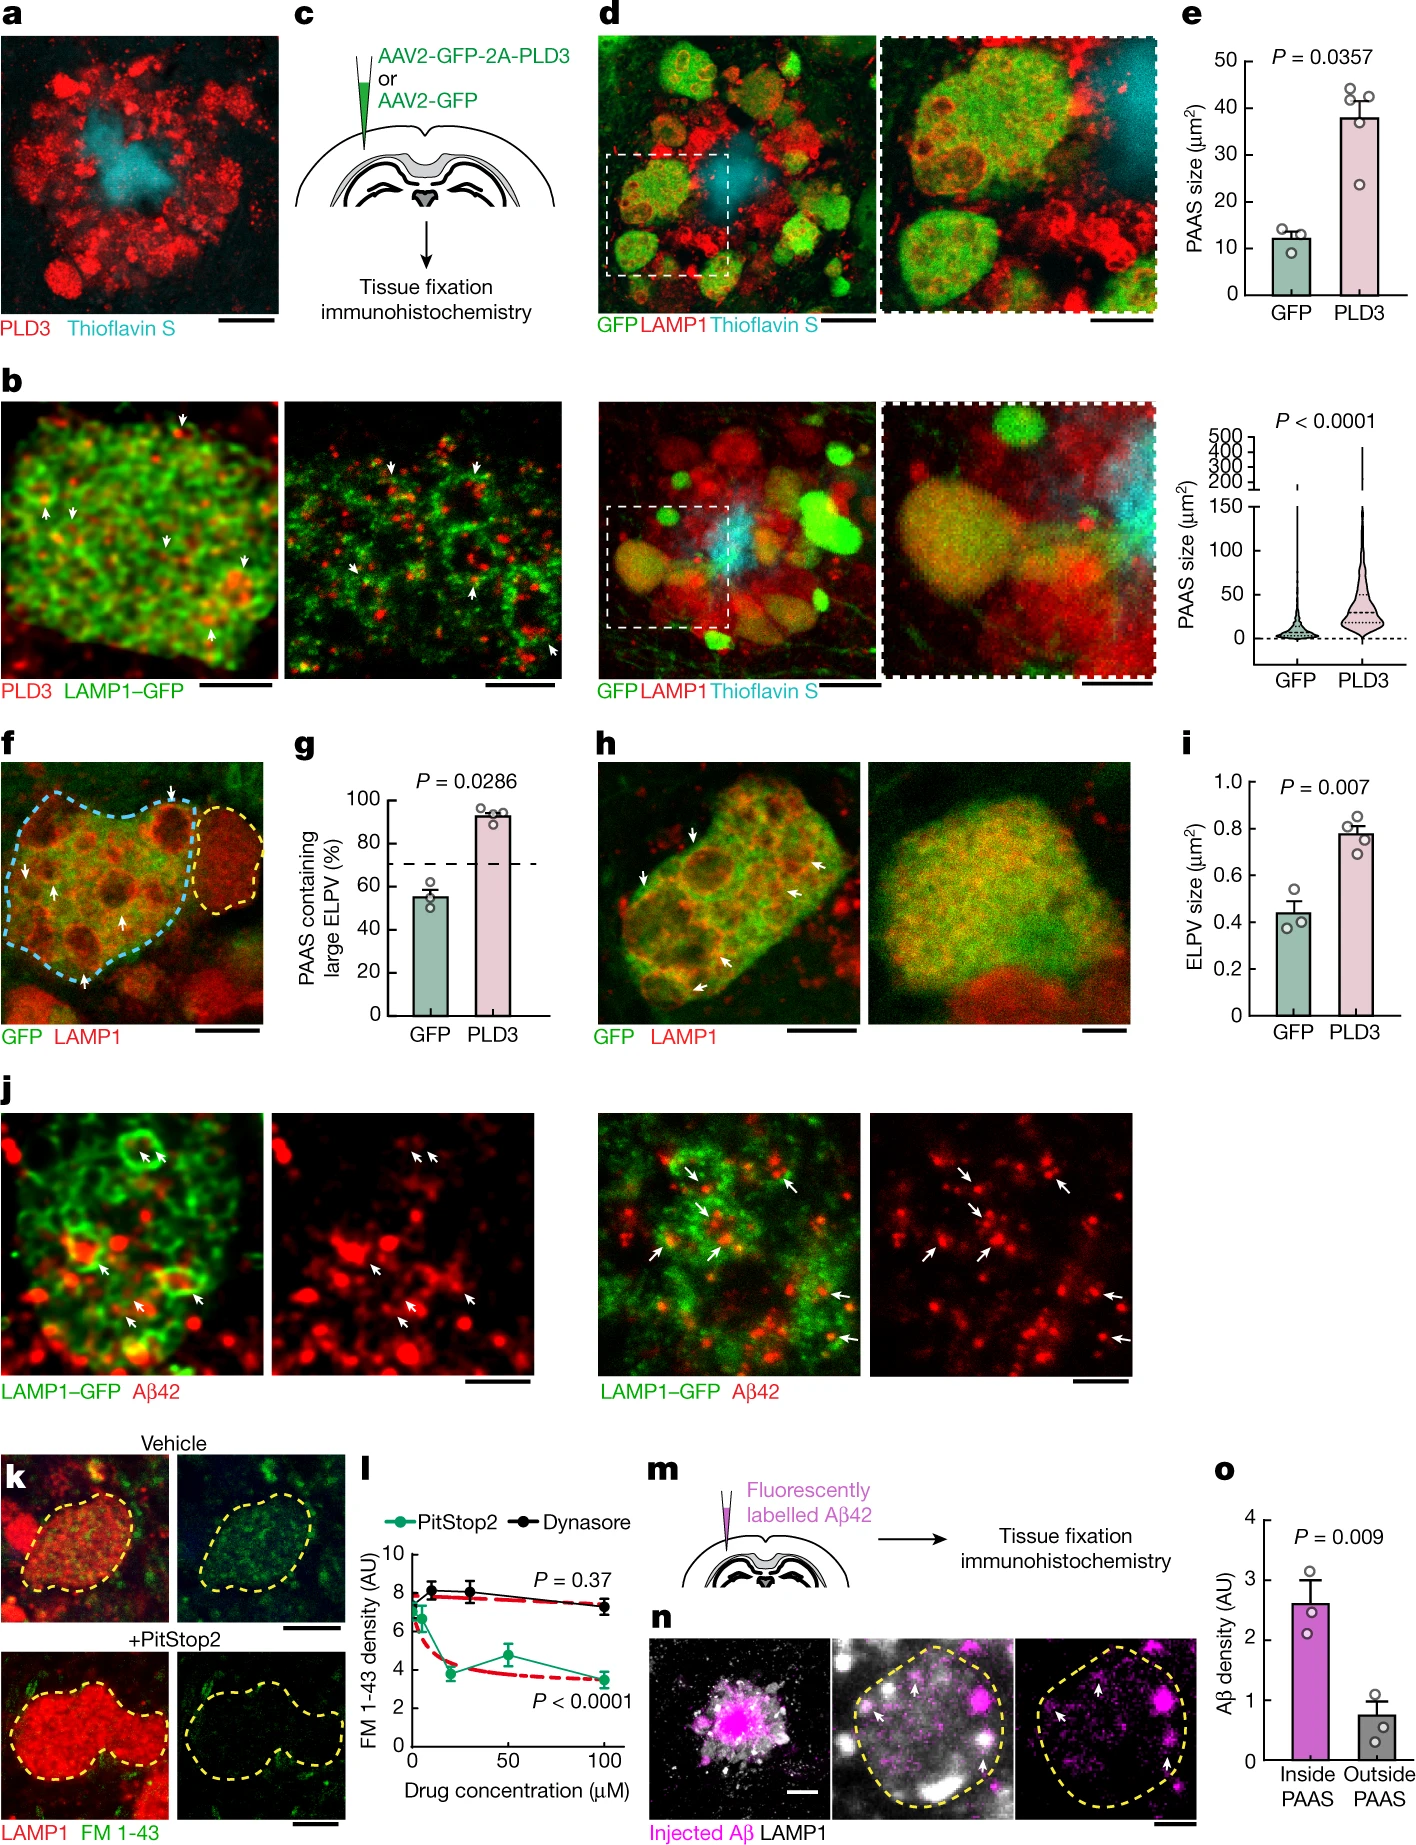
PLD3 mediates endolysosomal vesicle enlargement and spheroid expansion.
a, Confocal image showing the enrichment of PLD3 in spheroids in 5xFAD mice. Scale bar, 10 μm. b, Confocal (left) and expansion microscopy (right) images of PLD3 immunofluorescence (red) and LAMP1–GFP (green) in spheroids. The arrows indicate PLD3 puncta within ELPVs. Scale bars, 2 μm (left) and 5 μm (right). c, Schematics of AAV-mediated PLD3 overexpression. d, Confocal images of spheroids after PLD3 (top) or control GFP (bottom) overexpression in 10-month-old 5xFAD mice. Right, magnified image of the area indicated by a white dashed box. Scale bars, 10 μm (left) and 5 μm (right). e, Spheroid size in 10-month-old 5xFAD mice with PLD3 or GFP overexpression, quantified by individual mice (top) or spheroids (bottom). n = 3 and n = 5 mice for the GFP and PLD3 groups, respectively. Each dot represents average measurements from 350–600 individual PAASs. The violin plots show the distributions of around 1,000–1,500 individual spheroids from each group. f, Confocal images of adjacent spheroids with (blue dashed line) and without (yellow dashed line) PLD3 overexpression. The arrows indicate ELPVs. Scale bar, 5 μm. g, ELPV occurrence in spheroids of 10-month-old 5xFAD mice with PLD3 or GFP overexpression. n = 3 and n = 4 mice for the GFP and PLD3 groups, respectively. Each dot represents the average measurement from 150 to 200 individual spheroids. h, Confocal images of spheroids in 5xFAD mice with PLD3 (left) or GFP (right) overexpression. The arrows indicate ELPVs. Scale bars, 5 μm (left) and 2 μm (right). i, ELPV size in spheroids of 10-month-old 5xFAD mice with PLD3 or GFP overexpression. n = 3 and n = 4 mice for the GFP and PLD3 groups, respectively. Each dot represents the average measurement from 500–1,000 ELPVs. j, Confocal (left two images) and expansion microscopy (right two images) images of Aβ42 immunofluorescence (red) and LAMP1–GFP (green) within spheroids. The arrows indicate Aβ42 puncta contained within ELPVs. Scale bars, 2 μm (left two images) and 5 μm (right two images). k, Confocal images showing incorporation of FM 1-43 dye into spheroids in cultured brain slices after treatment with vehicle or PitStop2. Scale bars, 10 μm. l, Quantification of FM 1-43 incorporation into PAASs after PitStop or Dynasore treatment. n = 20 spheroids for each group. The red dashed lines show regression to a sigmoid inhibition curve. m, In vivo assay to measure Aβ endocytosis into spheroids after intraparenchymal brain microinjections of fluorescently labelled Aβ42 peptide. n, Confocal images of fluorescently tagged Aβ42 (magenta) incorporated into spheroids (white). The arrows indicate Aβ42 puncta. Scale bars, 10 μm (left) and 5 μm (middle and right). o, Quantification of Aβ42 incorporation into spheroids. n = 3 mice, each with average measurements from n = 10 fields of view. Statistical analysis was performed using two-tailed Mann–Whitney U-tests (e and g) and two-tailed Welch’s t-tests (i and o), and F-tests were used to compare the fitted top and bottom parameters for each group in l. Data are mean ± s.e.m.
During endolysosomal maturation, the limiting membrane of late endosomes invaginates to form intraluminal vesicles (ILVs) and become MVBs that fuse with lysosomes25. Furthermore, autophagic degradation also requires the fusion of autophagosomes and MVBs, forming amphisomes that later fuse with lysosomes31. Thus, MVBs are crucial intermediate organelles that connect with various components of endocytosis, autophagy and lysosomal degradation26,31 (Extended Data Fig. 5). PLD3 is unique among lysosomal-resident proteins in that it is sorted to the ILVs of MVBs3, in contrast to most lysosomal-resident proteins, which are sorted to the limiting membranes of MVBs32. Indeed, immunofluorescence confocal and expansion microscopy imaging of axonal spheroids showed an accumulation of a punctate PLD3 signal within the lumen of LAMP1-positive vesicular structures (Fig. 3b), similar to previous immunogold electron microscopy analysis of cultured cells3. Together, these observations raise the possibility that PLD3 may have a role in MVB biogenesis, thereby affecting various organelles that interact with MVBs. This may lead to the accumulation of ELPVs, driving the expansion of axonal spheroids.
To further understand the role of PLD3 in the evolution of axonal spheroid pathology, we implemented in vivo AAV2-mediated overexpression of PLD3 in neurons of 5xFAD mice (Fig. 3c). We observed that spheroids in PLD3-overexpressing axons were markedly larger than those expressing only green fluorescent protein (GFP) (Fig. 3d,e and Extended Data Fig. 8a,b′). Notably, confocal microscopy of individual spheroids revealed an increase in the number of large ELPVs, even beyond what is seen in older 5xFAD mice (Fig. 3f,g and Extended Data Fig. 8c,d). Furthermore, there was a marked increase in ELPV size within PLD3-overexpressing spheroids compared with the GFP-expressing controls (Fig. 3h,i). This manipulation was not associated with changes in amyloid plaque number or size (Extended Data Fig. 8e,f), suggesting that PLD3 overexpression does not affect the processing of amyloid precursor protein (APP), in agreement with previous in vivo and in vitro experiments2.
The effect of PLD3 overexpression on the accumulation of large LAMP1-positive vesicles was predominantly seen in axonal spheroids around plaques rather than in neuronal cell bodies (Extended Data Fig. 8g,h). This suggests that extracellular Aβ deposits are critical for PLD3-induced endolysosomal abnormalities in axonal spheroids. Indeed, using an antibody that specifically recognizes the Aβ42 peptide, we observed Aβ accumulation within large ELPVs in spheroids (Fig. 3j). The source of Aβ42 within ELPVs is likely to be the endocytosis of oligomeric peptides from adjacent amyloid plaques. This is supported by our data showing that spheroids are sites of active endocytosis (Fig. 3k,l), and that administration of fluorescently labelled Aβ42 to 5xFAD mice leads to robust uptake into vesicular structures within spheroids (Fig. 3m–o). Previous reports have demonstrated the formation of ELPVs in vitro after Aβ administration33. Furthermore, our data with PLD3 overexpression in WT mice also led to occasional formation of small axonal swellings with ELPVs (Extended Data Fig. 8i), suggesting that excessive PLD3 by itself can have detrimental effects, independent of amyloidosis. Together, these data suggest that the accumulation of PLD3, observed in both mice and humans, is mechanistically linked with endolysosomal abnormalities and the subsequent enlargement of axonal spheroids. This may be compounded by the concurrent effect of PLD3 and Aβ accumulation within the same subcellular compartments.
Pld3 deletion restores axonal conduction
To assess whether reducing PLD3 levels would ameliorate axonal spheroid pathology, we deleted Pld3 in neurons using AAV2-mediated CRISPR–Cas9 gene editing in 5xFAD mice, using either of two single guide RNAs (sgRNAs), targeting different Pld3 exons (Fig. 4a and Extended Data Fig. 9). We found that treatment with both sgRNAs led to a marked decrease in the abundance of large ELPVs (Fig. 4b,c and Extended Data Fig. 10d), which was associated with an overall reduction in PAAS size, regardless of whether the treatment was initiated at 3 or 7 months of age in 5xFAD mice (Fig. 4d–e and Extended Data Fig. 10a–c′). These data demonstrate that Pld3 deletion at early or later stages of amyloid deposition can decrease ELPV accumulation in axons, leading to a marked reduction in spheroid growth, without any changes in amyloid plaque number or size (Extended Data Fig. 10e,f).
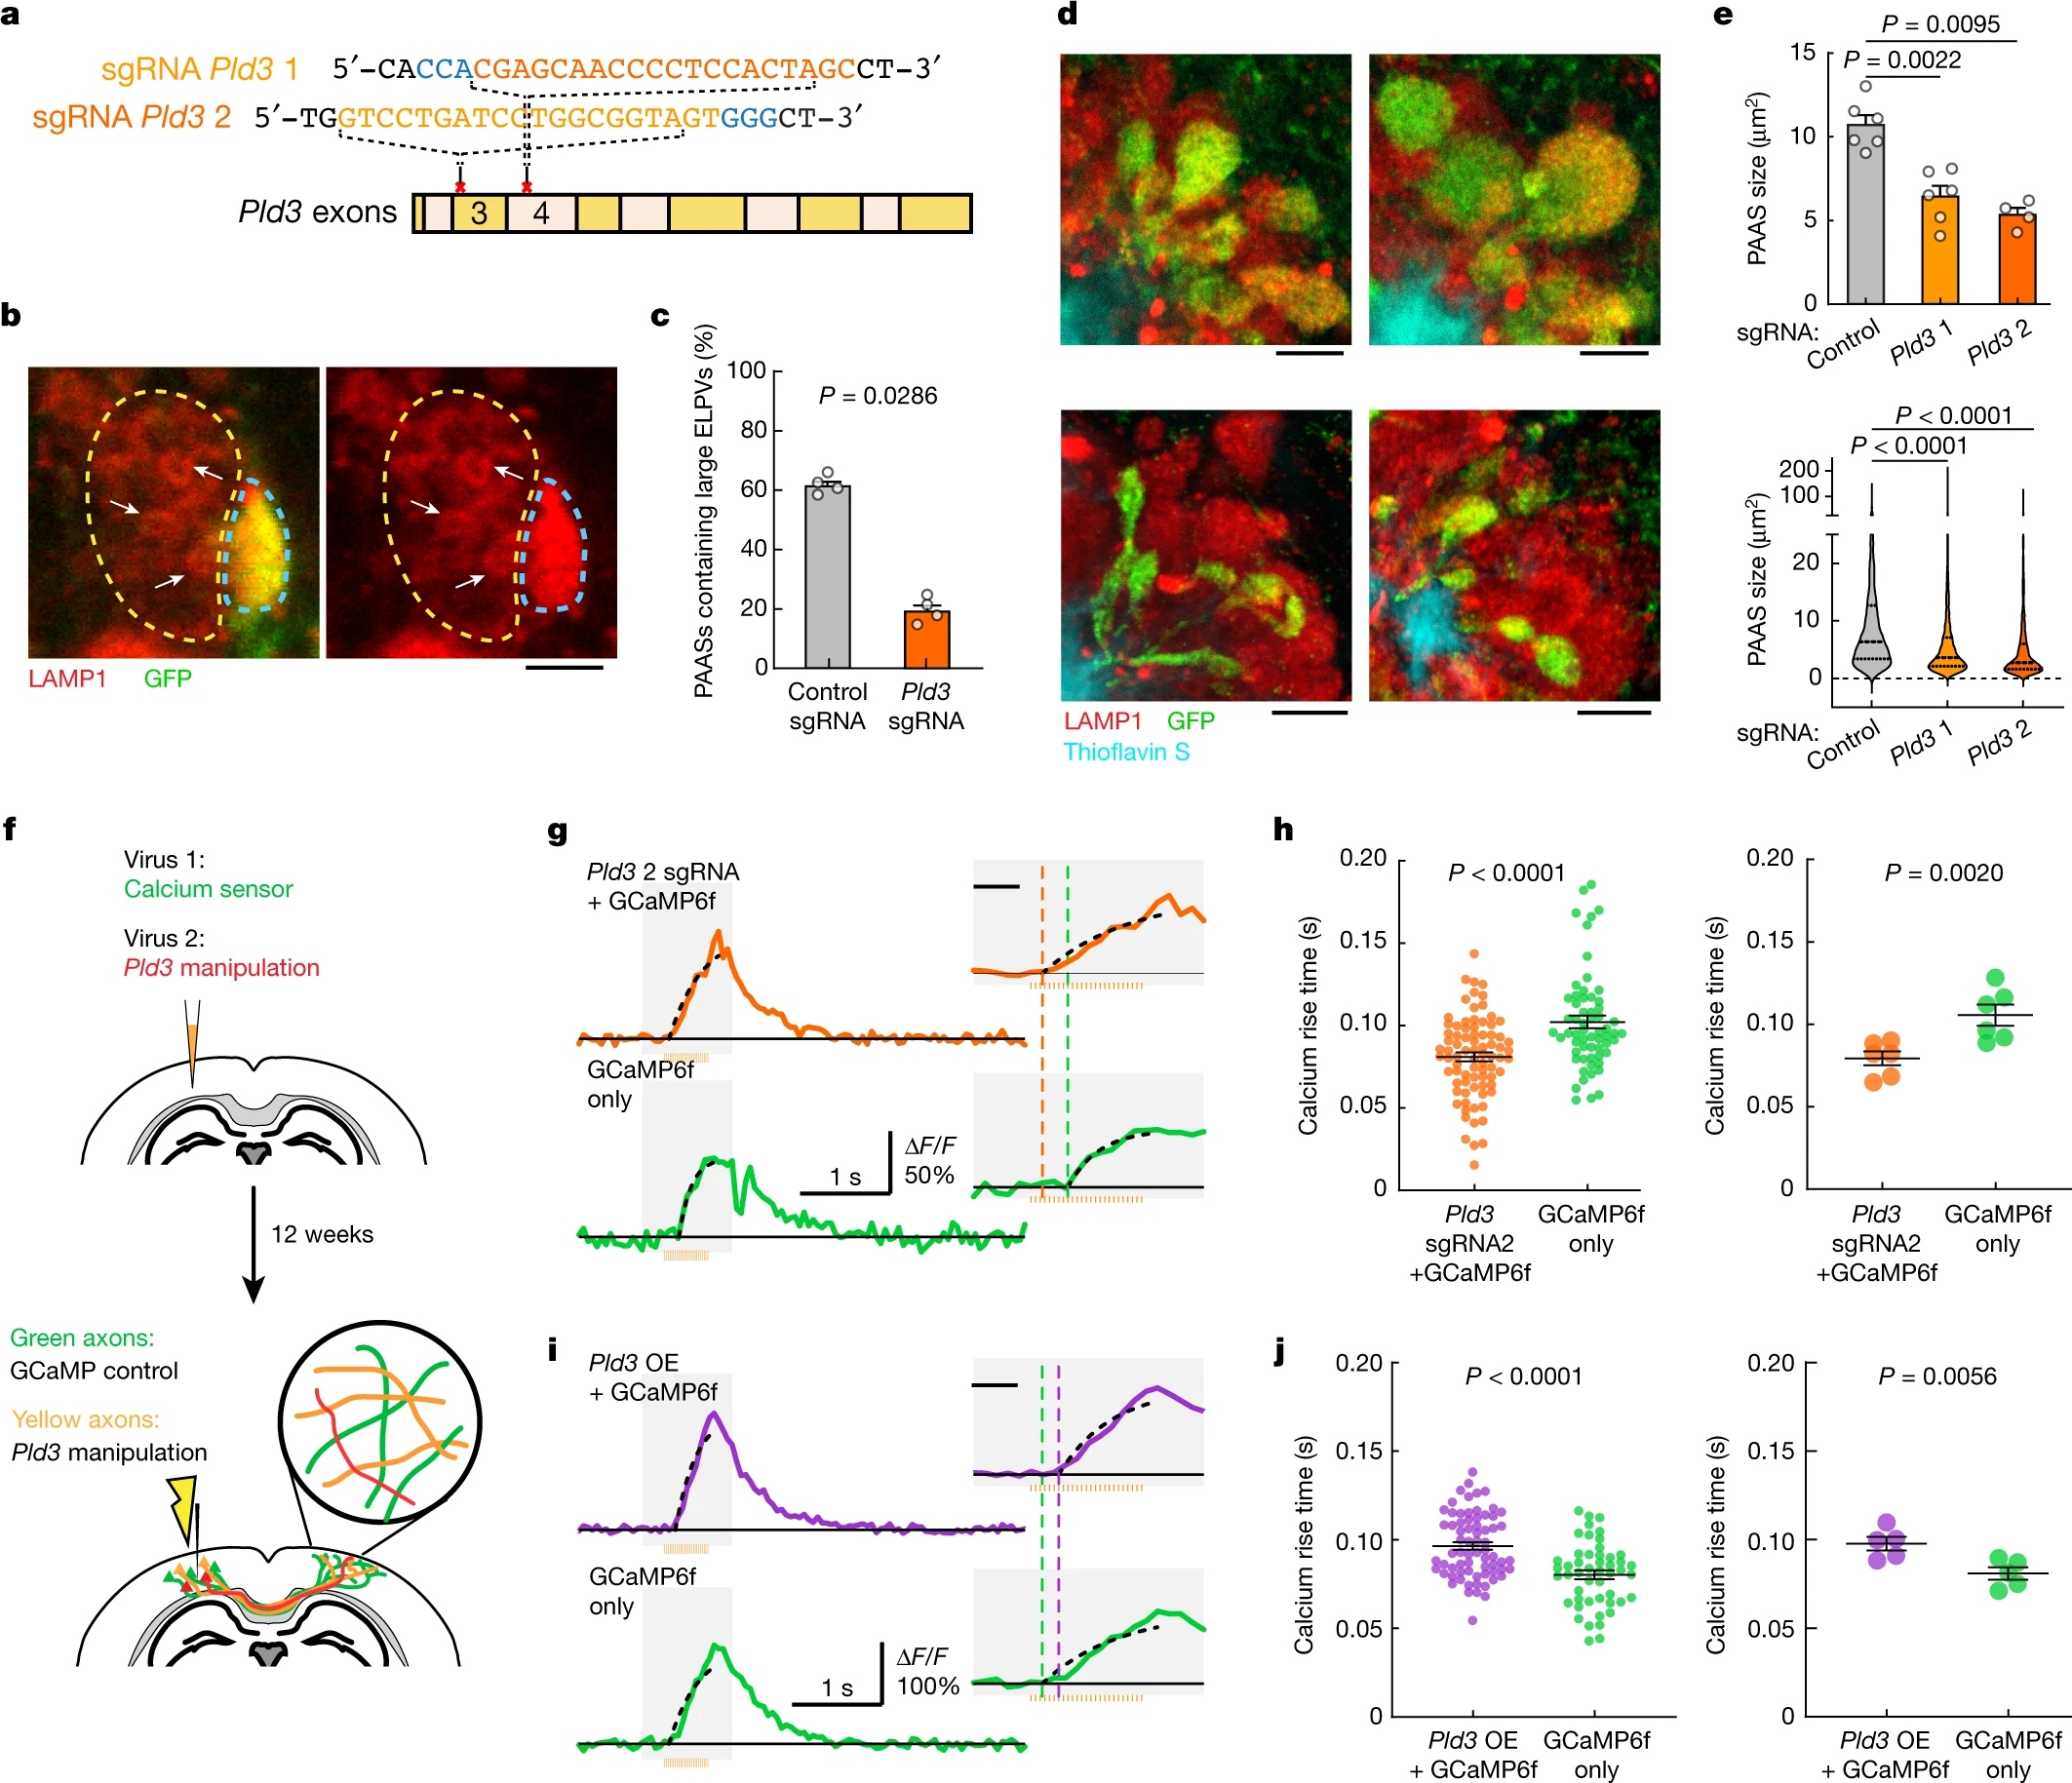
CRISPR–Cas9-mediated Pld3 deletion reduces spheroid size and improves axonal conduction.
a, The design of two guide RNAs targeting the Pld3 gene. b, Confocal images of adjacent spheroids with (blue dashed line) and without (yellow dashed line) Pld3 deletion. The arrows indicate ELPVs. Scale bar, 2 μm. c, ELPV occurrence in Pld3-deleted and control PAASs in 10-month-old 5xFAD/LSL-Cas9 mice. n = 4 mice for each group. Each dot is the average measurement of 150 to 250 individual spheroids. d, Confocal images of spheroids expressing control sgRNA (top) or Pld3-targeting sgRNA (bottom) in 10-month-old mice, showing infected (GFP+) and uninfected (red) spheroids around an amyloid plaque (cyan). Scale bars, 5 μm. e, Spheroid sizes in 10-month-old mice with or without Pld3 deletion, presented by individual mice (top) or individual spheroids (bottom). n = 6, n = 6 and n = 4 mice for control sgRNA, Pld3 sgRNA 1 and Pld3 sgRNA 2, respectively; each dot represents the average measurements of 350–600 individual spheroids (top). The violin plots show the distributions of around 1,200–2,600 individual PAASs from each group (bottom). f, Schematics of calcium imaging to measure conduction in contralateral axons with (yellow) or without (green) Pld3 manipulation. g,i, Example traces of calcium dynamics in contralateral axons after Pld3 deletion with sgRNA 2 (g) or overexpression (i). The orange bars show the 50 Hz spike train for stimulation. The insets show magnified plots of the calcium transients (grey rectangles). The black dotted lines indicate exponential regressions of the rising phase and the coloured vertical dashed lines show the estimated spike times. For the insets in g and i, scale bars, 200 ms (insets). h,j, Spike times in Pld3-deletion (h), Pld3-overexpression (OE) (j) or control axons, shown by either individual axons (left) or mice (right). n = 80 manipulated and n = 61 control axons from n = 6 mice with Pld3 deletion; n = 69 manipulated and n = 49 control axons from n = 5 mice with Pld3 overexpression. Statistical analysis was performed using two-tailed Mann–Whitney U-tests (c,e,h (left) and j (left)) and two-tailed paired t-tests (h (right) and j (right)). Data are mean ± s.e.m.
To test whether deletion of Pld3 in neurons and the consequent reduction in spheroid size had a beneficial effect on axonal conduction, we co-infected neurons with AAV2-U6-sgRNA(Pld3)-CAG-Tomato-P2A-Cre to delete Pld3 and AAV9-Syn-GCamP6f to implement our Ca2+-imaging approach for measuring interhemispheric axonal conduction (Fig. 4f). This coinfection strategy enabled us to image adjacent axons with or without Pld3 deletion within the same mouse and compare the Ca2+ rise times in the contralateral cortex after electrical stimulation of the ipsilateral hemisphere (Fig. 4f). Using the two sgRNAs, we found that axons with Pld3 deletion had a marked improvement in the propagation of APs (Fig. 4g,h and Extended Data Fig. 11a,a′,c,d′) that approached what we observed in control non-AD mice (Fig. 1j). By contrast, PLD3 overexpression had the opposite effect, with worsening of AP propagation observed in axons with increased PLD3 compared with adjacent controls (Fig. 4i–j and Extended Data Fig. 11b,b′). Together, these data demonstrate that PLD3 reduction can ameliorate endolysosomal abnormalities in axons near plaques, leading to reduced spheroid size and restored axonal conduction properties.
PAAS reduction improves network function
To examine the effect of reversing spheroid-associated axonal conduction defects on neural circuit function, we focused on the basal forebrain nucleus of Meynert, which is a major source of cholinergic neurotransmission with widespread axonal projections that exert complex neuromodulatory effects on cortical neurons34. Furthermore, cholinergic networks are critical for normal cognitive function and are affected in the early stages of AD35. We therefore investigated the potential network effects of spheroid-induced conduction deficits and their potential reversibility by PLD3 modulation.
To achieve this, we injected AAV2-U6-sgRNA(Pld3)-CAG-Tomato-P2A-Cre to delete Pld3 in neurons of the basal forebrain in 7-month-old 5xFAD mice. To examine the effect of improved basal forebrain neurotransmission, we imaged spontaneous Ca2+ transients during awake resting sessions in neurons of layer 2/3 of the somatosensory cortex, previously infected with AAV9-Syn-GCamP6f (Fig. 5a–c and Supplementary Video 3). These neurons were within the immediate vicinity of projecting basal forebrain axons (Fig. 5a (right)). We observed a higher proportion of hyperactive neurons in 5xFAD mice (Fig. 5d), consistent with previous reports36. Moreover, we also found that 5xFAD mice showed increased correlated activity in neurons that were in proximity to each other (Fig. 5e) and displayed activity patterns with higher spatiotemporal similarities (Fig. 5f,g). These aberrant patterns of activity are relevant because they are predicted to markedly disrupt efficient information encoding37. Pld3deletion in basal forebrain neurons led to a reduction in such aberrant cortical neuronal activity patterns to levels that were similar to WT controls (Fig. 5d–g). These data demonstrate that reversing spheroid-induced AP blockades in basal forebrain projection axons, which potentially improves neuromodulatory neurotransmission, can ameliorate the aberrant patterns of activity of downstream cortical neurons.
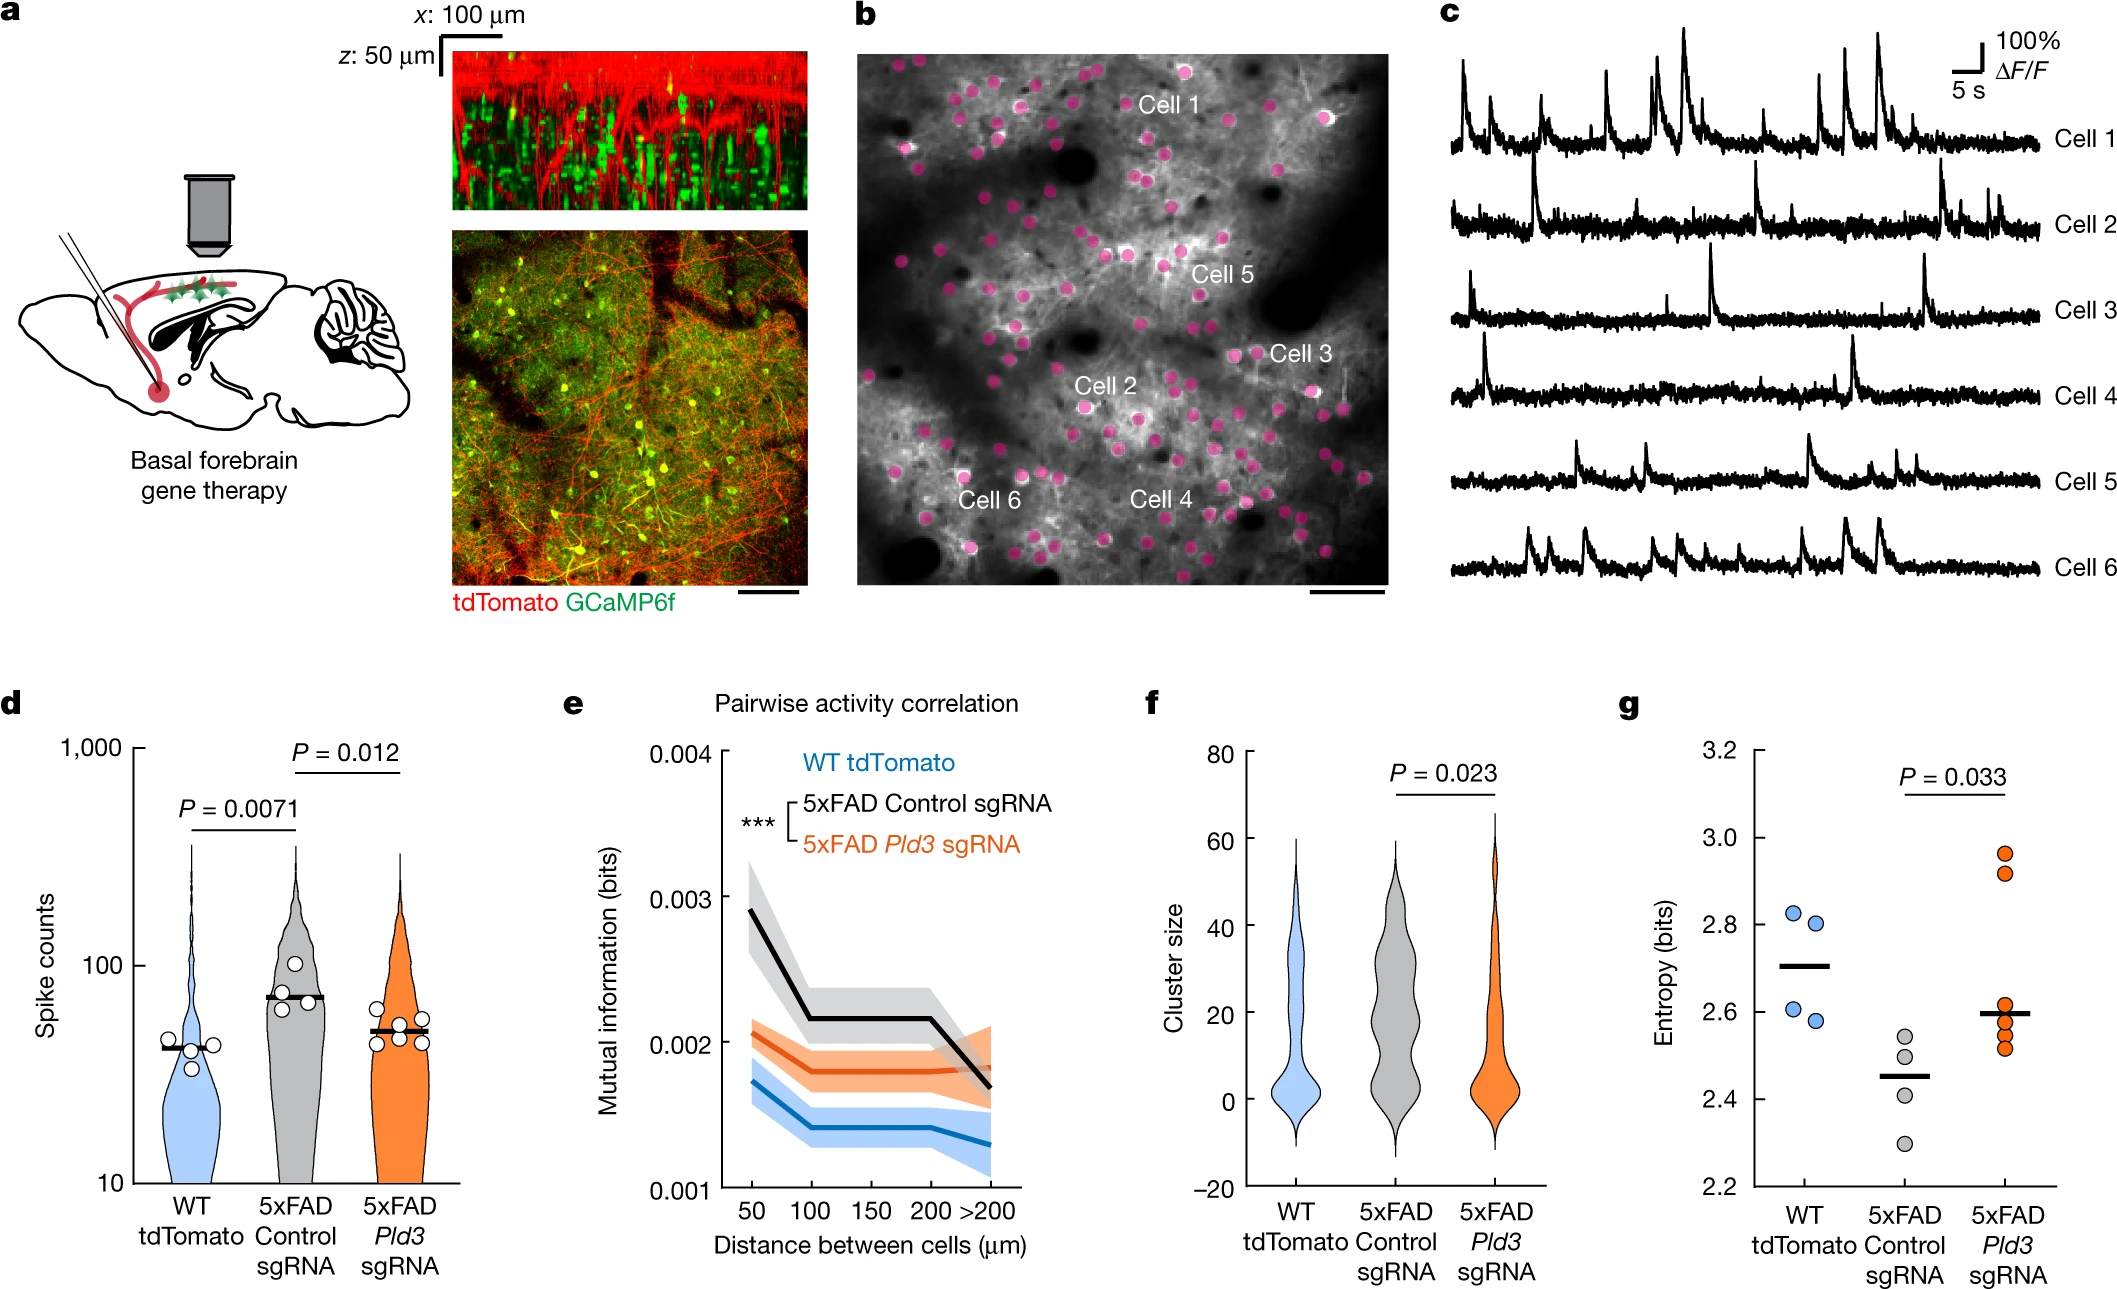
Reduction in axonal spheroids by Pld3 deletion improves neural circuit function.
a, Schematics of cholinergic neurons in the basal forebrain projecting to the cortex, infected with AAV viruses encoding either Pld3 or control sgRNAs (left). Right, two-photon images showing intermingled projecting basal forebrain axons (red) from the basal forebrain (red) with GCaMP6f-labelled cortical neurons (green). Scale bar, 100 μm. b, Representative two-photon image of GCaMP6f-labelled cortical neurons (purple dots). Scale bar, 50 μm. c, Example raw calcium traces from individual cortical neurons. d, Single-cell spike counts from individual neurons during a 30 min imaging session. Each dot represents the average spike count from all cells in the same mouse. The violin plots show distributions of spike counts from all individual neurons. e, Pairwise mutual information grouped by the distances between neurons. Data are mean ± s.e.m. Two-way analysis of variance was used to compare between groups. f, Neuron cluster size distributions classified by activity patterns (Louvain clustering; Methods). g, Quantification of population entropy (a measurement of temporal variance of the firing pattern) from each mouse imaged. For d,e and g, n = 4, n = 4 and n = 6 mice in the WT group, 5xFAD with control sgRNA group and 5xFAD with Pld3 sgRNA group, respectively. For f, n = 67, n = 21 and n = 45 clusters in the WT group, 5xFAD with control sgRNA group and 5xFAD with Pld3 sgRNA group, respectively. For d,f and g, statistical analysis was performed using one-way analysis of variance to compare among groups and the P values indicate a post hoc comparison between the groups, with Sidak’s correction for multiple comparisons. For d and g, the bars indicate the group mean.
Discussion
Here we show that hundreds of axons around each amyloid plaque develop spheroids and, rather than being retraction bulbs from degenerating axons, these structures are stable for extended periods of time and could therefore have an ongoing detrimental effect on neuronal connectivity. Given the similarity in the morphology, organelle and biochemical content of PAASs in mice and humans, it is probable that, in humans, these are also stable structures that could disrupt neural circuits for extended intervals. To better understand the effect of PAASs on axonal function, we implemented in vivo Ca2+ and voltage imaging in individual cortical axons and cell bodies. Both Ca2+ and voltage imaging revealed that a substantial proportion of axons in 5xFAD mice had disrupted AP conduction and an overall increase in the threshold for AP propagation manifested by conduction blockades. This was due to the presence of axonal spheroids and was shown to be correlated with their size. The finding that larger PAASs caused more severe conduction blocks was consistent with computational modelling (Supplementary Discussion 2) showing that PAASs resemble electrical capacitors that function as current sinks, and that PAAS size is a major determinant of the degree of conduction defects. Together, our data suggest that the large number of amyloid deposits present in the AD brain have the potential to substantially affect neural networks by widespread disruption of axonal connectivity.
Using in vivo Ca2+ imaging, we found that neurons in the cortex of 5xFAD mice showed a pattern of aberrant activity, in agreement with previous reports36. We found that these abnormal activity patterns can be rectified by deleting Pld3 from basal forebrain neurons, which provide cholinergic inputs to cortical neurons. These results raise the possibility that the aberrant neuronal cortical activity could be partly due to conduction defects in long-range cholinergic projections caused by PAASs. The potential relevance of these findings is further highlighted by the observation of neuronal hyperactivity in humans in early stages of AD38 and the susceptibility of cholinergic neurons to AD neuropathology35.
In addition to cholinergic projections, strategically located amyloid plaques could have deleterious effects in other brain regions, such as the hippocampus, in which parallel compact axonal bundles follow a stereotyped projection path along a trisynaptic loop. Memory formation may be particularly vulnerable to axonal conduction delays and blockades, given that memory consolidation depends on the precise timing of hippocampal replay and sharp-wave ripples39 (Supplementary Discussion 4). Consistent with this view, our quantitative histopathology analysis in a limited number of human post-mortem brain samples from AD or MCI showed that PAAS size and number correlate well with the degree of premortem cognitive decline.
Mechanistically, we found that ELPVs—which probably include MVBs, endolysosomes and autolysosomes—accumulate within axonal spheroids and that their presence is correlated with spheroid size. Moreover, we found an increased presence of ELPVs within spheroids in older 5xFAD mice and in more severely impaired human patients with AD, indicating that ELPV accumulation may be a key feature of disease progression. MVBs are crucial intermediate organelles that evolve through the maturation of endosomes and fuse with autophagosomes and lysosomes26,31. Thus, dysregulation in MVB biogenesis has the potential to affect the normal generation of fusion vesicles.
The endosomal sorting complex required for transport (ESCRT) machinery has a major role in MVB biogenesis by regulating the formation of ILVs within MVBs and the sorting of ubiquitinated proteins into ILVs destined for degradation25. In contrast to lysosomal-resident proteins sorted to the limiting membrane of MVBs32, PLD3 is unique because it is sorted into ILVs through the ESCRT pathway in mammals3. Indeed, we found that PLD3 was present within ELPVs and was highly enriched in PAASs, suggesting a potential role of PLD3 in MVB biogenesis. Consistent with this, we found that overexpression of PLD3 in neurons led to a marked enlargement and accumulation of ELPVs and resulted in an overall increase in PAAS size. Furthermore, the human PLD3(V232M) variant was associated with an increased abundance of ELPVs within PAASs, similar to PLD3 overexpression in mice, suggesting that this variant may exert a gain-of-function effect. A study in young Pld3-knockout mice showed that classical lysosomes in neuronal cell bodies were enlarged2, whereas a separate study in HeLa cells showed no lysosomal changes with PLD3 deletion3. Together with our data, this suggests that PLD3 has complex effects on endolysosomes that are age- and context-dependent and that axons are particularly susceptible to endolysosomal abnormalities, especially in the presence of amyloidosis.
Dysfunction of ESCRT components can lead to the enlargement of endolysosomal compartments3,40. Given the accumulation of PLD3 in axonal spheroids, it is possible that PLD3 accumulation leads to endolysosomal enlargement by interfering with ESCRT machinery. Consistent with this, we found that PLD3 overexpression led to the enlargement of LAMP1-positive vesicles and the formation of small axonal swellings even in WT mice. However, the substantial enlargement of ELPVs after PLD3 overexpression predominantly occurred in spheroids in the vicinity of amyloid plaques, suggesting that this process is amyloid-dependent. We observed robust endocytic activity at axonal spheroids that was associated with the uptake of Aβ42 into endolysosomal compartments. Moreover, we found that Aβ42 was present within ELPVs at axonal spheroids, consistent with previous immunogold electron microscopy in patients with AD, showing that the most prominent subcellular localization of Aβ42 is within MVBs41. Consistent with this, administration of Aβ42 to cultured neurons has been shown to result in MVB enlargement, possibly through interference with ESCRT proteins33. Thus, internalization of Aβ from extracellular deposits may be critical for PLD3-induced ELPV accumulation.
Aβ42 accumulation within MVBs may also impair the ubiquitin–proteasome system, leading to defects in protein sorting and ILV invagination42. Protein-sorting abnormalities could in turn exacerbate the accumulation of PLD3. Thus, PLD3 could work synergistically with Aβ42 in the same subcellular compartment, leading to greater endolysosomal abnormalities. On the other hand, given that APP and β-site APP-cleaving enzyme (BACE1) also accumulate within PAASs43, we do not exclude the possibility that intracellularly produced Aβ could also contribute to abnormalities in MVB biogenesis. APP is also sorted into ILVs of MVBs through the ESCRT machinery40, and deletion of ESCRT components promotes APP processing and increased intracellular Aβ accumulation40. Thus, PLD3 and Aβ may constitute a cycle in which axonal endocytosis and/or intracellularly produced Aβ facilitate the generation and accumulation of ELPVs (Extended Data Fig. 12). However, the precise molecular mechanisms explaining the potential interactions between PLD3 and Aβ remain to be elucidated.
Although the focus of this investigation was on PLD3, it is probable that manipulation of other proteins in the endolysosomal pathway could lead to changes in PAAS size. However, given the negligible expression of PLD3 in non-neuronal cells29 (Extended Data Fig. 7), this molecule could be a promising therapeutic target because global modulation of the endolysosomal pathway may negatively affect glial cells and their roles in controlling protein aggregation and amyloid brain accumulation44. Thus, modulation of neuronal MVB biogenesis through PLD3 or other endolysosomal molecules in neurons could constitute strategies for ameliorating PAAS pathology, independent of amyloid plaque removal. Furthermore, although cytoskeletal abnormalities in axons were not the focus of this study, they probably have important roles in the accumulation of vesicles and spheroid enlargement. Moreover, the presence of hyperphosphorylated tau protein within PAASs as a potential source of tau propagation throughout the neuronal soma45 suggests important links between plaques, axonal spheroids and neurofibrillary tangles that need further investigation. Finally, in addition to neuronal intrinsic mechanisms, the glial microenvironment around plaques has been shown to have a key role in preventing PAAS formation46,47. Thus, the interplay between intrinsic neuronal and extrinsic glial mechanisms may contribute to the formation and enlargement of PAASs and should be considered when designing therapies.
Our findings reveal a cell-intrinsic neuronal mechanism that modulates the size of axonal spheroids and the consequent axonal conduction defects, with important implications for neuronal network dysfunction. Given that axonal spheroids are a prominent feature in various neurological disorders in addition to AD48,49,50, it remains to be studied whether spheroids in these conditions share mechanistic properties with those in AD. Thus, our study opens a theoretical and experimental framework for systematically investigating axonal spheroid pathology in a variety of neurological conditions.