
Nonlinear EEG biomarker profiles for autism and absence epilepsy

By William J. Bosl, Tobias Loddenkemper, and Charles A. Nelson
Excerpt from the article published in Neuropsychiatr Electrophysiol 3, 1 (2017). https://doi.org/10.1186/s40810-017-0023-x
Editor’s Highlights
- Autism spectrum disorder (ASD) and epilepsy are common neurodevelopmental disorders that account for a large proportion of child and adult neurologic burden of disease.
- Childhood absence epilepsy (AE) is a generalized epilepsy syndrome with seizures that appear as staring spells, with no motor signs and no focal lesions, making it more difficult to diagnose.
- Machine learning classifiers were able to distinguish AE cases from controls with 100% accuracy and ASD groups from controls with an accuracy of 97%.
Abstract
Background
Although autism and epilepsy are considered to be different disorders, epileptiform EEG activity is common in people with autism even when overt seizures are not present. The relatively high comorbidity between autism and all epilepsy syndromes suggests the possibility of common underlying neurophysiological mechanisms. Although many different epilepsies may be comorbid with autism, absence epilepsy is a generalized epilepsy syndrome with seizures that appear as staring spells, with no motor signs and no focal lesions, making it more difficult to diagnose. Application of nonlinear methods for EEG signal analysis may enable characterization of brain activity that can help to delineate neurophysiological commonalities and differences between autism and epilepsy. Multiscale entropy and recurrence quantitative analysis (RQA) were computed from EEG signals derived from children with autism or absence epilepsy and compared with the goal of finding significant and potentially clinically useful biomarkers neurophysiological differences between these two childhood disorders.
Methods
Multiscale entropy and a multiscale version of RQA were computed from EEG data obtained from 92 children were collected in two different settings at Boston Children’s Hospital. Short segments of alert resting state EEG were selected for analysis. A complexity index derived from entropy and RQA methods was computed from each of 19 standard EEG channels for all subjects using publicly available software. Statistical comparisons were made between the groups. Machine learning classifiers were also used to determine which derived features were most significantly different among the groups, and to determine classification specificity and sensitivity.
Results
Significant differences were found between absence, autism, and control groups in a number of different scalp locations and the values of complexity index. Autism values appeared to be intermediate between epilepsy and control in many locations, and differences between controls and absence patients were more widely distributed across scalp locations. Classification algorithms were able to distinguish absence epilepsy and autism cases from controls with high (>95%) accuracy. Importantly, two independent control groups, although they were derived from different settings and with different equipment were statistically indistinguishable.
Conclusions
Signficant neurophysiological differences were found between absence, autism, and control cases. In most scalp regions, autism values were intermediate between the control values and absence values, suggesting several future research studies. Nonlinear EEG signal analysis, together with classification methods, may provide complementary information to visual EEG analysis and clinical assessment in epilepsy and autism, and may provide useful information for research on pediatric neurodevelopmental and neurological disorders. Additional research may enable neurophysiological biomarker profiles to be derived from these techniques for clinical use.
Background
Autism spectrum disorder (ASD, or simply ‘autism’) and epilepsy are common neurodevelopmental disorders that account for a large proportion of child and adult neurologic burden of disease [1], with co-morbidities as high as 30% or more [2–5]. Some researchers have suggested that the degree of clinical overlap between ASD and epilepsy arises from a common neurodevelopmental dysfunction [6]. The heterogeneous spectrum of symptoms displayed both disorders makes it particularly difficult to study commonalities and differences between these disorders. There is evidence of abnormal epileptiform abnormalities in children with ASD even in the absence of clinical seizures, but little is known about the clinical or therapeutic implications of this [7]. Genetic studies have found that variants of a single gene (SCN2A) could cause either gain of function and increased neuronal excitability resulting in seizures, or loss of function and decreased neuronal excitability leading to an outcome of ASD [8]. This suggests that similar mechanisms with variable outcomes may be involved in ASD and epilepsy.
ASD constitutes a heterogeneous developmental syndrome that is usually characterized by a triad of impairments that affect social interaction, communication skills, and a restricted range of interests and activities [9, 10]. ASD is not a single disorder, but rather a spectrum of various subtypes with different (largely unknown) causes and developmental trajectories. Current prevalence estimates are that 1 in 68 children now born the US will meet the criteria for an ASD diagnosis [11]. The incidence of autism globally is thought to be relatively uniform, although estimates vary greatly. A prevalence of 1 in 38 children in South Korea was reported [12]. In general, reliable data from low income countries is lacking. One study of global prevalence found no clear evidence of a change in prevalence for ASD between 1990 and 2010 [13]. Estimates of ASD prevalence as high as 1 in 38 children in South Korea have been reported [12]. Although prevalence of ASD is believed to be relatively uniform throughout the world, very little reliable data is available in low income countries [12], where the prevalence of epilepsy is estimated to be significantly higher than in high income countries [14].
Epilepsy has also been described as a heterogeneous neurological spectrum disorder [15] that is characterized by an enduring predisposition to generate epileptic seizures. Older definitions characterize epilepsy by at least two unprovoked seizures occurring at least 24 h apart, and by the neurobiological, cognitive, psychological, and social consequences of this condition [16]. A more recent definition accepted by the International League Against Epilepsy (ILAE) refines this definition to include reflex seizures that are provoked by, for example, flashing lights or other common environmental stimuli, and the possibility of outgrowing epilepsy [17]. Epilepsy in the US occurs in approximately 0.6% in children and 1% in adults for all epilepsies [18]. As previously mentioned, epilepsy is believed to be more common in low income regions, but data from these regions is lacking [14]. The paucity of reliable data on the prevalence of both ASD and epilepsy from the majority of the world’s population suggests a critical need for further research. There is a continuing need for greater communication and research studies between the epilepsy and ASD communities to help shed light on the relationship between these disorders [7].
Although the relationship between ASD and epilepsy is not well understood, the high co-occurrence of these disorders suggests a common underlying neurodevelopmental pathology [6]. A link between epileptiform discharges and developmental disorders has been described in cases of ‘subclinical’ discharges without epilepsy [19, 20]. Even in the absence of overt seizures, reports of epileptiform activity in electroencephalograms (EEGs) in up to 60% of children with ASD have been reported [4, 21], and children with early onset seizures are at higher risk of developing ASD [22]. The incidence of epileptiform abnormalities is reported to correlate the severity of autistic symptoms [23]. Both epileptiform discharges and seizures are a manifestation of abnormal excessive synchronization of neurons, resulting in high amplitude discharges seen on EEG traces. A better understanding of the underlying cause of the shared susceptibility for ASD and epilepsy may create new opportunities for early intervention that can ameliorate or prevent symptoms from emerging [7]. Since electrophysiological abnormalities appear to be associated with both disorders, new approaches to EEG analysis are promising avenues for investigation.
Childhood absence epilepsy (AE, formerly known as petit mal epilepsy) is a subtype of generalized idiopathic epilepsy. The hallmark of an absence seizure is an abrupt loss of consciousness, usually without motor impairment that may last a few seconds to half a minute [24]. Because of the lack of overt seizures, the symptoms of AE are sometimes initially misdiagnosed as an attention deficit problem (ADHD) [25–27]. Absence seizures in children with ASD may not be detected because the seizure symptomology may be similar to behavioral symptoms of autism [7].
A specific seizure type is not known to be more common to ASD [7], but seizures with motor symptoms or focal lesions may be easier to detect. AE was chosen for this study because it is relatively common in childhood, lacks of identifiable lesions, seizure focus, and motor signs, which make it more difficult to easily distinguish from ASD.
Various measures of nonlinear dynamics have been computed from EEG time series in order to detect changes immediately prior to the onset of seizures or epileptiform discharges. Permutation entropy was found to change significantly up to 5 s before seizure onset in rat models of AE [28]. Kolmogorov entropy, Correlation Dimension [29], Relative Wavelet Energy [30] and Approximate Entropy [31] have all demonstrated some success for detecting pre-seizure onset periods, but could not distinguish healthy controls from epilepsy patients during seizure-free periods. Mixed results have been reported for automated seizure detection algorithms based on four different measures (principal eigenvalue, total power, Kolmogorov entropy, correlation dimension). The algorithms were found to be patient-age specific and no single algorithm performed well on all patients [32].
Application of EEG analysis to the detection of ASD is more recent, but has shown some success. Catarino et al. found significantly decreased multiscale entropy in ASD-diagnosed participants compared to controls [33]. Bosl et al., found the same trend in multiscale entropy in infants who were not old enough to exhibit the defining characteristics of ASD. The latter found that the greatest differences are observed between 9 and 12 months of age, as multiscale entropy shows an overall different developmental trajectory for infants at high-risk of developing ASD compared to low-risk infants [34]. Elridge et al. used Bayesian methods to perform a similar classification between ASD and typically developing children, from 6-10 years old. This study extracted robust features such as variance in time, entropy or sum of signed differences from the EEG signal and then used logistic regression and a native Bayes classifier to divide the two groups with a 79% accuracy [35].
A relatively recent approach to nonlinear system characterization, based on statistical analysis of recurrence plots, is called recurrence quantitative analysis or RQA [36–38]. RQA is an empirical approach to analyzing time series data and is in principle capable of characterizing all of the essential dynamics of a complex system and is useful for analyzing “real-world, noisy, high dimensional data” [39]. It has proven to be a powerful tool already in physics, geophysics, engineering and biology [36, 40]. Applications to neurology and neuroscience are in the early stages. In principle, RQA is capable of detecting significant state changes in a dynamical system [36, 37, 41], which suggests that it may be appropriate for detecting developmental changes in brain function that are associated with chronic neurological and mental dysfunction. Recurrence quantitative analysis has been used for early seizure detection by distinguishing ictal and inter-ictal entropy states [42–44] and recently for differentiating children with ASD from typically developing children [45].
We performed a quantitative analysis to evaluate the use of nonlinear features derived from multiscale entropy and RQA applied to EEG segments as biomarkers for AE and ASD. The goal of this study was to perform characterize and compare the electrophysiological dynamics of the brains of children with ASD and AE, using broad nonlinear analysis techniques, in order to contribute to understanding commonalities and differences between these disorders. A secondary goal was to introduce nonlinear signal analysis, feature selection, and machine learning as tools for discovery in neurophysiology research.
…
Results
Multiscale RQA plots were computed for each of the 19 sensor locations in the standard 10-20 configuration. The multiscale time series were derived from the original EEG segments using a previously described averaging method [51]. Although methods for comparing curves based on mean value, slope and various shape parameters are possible, we chose in this study to use the mean value of the multiscale curve to represent the entire curve for simple comparisons between curves. Using the mean values only, group differences that met an overly strict Bonferroni-corrected criterion of p < 10−4, derived by dividing the commonly used significance cutoff of 0.05 by 19*8 (19 sensors, 8 features) and rounding down to the nearest power of 10, are shaded in Figs. 4, 5, 6, 7, 8. Multiscale curves were computed for the following RQA values: RR, DET, LAM, L_entr, L_mean, L_max and TT. In addition, the modified multiscale sample entropy (SampE) used in [49] was also computed. Collectively, these are referred to as ‘signal features’ or simply features hereafter. A single Complexity Index (CI) computed from the area under the multiscale curve has been introduced in the literature [55]. Previous studies have examined several RQA values (RR, DET, LAM) computed on a single scale from EEG time series. Determinism (DET) and Laminarity (LAM) were been found to be lower closer to the epileptic zone in patients with focal epilepsies, while recurrence rate (RR) and entropy were higher [56]. This suggests that similar differences in general might be found between AE cases and controls, since AE is not localized. Although we found some differences in the CI for SampE and all RQA values, when we use a strict significance criterion of p < 10−4, the most important nonlinear features were not RR, DET, and LAM, but the remaining features. The significance threshold was derived using a strict Bonferroni correction from the commonly used threshold of .05, dividing by the number of features (19 sensor locations times 8 CI values) and rounding down to the nearest power of ten.
Table 3 summarizes the most significant group differences found when comparing group pairs at each sensor location and for each signal feature. The significance was computed using the two-tailed independent t-test found in the scipy.stats.ttest_ind package using default parameters. A surprising result was that the two control groups were indistinguishable. They did not have any significant differences at any sensor location for any signal feature. This is important because the EEG measurements were taken with different equipment, in two different settings: one a research laboratory, the other a busy tertiary epilepsy center. Furthermore, classification methods could not distinguish between control groups. For this reason, the control groups were combined for all other group comparisons.
| Classification | Most significant sensor locations (Bonferroni corrected significance level of 10−4 used) | Most significant nonlinear measures |
|---|---|---|
| AE vs. controls | Frontal, occipital, temporal, parietal Fp1, Fp2, Fz, F8, T7, P7, Pz, P8 O1, O2 | SampE, L_entr, L_max, TT |
| ASD vs. controls | Frontal, occipital, left temporal Fp1, Fp2, T7, O1, O2 | SampE, L_max, L_entr |
| AE vs. ASD | Central and occipital Fz, F4, C3 Cz, C4, P3, Pz, P4, O1, O2 | L_max |
| Control 1 vs. Control 2 | No significant differences | No significant differences |
The significance of group differences was computed using the two-tailed t-test for each sensor location and each signal feature
Absence versus controls
The absence group differed significantly from the control at most sensor locations across the scalp for one or more signal features when comparing the mean value of the curve across all scales. The EEG segments were from inter-ictal cases and did not exhibit epileptiform activity. L_max and SampE were the most significantly different. Of the eight features, only two (L_mean and TT) did not meet the significance criterion of p < 10−4 at any location for any feature using mean values. If slope is considered, then group mean slopes for some sensor locations for L_mean and TT are significantly different.
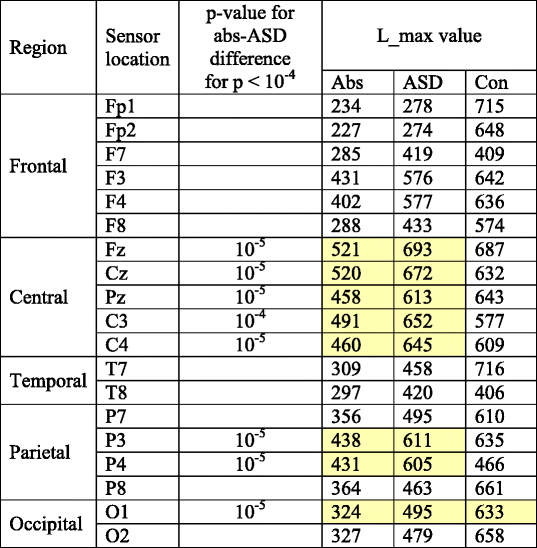
L_max group values and significant group differences are shown
Yellow shading indicates locations where absence and ASD groups differ significantly. While the absence values are much lower than controls almost everywhere, ASD deviations from controls are primarily limited to Fp1,2 and O1,2 regions
Absence versus ASD
Although the absence and ASD groups differed from controls in similar locations, when compared to each other the only significant group differences were found in the L_max features in central locations. Importantly, L_max values for absence cases in Central (Fz, Cz, Pz, C3, C4) and Parietal regions (P3, P4, and O1) were significantly lower than for the ASD cases. However, control and ASD values in these regions were similar.
For all group comparisons, and for the feature ranking calculations discussed below, L_max is the most useful feature for differentiating the absence, ASD and control groups. Thus, group mean multiscale values for L_max are shown in Table 4 for each sensor location and each group. The yellow highlighted values are those that differ significantly between absence and ASD groups. L_max is lowest in the absence group at every location. L_max values for the ASD group are intermediate between absence and controls at most locations, though higher than the controls at F7, Fz, Cz, C3, C4, T8, and P4. With the exception of T8, these are also the locations where absence and ASD groups differ most significantly.
Machine learning classification
The complexity index for each nonlinear measure, and each scalp location, was used as input to machine learning classification algorithms. The result of these classification calculations is shown in Table 5. The AE versus control classification was 100%, and ASD versus controls was 97% (a single false positive error). AE versus ASD classification was less accurate (75, 72 sensitivity for AE and 77% specificity), suggesting that the AE and ASD subjects were much harder to differentiate from each other than from the controls. The empirical p-values shown were computed using the permutation tests method described in the methods section [54]. Classification results are shown in Table 5.
| Groups | Classification | Empirical p-value | Highest ranked features | ||
|---|---|---|---|---|---|
| Accuracy | Sensitivity | Specificity | |||
| AE versus controls | 1.00 | 1.00 | 1.00 | < 0.01 | L_max, TT |
| ASD versus controls | 0.97 | 1.00 | 0.94 | < 0.01 | L_max, TT |
| AE versus ASD | 0.75 | 0.72 | 0.77 | < 0.01 | L_max |
| Control 1 versus Control 2 | Control groups cannot be distinguished. |
Classification results for the decision tree shown in Fig. 3
Empirical p-values are computed using the method of shuffled labels as described in [38]
Although it would seem that the highest ranked features would be those that are statistically the most different in two groups, for classification this may not be the case. The reason is that a variable such as TT, though not statistically different in any pair of groups, may introduce an added, independent dimension to another variable such as L_max. Together they may distinguish group members more clearly than either alone. The highest ranked features for classification are those that are found to contribute the most information to the classifier.
In summary, the absence and ASD groups can be classified from either or both control groups with nearly perfect accuracy. Although there is some overlap between the absence and ASD groups, the classification accuracy of 75% is significantly better than chance, as demonstrated by the permutation tests used to compute the empirical p-values, as explained earlier in the methods section. The classification results are illustrated in Fig. 3, which also suggests a decision support application for screening in a clinical setting.
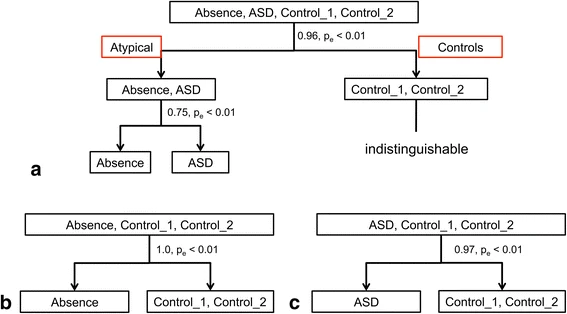
Decision tree showing accuracy of classification for absence, autism, and control groups. a Controls versus disease cases and absence versus autism; babsence versus controls; c autism versus controls
Figures 4, 5, 6, 7 show multiscale curves for each of the three groups (AE, ASD, controls) at each scalp location, for each RQA or muliscale entropy value. Shading was used to show where the most significant differences were between each pair of groups: AE versus controls (red shading) and ASD versus controls (green shading). The features that exhibit the greatest differences are L_max, the two entropy measures (SampE and L_entr) and TT. Figure 8 shows scalp plots with multiscale graphs of L_max and SampE for AE versus ASD groups. These differ primarily in central regions of the scalp where the AE cases differ significantly from controls, but ASD cases do not. L_max values for AE cases in Central (Fz, Cz, Pz, C3, C4) and Parietal regions (P3, P4, and O1) were significantly lower than for the autism cases. One interpretation of this is that atypical AE features are more widespread across the scalp than in ASD.
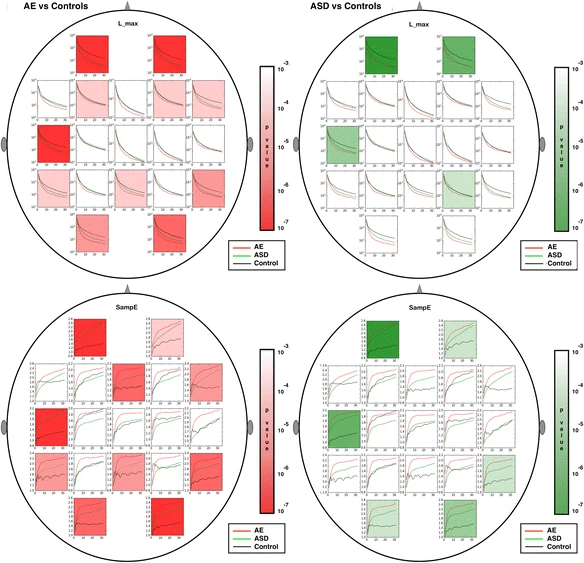
Scalp plots for multiscale RQA measures are shown for absence epilepsy (AE), autism (ASD) and controls. Regions where significant differences existed (p < .0001) are shaded in red (AE versus controls) or green (ASD versus controls). From top to bottom: L_max, SampE
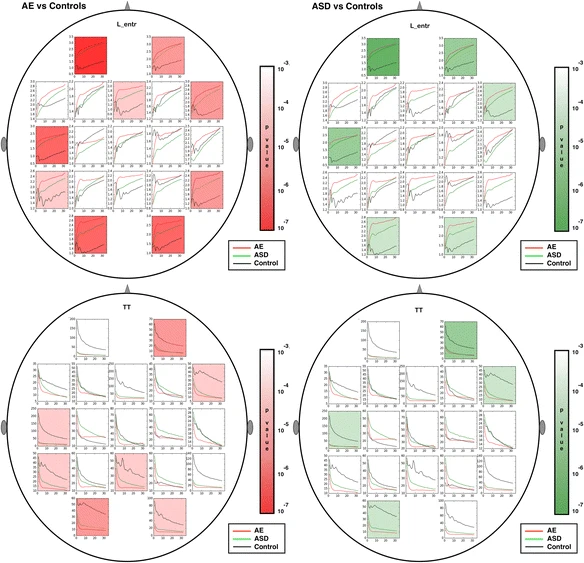
Scalp plots for multiscale RQA measures are shown. Regions where significant differences existed (p < .0001) are shaded in red (epilepsy versus controls) or green (autism versus controls). From top to bottom: L_entr, TT
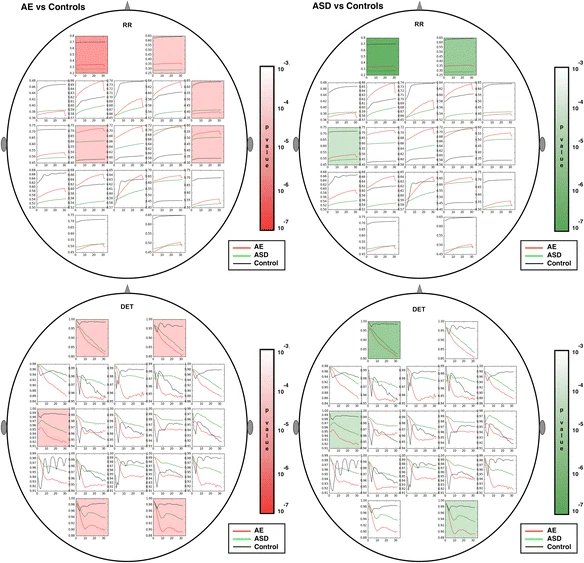
Scalp plots for multiscale RQA measures are shown. Regions where significant differences existed (p < .0001) are shaded in red (epilepsy versus controls) or green (autism versus controls). From top to bottom: RR, DET
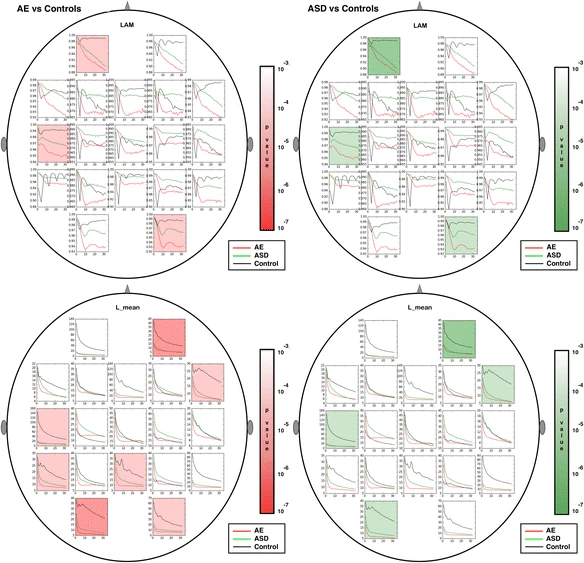
Scalp plots for multiscale RQA measures are shown. Regions where significant differences existed (p < .0001) are shaded in red (epilepsy versus controls) or green (autism versus controls). From top to bottom: LAM, L_mean
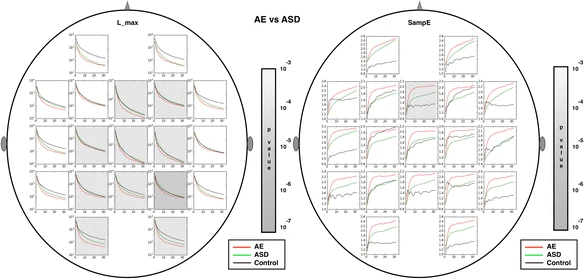
Significant differences between epilepsy and autism cases are shaded in gray. Only two dynamical variables, L_max and SampE, revealed significant differences between autism and epilepsy. left: L_max, right: SampE
The AE group differed significantly from the controls at most sensor locations across the scalp for one or more signal features when comparing the mean value of the curve across all scales. EEG segments were chosen from AE cases from inter-ictal periods and did not exhibit epileptiform activity in the eye of the neurophysiologist, excluding that visibile interictal epileptiform discharges account for RQA differences. The ASD group also differed significantly from the control groups, but scalp locations were not as widely distributed. The most significant differences were in orbitofrontal (Fp1, Fp2), left temporal (T7) and occipital (O1, O2) regions. Absence and ASD groups were more difficult to differentiate from each other than from controls.
For all group comparisons, and for the feature ranking calculations discussed below, L_max is the most useful feature for differentiating the absence, ASD and control groups. Thus, group mean multiscale values for L_max are shown in Table 4 for each sensor location and each group. The yellow highlighted values are those that differ significantly between absence and ASD groups. L_max is lowest in the absence group at every scalp location. L_max values for the ASD group are intermediate between absence and controls at most locations, and indistinguishable from controls in central regions. Multiscale L_max and sample entropy curves are shown in Fig. 8. Gray shading is used to indicate where significant differences between mean values between epilepsy and ASD cases are found.
Discussion
Three general findings resulted that suggest RQA analysis may be useful for neurophysiological research and future clinical applications. First, we found highly significant differences in the multiscale RQA curves between absence, ASD and control groups. Machine learning classifiers were able to distinguish AE cases from controls with 100% accuracy and ASD groups from controls with an accuracy of 97% (100% sensitivity, 94% specificity), as shown in Table 5. P-values shown were derived by a permutation test procedure that involves randomly shuffling group labels and performing the classification with the random labels [54]. Secondly, the two control groups were indistinguishable. Not only were there no significant control group differences in any of the values or scalp locations, but also machine learning algorithms were unable to distinguish the two control groups using any combination of the RQA features (p > 0.9 using the permutation procedure of [54]) This is an important finding, because learning algorithms can find differences that may be due to factors unrelated to those of interest, such as equipment differences. Finally, the most significant spatial locations that differentiated the absence and ASD groups from controls and from each other may give some insight into the neuronal dynamics that characterize these conditions. We discuss these findings in more depth below.