
New insights into the genetic etiology of Alzheimer’s disease and related dementias
By Bellenguez, C., Küçükali, F., Jansen, I.E. et al.
Excerpt from the article published in New insights into the genetic etiology of Alzheimer’s disease and related dementias. Nat Genet (2022). https://doi.org/10.1038/s41588-022-01024-z
Editor’s Highlights
- The pathway enrichment analyses removed ambiguities concerning the involvement of tau-binding proteins and APP/Aβ peptide metabolism in late-onset AD processes at a much higher level than had been described previously
- The pathway enrichment analyses also confirmed the involvement of innate immunity and microglial activation in Alzheimer’s disease related dementias (ADD)
- The TMEM106B and GRN signals in frontotemporal lobar degeneration with TAR DNA-binding protein (TDP-43) inclusions (frontotemporal lobar degeneration TDP) probably share causal variants with ADD.
Abstract
Characterization of the genetic landscape of Alzheimer’s disease (AD) and related dementias (ADD) provides a unique opportunity for a better understanding of the associated pathophysiological processes. We performed a two-stage genome-wide association study totaling 111,326 clinically diagnosed/‘proxy’ AD cases and 677,663 controls. We found 75 risk loci, of which 42 were new at the time of analysis. Pathway enrichment analyses confirmed the involvement of amyloid/tau pathways and highlighted microglia implication. Gene prioritization in the new loci identified 31 genes that were suggestive of new genetically associated processes, including the tumor necrosis factor alpha pathway through the linear ubiquitin chain assembly complex. We also built a new genetic risk score associated with the risk of future AD/dementia or progression from mild cognitive impairment to AD/dementia. The improvement in prediction led to a 1.6- to 1.9-fold increase in AD risk from the lowest to the highest decile, in addition to effects of age and the APOE ε4 allele.
Main
AD is the most common form of dementia. The heritability is high, estimated to be between 60% and 80%1. This strong genetic component provides an opportunity to determine the pathophysiological processes in AD and to identify new biological features, new prognostic/diagnostic markers and new therapeutic targets through translational genomics. Characterizing the genetic risk factors in AD is therefore a major objective; with the advent of high-throughput genomic techniques, a large number of putative AD-associated loci/genes have been reported2. However, much of the underlying heritability remains unexplained. Hence, increasing the sample size of genome-wide association studies (GWASs) is an obvious solution that has already been used to characterize new genetic risk factors in other common, complex diseases (e.g., diabetes).
WAS meta-analysis
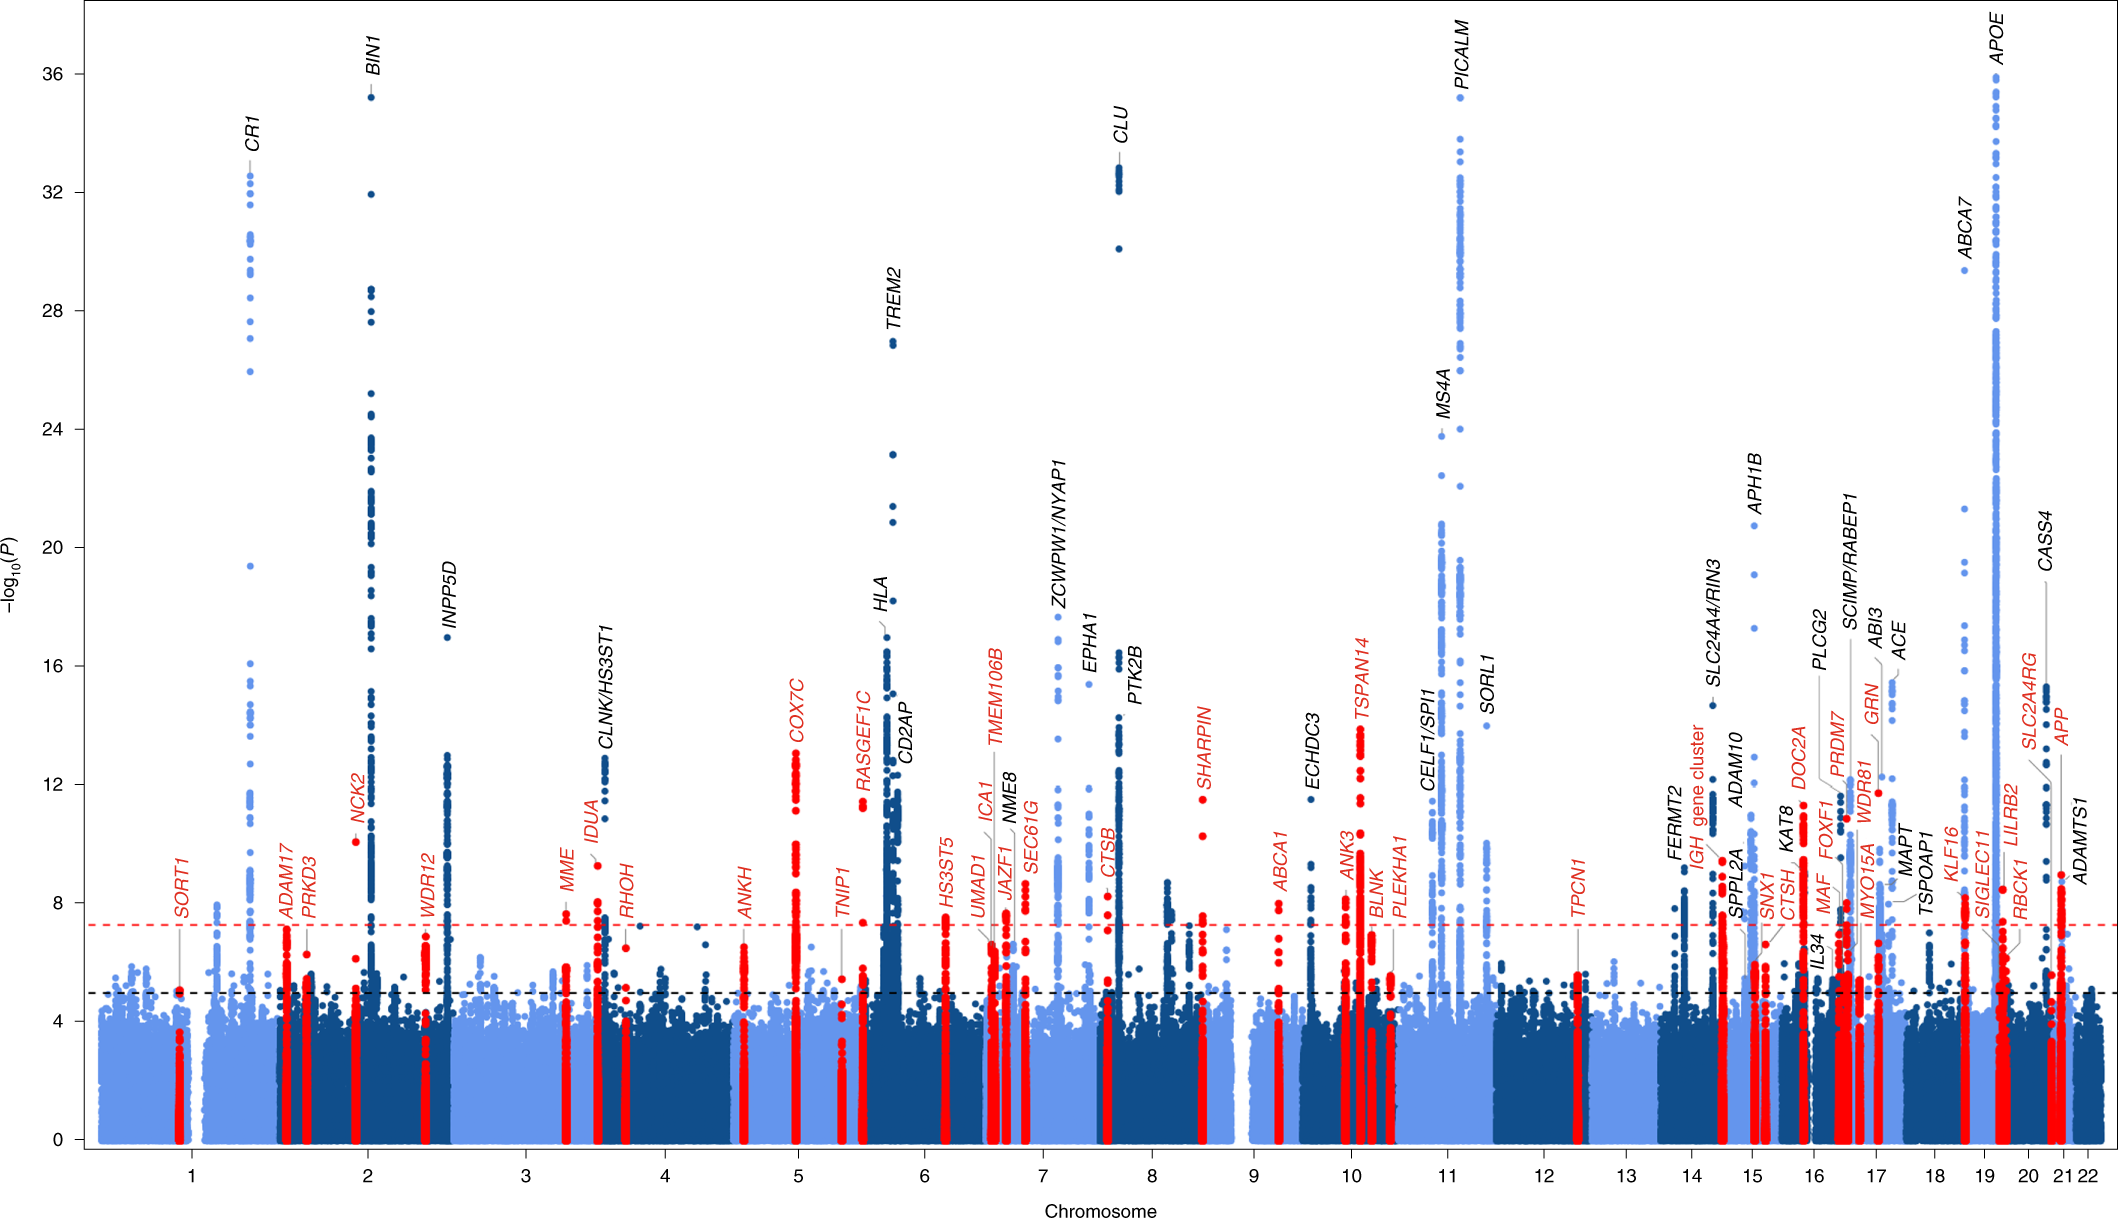
The European Alzheimer & Dementia Biobank (EADB) consortium brings together the various European GWAS consortia already working on AD. A new dataset of 20,464 clinically diagnosed AD cases and 22,244 controls has been collated from 15 European countries. The EADB GWAS results were meta-analyzed with a proxy-AD GWASs of the UK Biobank (UKBB) dataset. The UKBB’s proxy-AD designation is based on questionnaire data in which individuals are asked whether their parents had dementia. This method has been used successfully in the past3 but is less specific than a clinical or pathological diagnosis of AD; hence, we will refer to these cases as proxy AD and related dementia (proxy-ADD). EADB stage I (GWAS meta-analysis) was based on 39,106 clinically diagnosed AD cases, 46,828 proxy-ADD cases (as defined in the Supplementary Note), 401,577 controls (Supplementary Tables 1 and 2) and 21,101,114 variants that passed our quality control (Fig. 1; see Supplementary Fig. 1 for the quantile–quantile plot and genomic inflation factors). We selected all variants with a Pvalue below 1 × 10⁻⁵ in stage I. We defined nonoverlapping regions around these variants, excluded the region corresponding to APOE and examined the remaining variants in a large follow-up sample that included AD cases and controls from the ADGC, FinnGen and CHARGE consortia (stage II; 25,392 AD cases and 276,086 controls). A signal was considered as significant on the genome-wide level if it (1) was nominally associated (P ≤ 0.05) in stage II, (2) had the same direction of association in the stage I and II analyses and (3) was associated with the ADD risk with P ≤ 5 × 10⁻⁸ in the stage I and stage II meta-analysis. Furthermore, we applied a PLINK clumping procedure4 to define potential independent hits within the stage I results (Methods). After validation by conditional analyses (Supplementary Note and Supplementary Tables 3 and 4), this approach enabled us to define 39 signals in 33 loci already known to be associated with the risk of developing ADD3,5,6,7,8,9,10 and identify 42 loci defined as new at the time of analysis (Tables 1 and 2, Supplementary Table 5 and Supplementary Figs. 2–29). Of the 42 new loci, 17 had P ≤ 5 × 10⁻⁸ in stage I and 25 were associated with P ≤ 5 × 10⁻⁸ after follow-up (stage I and stage II meta-analysis, including the ADGC, CHARGE and FinnGen data). We also identified 6 loci with P ≤ 5 × 10⁻⁸ in the stage I and stage II analysis but with P > 0.05 in stage II (Supplementary Table 6). It is noteworthy that the magnitude of the associations in stage I did not change substantially if we restricted the analysis to clinically diagnosed AD cases (Supplementary Table 7 and Supplementary Fig. 30). Similarly, none of the signals observed appeared to be especially driven by the UKBB data (Supplementary Table 7 and Supplementary Figs. 2–29). Nine of these loci (APP, CCDC6, GRN, LILRB2, NCK2, TNIP1, TMEM106B, TSPAN14 and SHARPIN) were recently reported in three articles using part of the GWAS data included in our study11,12,13. We also generated a detailed analysis of the human leukocyte antigen (HLA) locus on the basis of the clinically diagnosed AD cases (Supplementary Tables 8 and 9, Supplementary Figs. 31 and 32 and Supplementary Note).
Genetic overlap with other neurodegenerative diseases
We tested the association of the lead variants within our new loci with the risk of developing other neurodegenerative diseases or AD-related disorders (Supplementary Fig. 33 and Supplementary Tables 10–12). We also performed more precise colocalization analyses (using Coloc R package, https://cran.r-project.org/web/packages/coloc/index.html) for five loci known to be associated with Parkinson’s disease (IDUA and CTSB), types of frontotemporal dementia (TMEM106B and GRN) and amyotrophic lateral sclerosis (TNIP1) (Supplementary Tables 13 and 14). The IDUA signal for Parkinson’s disease was independent of the signal in ADD (coloc posterior probability (PP)3 = 99.9%), but we were not able to determine whether the CTSB signals colocalized. The TMEM106B and GRN signals in frontotemporal lobar degeneration with TAR DNA-binding protein (TDP-43) inclusions (frontotemporal lobar degeneration TDP) probably share causal variants with ADD (coloc PP4 = 99.8% and coloc PP4 = 80.1%, respectively). Lastly, we were not able to determine whether the TNIP1 signals colocalized for ADD and amyotrophic lateral sclerosis.
Pathway analyses
Next, we sought to perform a pathway enrichment analysis on the stage I association results to gain better biological understanding of this newly expanded genetic landscape for ADD. Ninety-three gene sets were still statistically significant after correction for multiple testing (q ≤ 0.05; Methods and Supplementary Table 15). As described previously, the most significant gene sets are related to amyloid and tau5; other significant gene sets are related to lipids, endocytosis and immunity (including macrophage and microglial cell activation). When restricting this analysis to the meta-analysis based on the clinically diagnosed AD cases, 54 gene sets were significant (q ≤ 0.05). Of these 54 gene sets, 33 reached q ≤ 0.05 in the stage I analysis and all reached P ≤ 0.05. This indicates that the inclusion of proxy-ADD cases does not cause disease-relevant biological information to be missed and underlines the additional power of this type of analysis.
We next performed a single-cell expression enrichment analysis by using the average gene expression per nucleus (Av. Exp.) data in the human Allen Brain Atlas (49,495 nuclei from 8 human brains). Only the microglial expression reached a high level of significance (P = 1.7 × 10⁻⁸; Supplementary Table 16); greater expression corresponded to a more significant association with ADD. After adjusting for microglial Av. Exp., the remaining associations became nonsignificant; this indicates that microglial Av. Exp. drives all the other cell-type associations. These results were observed whatever the brain region studied (Supplementary Table 16). A similar result was observed using a mouse single-cell dataset14 (Supplementary Table 17 and Supplementary Note).
Lastly, we looked at whether the relationship between an elevated microglia Av. Exp. and a genetic association with the ADD risk was specific to particular biological processes (Supplementary Table 18) by analyzing the interaction between microglia Av. Exp. and pathway membership in MAGMA15. Of the five most significant interaction signals (q ≤ 10−3), two were directly associated with endocytosis processes (GO:0006898 and GO:0031623); this suggested a functional relationship between microglia and endocytosis, which is known to be involved in phagocytosis (Supplementary Table 18). It is noteworthy that we also detected an interaction between GO:1902991 (regulation of amyloid precursor protein (APP) catabolic process) and the gene expression level in microglia (q = 1.4 × 10⁻³; Supplementary Table 18). Even though these data suggest a functional relationship between microglia and APP/amyloid beta (Aβ) peptide pathways, this observation reinforces the likely involvement of microglial endocytosis in AD, a mechanism that is also strongly involved in APP metabolism16. Of note, there are overall similarities in the interaction effects of human and mouse microglia expression with genes in biological pathways of relevance to the AD genetic risk (Supplementary Table 18 and Supplementary Note).
Gene prioritization
We next attempted to identify the genes most likely to be responsible for the association signal with ADD at each new locus. To this end, we studied the downstream effects of ADD-associated variants on molecular phenotypes (i.e., expression, splicing, protein expression, methylation and histone acetylation) in various cis-quantitative trait locus (cis-QTL) catalogues from AD-relevant tissues, cell types and brain regions. We investigated the genetic colocalization between association signals for the ADD risk and those for the molecular phenotypes and the association between the ADD risk and these phenotypes by integrating cis-QTL information into our ADD GWAS. Moreover, we considered the lead variant annotation (the allele frequency, protein-altering effects and nearest protein-coding gene) and a genome-wide, high-content short interfering RNA screen for APP metabolism17. Based on this evidence, we developed a systematic gene prioritization strategy that yielded a total weighted score of between 0 and 100 for each gene (Supplementary Fig. 34 and Supplementary Note). This score was used to compare and prioritize genes in the new loci within 1 Mb upstream and 1 Mb downstream of the lead variants. Genes either were ranked as tier 1 (greater likelihood of being the causal risk gene responsible for the ADD signal) or tier 2 (lower likelihood and the absence of a minimum level of evidence as a causal risk gene) or were not ranked.
From all newly identified loci, this gene prioritization yielded 31 tier 1 genes and 24 tier 2. The 55 prioritized genes, the details of the analyses and the supporting evidence are summarized in Fig. 2a and the Supplementary Note (Supplementary Tables 19–30 and Supplementary Figs. 35–45). Among the 31 tier 1 genes, we observed that 25 of these genes were the only prioritized gene in their respective locus. For the remaining 6 tier 1 genes, we also found tier 2 genes in their respective locus. We also identified five loci containing several tier 2 prioritized genes. In one of these loci, locus 39 (L39), the tier 2 prioritized gene LILRB2 had strong additional support from published literature (Supplementary Note). In five loci, our prioritization score did not identify sufficient molecular evidence to prioritize genes with exception of being the nearest gene (L10, L12, L13, L14 and L32). Finally, we excluded the complex IGH cluster (L27) from gene prioritization analyses due to genomic complexity of the telomeric locus as a consequence of known fusion events18.

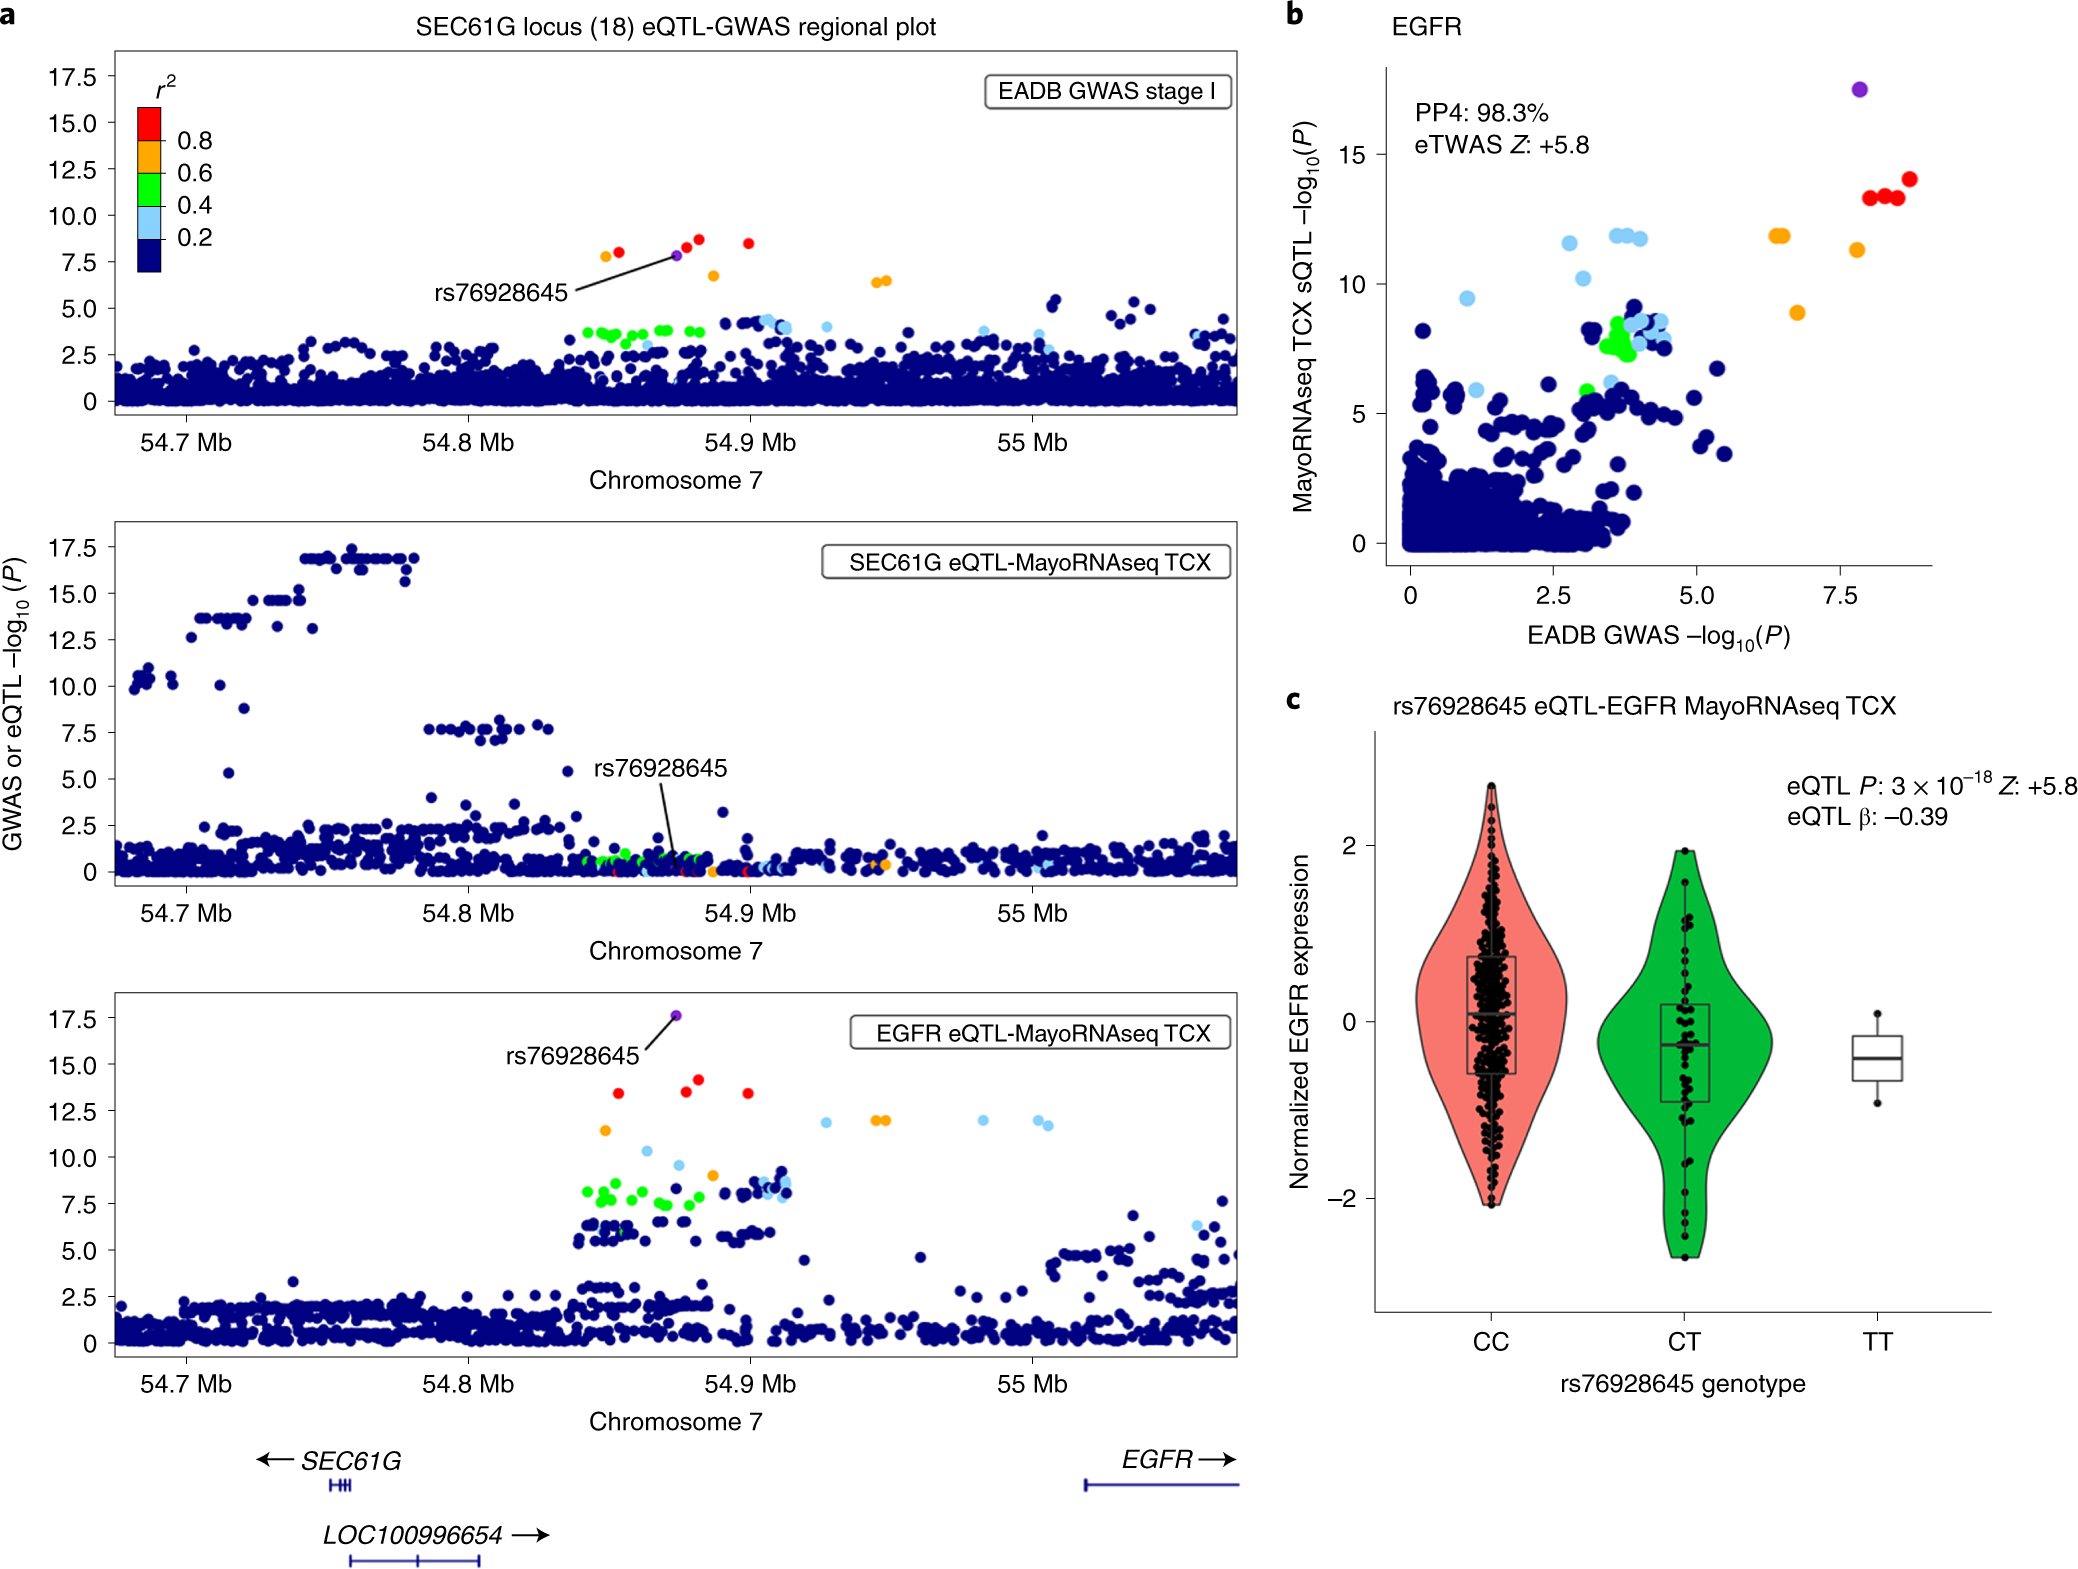
We highlight two examples, L18 and L23. In L18, the lead variant, rs76928645 (MAF = 10%), is intergenic and is located more than 100 kb downstream or upstream of the two nearest protein-coding genes (SEC61G and EGFR, respectively). Our gene prioritization analyses suggested that EGFR was the only risk gene (Fig. 3). We found that both the lead variant (rs76928645) and the other nearby variants in linkage disequilibrium (LD) are significant expression QTLs (eQTLs) for regulating EGFR expression downstream. The eQTL signals in brain strongly colocalized with the GWAS signal (with eQTL coloc PP4s of 98.3% in the temporal cortex (TCX) and 99.5% in the dorsolateral prefrontal cortex (DLPFC)). Accordingly, the fine-mapped expression transcriptome-wide association study (eTWAS) associations (Fine-mapping Of CaUsal gene Sets (FOCUS) posterior inclusion probability (PIP) = 1; eTWAS P = 6.9 × 10⁻⁹, eTWAS Z = + 5.8 in the TCX; eTWAS P = 3.1 × 10⁻¹¹, eTWAS Z = + 6.6 in the DLPFC) indicated that genetic downregulation of EGFR expression is associated with a lower ADD risk (Fig. 3; Supplementary Tables 22, 24 and 26; and Supplementary Figs. 36a, 39 and 41).
In L23, we observed numerous eQTL-GWAS and methylation QTL (mQTL)-GWAS hits for TSPAN14 that support the hypothesis that increased brain expression of TSPAN14 is associated with increased ADD risk. We also identified several splice junctions in TSPAN14whose genetic regulation signals in lymphoblastoid cell lines (LCLs) and brain colocalized with the ADD association signal. These splice junctions were also associated with ADD risk (Fig. 4, Supplementary Tables 22–28 and Supplementary Figs. 36–42 and 44c). As three of these splice junctions were related to new complex cryptic splicing events that were predicted to result in two cryptic exons not previously described in known TSPAN14transcripts (based on GENCODE v38), we designed a long-read single-molecule (Nanopore) sequencing experiment (Supplementary Note) to validate these cryptic exons on a total of 93 complementary DNA (cDNA) samples derived from LCLs, frontal cortex and hippocampus and consequently validated those cryptic exons (Fig. 4). All three of the validated cryptic splicing events occur within the ADAM10-interacting domain of TSPAN14. Cryptic exon 1 is at least 45 bp long, and cryptic exon 2 is 118 bp long.

Lastly, we used STRING v11 (ref. 19) to analyze protein–protein interaction for (1) previously known AD genes from GWASs, (2) our prioritized new genes (tier 1 in Fig. 2a and Supplementary Table 20) and (3) a combination of the two (Supplementary Note). The largest networks contained 14, 8 and 30 proteins, respectively (Supplementary Fig. 46). These networks were larger than would be expected by chance (respectively, P < 2 × 10⁻⁵, P = 2.8 × 10⁻³ and P < 2 × 10⁻⁵ based on comparison with 50,000 randomly simulated protein lists matched for the number of proteins and the total number of interactions for each protein). Notably, the number of interactions between our prioritized genes and previously known genes is also significantly greater than would be expected (P < 1 × 10⁻⁴), indicating that the newly prioritized genes are biologically relevant in AD. No such enrichment (P = 0.88) was observed for the remaining genes in the new loci, again highlighting the value of our prioritization approach.
We next performed a pathway enrichment analysis of the tier 1 genes using STRING. We found that several gene sets linked to the immune system remained statistically significant after correction for multiple testing (Fig. 2b and Supplementary Table 31), especially regulation of the tumor necrosis factor (TNF)-mediated signaling pathway (GO:0010803). We report the potential genetic implication of the linear ubiquitin chain assembly complex (LUBAC), which is a major regulator of the aforementioned signaling pathway20. Two of the LUBAC’s three complements are encoded by the new tier 1 prioritized genes SHARPIN and RBCK1, and the complex’s function is directly regulated by OTULIN (also a new tier 1 prioritized gene).
GRS
We next looked at whether the genetic ADD burden (as measured by a genetic risk score (GRS)) generated from our genome-wide significant variants (n = 83, excluding APOE; Supplementary Table 32) might influence the rate of conversion to AD in (1) individuals from several prospective, population-based cohorts and (2) patients with mild cognitive impairment (MCI) in prospective memory clinic studies (Supplementary Table 33). We used Cox regression models to assess the association after adjustment for age at baseline, sex, the number of APOE-ε4 and APOE-ε2 alleles, and genetic principal components (PCs).
In population-based cohorts with clinically diagnosed AD cases, the GRS was significantly associated with conversion to AD; this was shown in a fixed-effect meta-analysis (hazard ratio (HR) (95%CI) per average risk allele = 1.076 (1.064–1.088), P = 9.2 × 10−40; Fig. 5 and Supplementary Table 34). Likewise, the GRS was significantly associated with AD conversion in patients with MCI (HR = 1.056 (1.040–1.072), P = 2.8 × 10⁻¹²; Fig. 5 and Supplementary Table 35). Furthermore, we found that the GRS association increased significantly when the new variants discovered in the present study were added to the previously described variants (Supplementary Table 36) for both population-based studies (HR = 1.052 (1.037–1.068), P = 1.5 × 10⁻¹¹) and MCI cohorts (HR = 1.034 (1.013–1.055), P = 1.4 × 10⁻³).

Importantly, the results of our meta-analysis suggest that the risk of conversion to AD rises with the number of risk alleles from non-APOE risk variants in the GRS by 1.9-fold in population-based cohorts (HR = 1.93 (1.75–2.13); Fig. 5) and 1.6-fold in MCI cohorts (HR = 1.63 (1.42–1.87); Fig. 6) on top of effects of age and the APOE ε4 allele. These observations result from the comparison of hypothetical individuals with a GRS value at the first decile of the distribution versus those with a GRS value at the ninth decile (Fig. 6). With regard to APOE, carrying an additional APOE-ε4 allele was associated with a slightly higher increase in the AD risk in population-based cohorts (HR = 2.19 (2.03–2.37)) and MCI cohorts (HR = 1.90 (1.73–2.07)). There was no interaction between the GRS and the number of APOE-ε4 alleles (Supplementary Table 37).

In an MCI cohort setting, this effect of the GRS corresponds to a median AD conversion probability within 3 years of 21.9% in patients with a GRS below the first decile (range, 4.1–34.9%) and 37.5% (range, 10.8–56.2%) in patients with a GRS above the ninth decile. There was a consistent increase in probability between these deciles in all cohorts (median (range), 13.8% (6.6–25.0%); Supplementary Table 38).
To better define the GRS discriminative ability regarding AD conversion, we assessed the improvements in three indices of predictive performance after adding the GRS to a Cox model containing age, sex, PCs and the number of APOE-ε4 and APOE-ε2 alleles as covariates (Supplementary Tables 34 and 35). We found a small but consistent increase in the discrimination between AD converters and nonconverters, as indicated by the concordance index (C-index) in population-based cohorts (Δ5years-C-indexfixed-effects = 0.002 (0.0004–0.004)) and MCI cohorts (Δ3years-C-indexfixed-effects = 0.007 (0.001–0.012)). This finding was further supported by small-to-moderate increases in the continuous NRI (net reclassification improvement) index in population-based cohorts (NRI5year-fixed-effects = 0.248 (0.159–0.336)) and MCI cohorts (NRI3year-fixed-effects = 0.232 (0.140–0.325)); this indicates that the risk assignment is more appropriate to individuals when the GRS is taken into account21. Furthermore, an increase in the index of prediction accuracy (IPA) was observed in all of the population-based cohorts (average Δ5years-IPAfixed-effects = 0.29% (0.23%–0.35%)) and all but one of the MCI cohorts (average Δ3years-IPAfixed-effects = 1.53% (1.31%–1.76%)), indicating an overall improvement in predictive performance. As expected, the amount of improvement in this index varied greatly from one cohort to another, given its dependency on incidence rates. The value of adding the new genetic variants was emphasized by the fact that effect sizes (as measured by the indices of predictive ability) were lower when only previously known AD risk variants were included in the GRS (Supplementary Table 39).
The results were similar when we (1) computed indices for other follow-up time points, (2) applied a random effects meta-analysis, (3) considered conversion to all-cause-dementia as the outcome and (4) excluded the Framingham Heart Study (FHS), as it was part of the stage II of the GWAS from which ORs for PRS computation were extracted (Supplementary Tables 34–44 and Supplementary Fig. 47).
Discussion
Our meta-analysis combined a large, new case–control study with previous GWASs. We identified 75 independent loci for ADD; 33 had been reported previously, and 42 correspond to new signals at the time of this analysis. The prioritized genes and their potential impact on the pathophysiology of AD are described in the Supplementary Note.
Our pathway enrichment analyses removed ambiguities concerning the involvement of tau-binding proteins and APP/Aβ peptide metabolism in late-onset AD processes at a much higher level than had been described previously5. It is noteworthy that new genetic risk factors are often first evaluated in the context of known pathways; many new research approaches were developed to systematically characterize putative links among APP metabolism, tau function and ADD genetic risk factors22,23. This approach can lead to circular reasoning and thus artificial enrichment in specific processes. However, we implicate ADAM17, a gene whose protein product is known to carry α-secretase activity as ADAM10 (ref. 24). This observation suggests that the nonamyloidogenic pathway for APP metabolism might be deregulated in AD. In addition to APP, we also identified six highly plausible prioritized (tier 1) genes (ICA1L, DGKQ, ICA1, DOC2A, WDR81 and LIME1) that are likely to modulate the metabolism of APP.
These pathway enrichment analyses also confirmed the involvement of innate immunity and microglial activation in ADD (Supplementary Table 15). Our single-cell expression enrichment analysis also highlighted genes expressed in microglia (Supplementary Tables 16 and 17). Indeed, three of our prioritized (tier 1) genes (RHOH, BLNK and SIGLEC11) and two of our tier 2 genes (LILRB2 and RASGE1FC) appeared to be mainly expressed in microglia (>90% relative to the total expression summed across cell types; Fig. 2a and Supplementary Table 45). Importantly, SIGLEC11 and LILRB2 have already been linked to Aβ peptides/amyloid plaques25,26.
Here, we also provide genetic evidence of the LUBAC’s potential implication in ADD. Two of the LUBAC’s three complements are encoded by SHARPIN and RBCK1, and the LUBAC is regulated by OTULIN; all three genes were found to be high-confidence, prioritized risk genes in our study. The LUBAC is the only E3 ligase known to form linear ubiquitin chains de novo through ubiquitin’s N-terminal methionine. The complex has mostly been studied in the context of inflammation, innate immunity and defense against intracellular pathogens. For instance, the LUBAC is reportedly essential for NLRP3 inflammasome activation27 and thus acts as a key innate immune regulator28. In turn, the NLRP3 inflammasome is essential for the development and progression of Aβ pathology in mice29 and may drive tau pathology through Aβ-induced microglial activation30. The LUBAC is also reportedly involved in autophagy, and linear ubiquitin chain modifications of TDP-43-positive neuronal cytoplasmic inclusions have been described as potential inducers of autophagic clearance31. Lastly, the LUBAC has been studied as a regulator of TNF-α signaling in particular20.
Interestingly, the TNF-α signaling pathway was also flagged by other genetic findings in our study (Supplementary Fig. 48). For example, ADAM17 (also known as TNF-α-converting enzyme) is of pivotal importance in the activation of TNF-α signaling32. For TNIP1, its gene product (TNF-α-induced protein 3-interacting protein 1) is involved in the inhibition of the TNF-α signaling pathway and nuclear factor κB activation/translocation33. Additional signal related to TNF-α is the one found at SPPL2A (one of the 33 confirmed loci). The protein encoded by SPPL2A is involved in noncanonical shedding of TNF-α34, and PGRN has been described as a TNF receptor ligand and an antagonist of TNF-α signaling35. Several lines of evidence had linked the inhibition of TNF-α signaling with reduction of both Aβ and tau pathologies in vivo36,37. Although a potential inflammatory connection has been suggested for TNF-α through the activation of NLRP3 inflammasome38, the TNF-α signaling pathway is also involved in many other brain physiological functions (e.g., synaptic plasticity in neurons) and pathophysiological processes (e.g., synapse loss) in the brain39. Furthermore, the involvement of the TNF-α signaling pathway and the LUBAC might be important in cell types other than microglia in AD. It is important to note that six of our prioritized (tier 1) genes (ICA1L, EGFR, RITA1, MYO15A, LIME1 and APP) are expressed at a low level in microglia (<10%, relative to the total expression summed across cell types; Supplementary Table 45), emphasizing that ADD results from complex crosstalk between different cell types in the brain23,40. It is also noteworthy that the EGFR pathway is known to interact with the TNF-α signaling pathway41, which suggests interplay between the two signaling pathways during the ADD development.
A better understanding of the etiology of ADD might also result from the observation that the risks of developing ADD and frontotemporal dementia are associated with the same causal variants in GRN and TMEM106B. This association might be due to the misclassification of clinical diagnosis of AD and the presence of proxy-ADD cases in the UKBB. However, GRN and TMEM106B have also been linked to brain health and many other neurodegenerative diseases. For instance, GRN and TMEM106B are reportedly potential genetic risk factors for differential aging in the cerebral cortex42 and cognitive impairment in amyotrophic lateral sclerosis43and Parkinson’s disease44,45. Lastly, both GRN and TMEM106B have already been associated with neuropathological features of AD46,47,48. Taken as a whole, these data may thus emphasize a potential continuum between neurodegenerative diseases in which common pathological mechanisms are driven by GRN and TMEM106B. Interestingly, both GRN and TMEM106B are reported to be involved in defective endosome/lysosome trafficking/function49,50, a defect that is also observed in AD.
By applying a GRS derived from all the genome-wide-significant variants discovered in this study, we identified an association with the risk of incident AD in prospective population-based cohorts and with the risk of progression over time from MCI to AD (Fig. 5 and Supplementary Table 33). In patients with MCI, previous associations of AD risk with a GRS built on previously known genetic AD risk variants has been inconsistent51. It is important to note that the GRS has an impact on the AD risk in addition to that of age and that the GRS’s effect is independent of APOE status. With a view to translating genetic findings into preventive measures and personalized medicine, we also sought to provide the GRS’s added value for risk prediction by calculating the discriminative capacity through three different indices. Overall, the indices suggested that the effect size for the association between the GRS and AD was small but significant. Despite this modest effect, the inclusion of the GRS into the predictive model consistently improved the assignment of the risk of progression, as expressed by the net reclassification improvement (NRI) index21. Importantly, the cumulative improvements in risk prediction (due to inclusion of the new variants in the GRS) led to a 1.6- to 1.9-fold increase in the AD risk from the lowest to the highest decile, in addition to the effects of age and APOE status. We also showed that in addition to known risk variants, the new risk variants identified in the present study are significantly associated with progression to AD. The results of future GWASs are expected to further improve AD-risk prediction. Hence, the GRS will help to sharpen the threshold that differentiates between people at risk of progressing to dementia and those who are not.
A recent study estimated that fewer than 100 causal common variants may explain the entire AD risk52; if that estimate is correct, then our study might have already characterized a large proportion of this genetic component due to common variants. However, several reasons strongly underscore the need for additional efforts to fully characterize the still-missing AD genetic component. First, it is probable that additional, yet-unknown loci bear common variants modulating the risk for AD. Second, identification of rare variants with very low frequencies is a major challenge for genetic studies, because available samples with sequencing data in AD are underpowered. Notably, almost all the genes with rare variants associated with AD risk also present common variants associated with AD risk (i.e., TREM2, SORL1, ABCA7, ABCA1, PLCγ2 and ADAM10)53. Third, gene–gene and gene–environment interactions have not yet been studied in detail. Hence, by increasing the GWAS sample size and improving imputation panels, conventional and (above all) more complex analyses will have more statistical power and should enable the characterization of associations with rare/structural variants. Lastly, higher-powered GWASs of multiancestry populations will be particularly welcome for characterizing potential new genetic risk factors, improving fine-mapping approaches and developing specific GRSs (because GRSs developed with European-ancestry populations are known to be less effective with other ancestries).
In conclusion, we have validated 33 previous loci, doubled the total number of genetic loci associated with the ADD risk, expanded our current knowledge of the pathophysiology of ADD, identified new opportunities for the development of GRSs and gene-specific treatments and opened up a pathway to translational genomics and personalized medicine.