
Maladaptive myelination promotes generalized epilepsy progression
By Juliet K. Knowles, Haojun Xu, Caroline Soane, Ankita Batra, Tristan Saucedo, Eleanor Frost, Lydia T. Tam, Danielle Fraga, Lijun Ni, Katlin Villar, Sydney Talmi, John R. Huguenard, and Michelle Monje
Excerpt from the article published in Nature Neuroscience 25, 596–606 (2022). https://doi.org/10.1038/s41593-022-01052-2
Editor’s Highlights
- Absence seizures occur in multiple forms of human generalized epilepsy and are associated with behavioral arrest and generalized, but frontally predominant, spike-wave discharges.
- Absence seizures result from abnormal, hypersynchronous oscillations in thalamocortical connections and generalize to involve both hemispheres of the brain by propagating across the corpus callosum.
- A complex link between BDNF signaling in OPCs and aberrant myelination that promotes seizures.
- Mounting evidence suggests that a range of aberrant patterns of myelination may predispose brain networks toward seizures, through multiple mechanisms.
- Activity-regulated myelination, previously described in the setting of neural network adaptation related to learning, can also reinforce deleterious patterns of neural activity.
Abstract
Activity-dependent myelination can fine-tune neural network dynamics. Conversely, aberrant neuronal activity, as occurs in disorders of recurrent seizures (epilepsy), could promote maladaptive myelination, contributing to pathogenesis. In this study, we tested the hypothesis that activity-dependent myelination resulting from absence seizures, which manifest as frequent behavioral arrests with generalized electroencephalography (EEG) spike-wave discharges, promote thalamocortical network hypersynchrony and contribute to epilepsy progression. We found increased oligodendrogenesis and myelination specifically within the seizure network in two models of generalized epilepsy with absence seizures (Wag/Rij rats and Scn8a+/mut mice), evident only after epilepsy onset. Aberrant myelination was prevented by pharmacological seizure inhibition in Wag/Rij rats. Blocking activity-dependent myelination decreased seizure burden over time and reduced ictal synchrony as assessed by EEG coherence. These findings indicate that activity-dependent myelination driven by absence seizures contributes to epilepsy progression; maladaptive myelination may be pathogenic in some forms of epilepsy and other neurological diseases.
Main
Neuronal activity can modulate myelin structure during development1,2,3 and throughout life4,5,6,7,8,9,10 by promoting proliferation of oligodendrocyte progenitor cells (OPCs), generation of new myelinating oligodendrocytes and changes to myelin structure4,5,6,7,8,9,10. Remodeling of myelin by existing oligodendrocytes can also occur in response to neuronal activity9,10. This plasticity of myelin and oligodendroglial cells has been best demonstrated to date in cortical and callosal axons4,5,6,11. Activity-regulated myelination is adaptive in the healthy brain, where it is hypothesized to increase neural network synchrony7,12,13,14, and myelin plasticity contributes to cognitive functions, including attention, learning and memory7,11,14,15,16,17.
The effects of myelin plasticity on network function in the healthy brain raise the question of how activity-regulated myelination may modulate network function in disease states characterized by abnormal patterns of neuronal activity, such as epilepsy. Diffusion-based imaging has demonstrated abnormal white matter microstructure in various forms of epilepsy in humans and rodent models18,19,20,21,22,23,24; however, definitive conclusions cannot be drawn about underlying myelin and axonal structure in the absence of gold-standard ultrastructural histology, nor is it known how altered white matter structure may contribute to epilepsy pathophysiology.
Absence seizures occur in multiple forms of human generalized epilepsy and are associated with behavioral arrest and generalized, but frontally predominant, spike-wave discharges25,26. Absence seizures originate in abnormal oscillations between the thalamus and cortex27 and propagate along myelinated tracts, including the anterior portions of the corpus callosum28. In humans and rodents, absence seizures are brief but very frequent, occurring hundreds of times per day25,29. Thus, generalized epilepsy with absence seizures presents an ideal paradigm to examine the relationship between activity-regulated myelination and seizure pathophysiology.
Genetic rodent models of generalized epilepsy with absence seizures exhibit defined periods of seizure onset followed by seizure progression, in which absence seizures increase in daily frequency over time29,30. This pattern of developmental seizure onset with progression is similar to the natural history of untreated, medically refractory and/or progressive forms of generalized epilepsy in children31,25. Blockade of seizures throughout the period of seizure progression in one model of absence epilepsy—Wag/Rij rats—prevents or delays seizure onset29, indicating that aberrant neuronal activity induces pathological network changes that contribute to subsequent progression in seizure burden. Although mechanisms of absence seizure onset and progression are incompletely understood, a well-documented feature is excessive synchrony (coordinated firing of groups of neurons) in the thalamocortical network30,32. Given the proposed effect of activity-regulated myelination on network synchrony7,12,13,14, we hypothesized that abnormally increased myelination within the seizure network, induced by absence seizures, might contribute to seizure progression.
Results
Increased seizure network myelination after epilepsy onset
To test the putative relationship between absence seizures and myelination, we used a well-established model of absence seizures—Wag/Rij rats29. Wag/Rij is an inbred rat strain that develops spontaneous, stereotyped absence seizures characterized by brief behavioral arrest, similar to absence seizures in humans25. The EEG correlate of these episodes in Wag/Rij rats is ~4–8-Hz, generalized, frontally predominant spike-wave discharges that are maximal over the somatosensory cortices33. Absence seizures arise from neurons connecting the thalamus and the cortex27,34. In rodents, absence seizures are particularly prominent in relays between the ventrobasal nuclear complex of the thalamus and somatosensory cortex, driven by complex circuitry involving interneurons of the reticular thalamic nucleus27,30. Seizures propagate throughout the brain via myelinated tracts, including the internal capsule (interconnects the thalamus and cortex) and the corpus callosum, a commissural tract that is required for seizure generalization28 (Fig. 1a). In Wag/Rij rats, infrequent seizures spontaneously begin around 2 months of age and steadily increase in daily frequency until the rate plateaus at 20–30 seizures per hour at about 6 months of age29. A closely related rat strain from which Wag/Rij is derived, Wistar, does not typically develop absence seizures during this time frame and, therefore, is used as a control for Wag/Rij rats29.
Increased oligodendrogenesis and myelination within the absence seizure network after epilepsy onset in Wag/Rij rats.
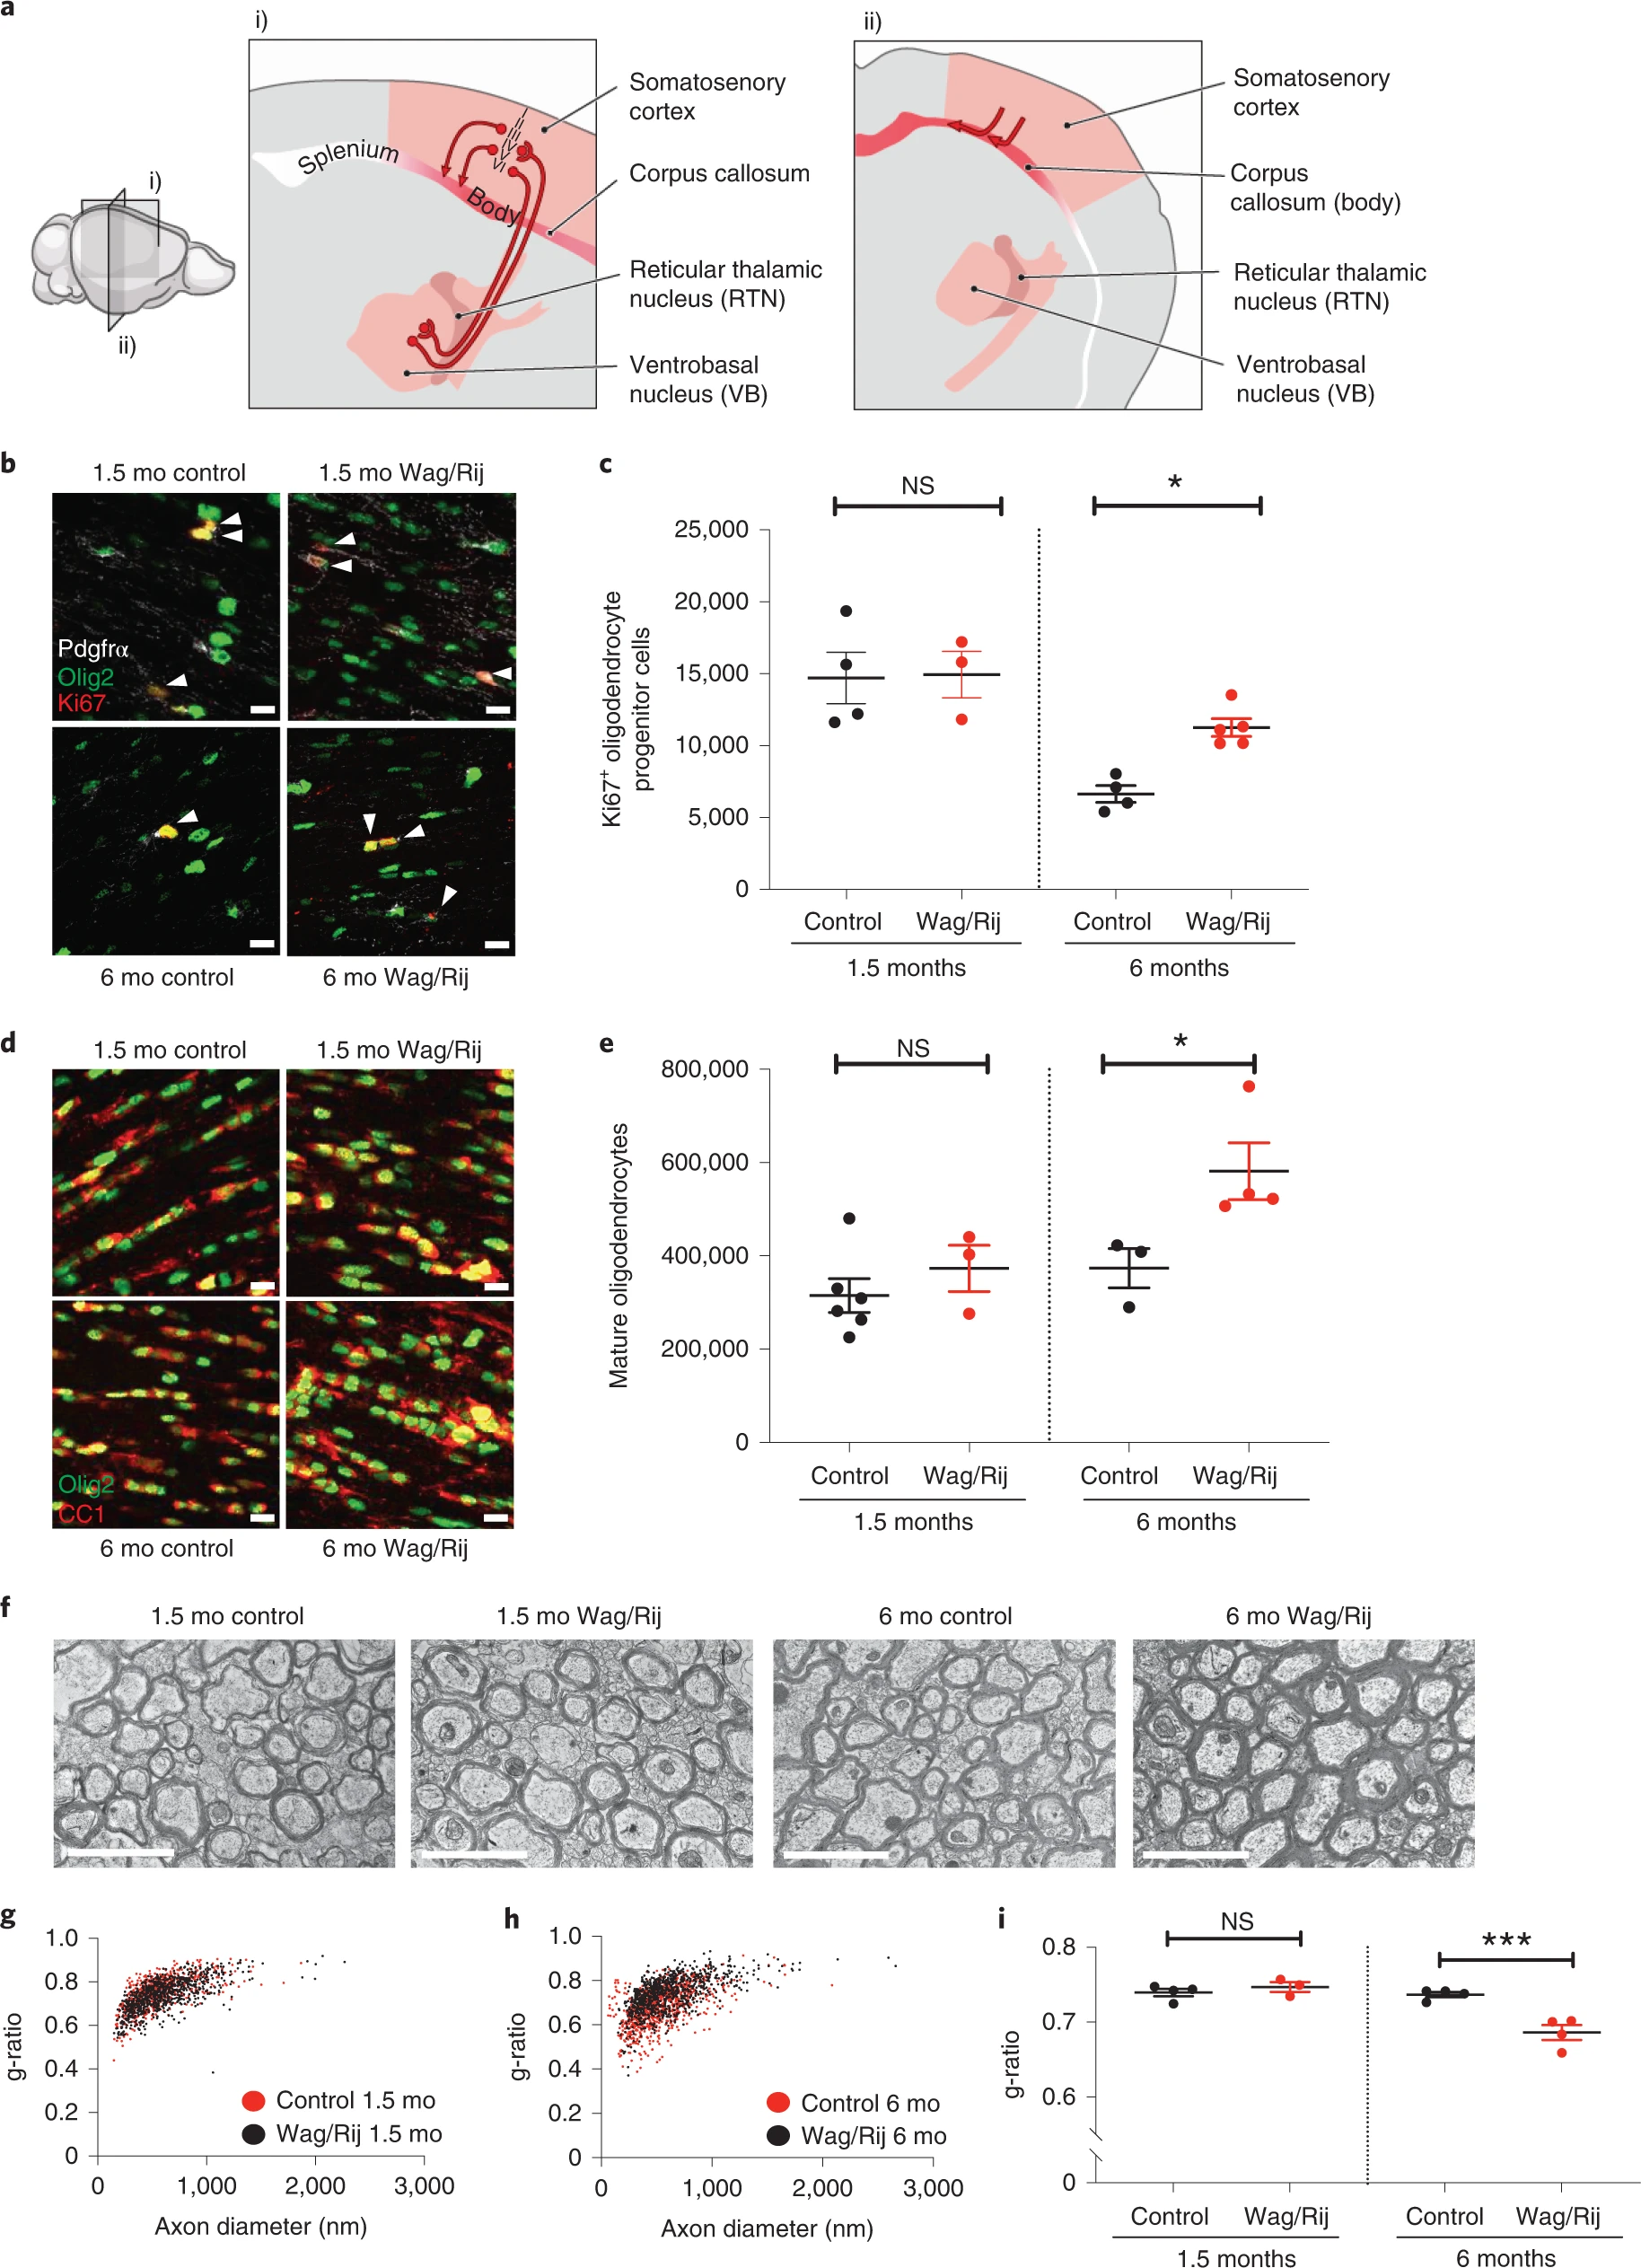
a, Sagittal (i) and coronal (ii) views of the absence seizure network (pink/red). Absence seizures are maximal in ventrobasal and reticular thalamic nuclei and somatosensory cortices and propagate across the corpus callosum body, with little involvement of occipital cortices and corpus callosum splenium. Illustration by Sigrid Knemeyer at SciStories. b, Representative photomicrographs of dividing callosal OPCs expressing Olig2 (green), PDGFRα (white) and Ki67 (red), indicated with arrowheads. Scale bars, 10 μm. c, Total Ki67+ OPCs at 1.5 months and 6 months in control and Wag/Rij rats. 1.5 months, n = 4 control and 3 Wag/Rij rats; 6 months, n = 4 control and 5 Wag/Rij rats. One-way ANOVA: F3,12 = 10.43, P = 0.0012. Post hoc Sidak’s test comparing Ki67+ OPCs in Wag/Rij versus controls at 6 months: P = 0.025, and at 1.5 months: P = 0.99. d, Representative photomicrographs of callosal mature oligodendrocytes of 1.5-month-old and 6-month-old control or Wag/Rij rats, co-expressing Olig2 (green) and CC1 (red). Scale bars, 10 μm. e, Total callosal oligodendrocytes in control and Wag/Rij rats. 1.5 months, n = 6 control and 3 Wag/Rij rats; 6 months, n = 3 control and 4 Wag/Rij rats. One-way ANOVA: F3,12 = 6.558, P = 0.0071. Post hoc Sidak’s test comparing oligodendrocyte quantity in 6-month-old Wag/Rij rats versus controls: P = 0.029; 1.5-month-old: P = 0.65. f, Representative transmission electron micrographs of axon cross-sections in the mid-sagittal corpus callosum body. Scale bar, 2 μm. Scatter plots of individual axon g-ratios from 1.5-month-old (g) and 6-month-old (h) rats; each dot represents the g-ratio of one axon. i, Mean g-ratios for each rat; 1.5 months: n = 4 control and 3 Wag/Rij rats; 6 months: n = 4 control and 4 Wag/Rij rats. One-way ANOVA, F3,11 = 17.09, P = 0.0002. Post hoc Sidak’s test, control versus Wag/Rij at 1.5 months, P = 0.72, and 6 months, P = 0.0004. Each dot represents one rat (c, e, i); data are shown with group mean ± s.e.m. Black dots, control; red dots, Wag/Rij. *P < 0.05, **P < 0.01, ***P < 0.001, NS, non-significant (P > 0.05).
To investigate whether absence seizures cause aberrant activity-regulated myelination within the seizure network, we began by assessing the proliferation of OPCs together with the number of mature oligodendrocytes in the mid-region (body) of the corpus callosum, focusing specifically on the area interconnecting the somatosensory cortices that is involved in the absence seizure network (Allen Brain Atlas, http://atlas.brain-map.org/). Given anatomical differences between Wag/Rij and Wistar (control) rats (Extended Data Fig. 1a), we used unbiased stereological methods to assess total cell numbers (Fig. 1b–e) as well as volume of the corpus callosum (Extended Data Fig. 1b) and oligodendrocyte density (Extended Data Fig. 1c). Before seizure onset, at 1.5 months of age, control rats and Wag/Rij (seizure) rats exhibit equivalent OPC proliferation in the corpus callosum. However, at 6 months of age, when seizures are well-established, Wag/Rij rats exhibit a 69% increase in dividing OPCs relative to age-matched control rats (cells co-expressing Ki67, PDGFRα and Olig2; 6,647 ± 585 dividing OPCs in control versus 11,259 ± 615 dividing OPCs in Wag/Rij; Fig. 1b–c). Compared to age-matched control rats, Wag/Rij rats also exhibit a 56% increase in Olig2, CC1-expressing mature oligodendrocytes at 6 months of age, indicative of increased oligodendrogenesis (mean ± s.e.m.: 373,697 ± 42,161 mature oligodendrocytes in control versus 581,490 ± 60,898 in Wag/Rij; Fig. 1d–e and Extended Data Fig. 1c). Both the total number and density of oligodendrocytes were increased, indicating that these differences were not a passive consequence of differences in callosal volume. In contrast, Wag/Rij and control rats exhibit similar numbers of oligodendrocytes at 1.5 months of age, before seizure onset (Fig. 1d–e). Given these findings indicating that oligodendrogenesis increases in parallel with seizure progression, we next investigated whether myelin structure is also altered. We used transmission electron microscopy to visualize cross-sections of myelinated axons in the mid-sagittal plane of the body of the corpus callosum (Fig. 1f), where oligodendrogenesis was assessed. We measured myelin sheath thickness relative to axon diameter, g-ratio4,6,11,35, in 1.5-month-old and 6-month-old Wag/Rij rats and Wistar controls. We found an increase in mean myelin sheath thickness (decreased g-ratio) in 6-month-old Wag/Rij rats compared to controls (control: 0.7368 ± 0.0036, Wag/Rij: 0.6862 ± 0.0099; Fig. 1h,i). This difference in myelin sheath thickness is similar in magnitude to functionally relevant changes in previous studies4,6,11 and is meaningful particularly considering that the dynamic range of central nervous system g-ratios is typically ~0.6–0.84,6,11,35. Differences in g-ratios were not observed before seizure onset at 1.5 months (Fig. 1g,i) and are not attributable to strain differences in axon diameter or total axon number either before (1.5 months) or after (6 months) onset of seizures (Extended Data Figs. 2a and 3a). There was no difference in the percentage of axons that were myelinated in Wag/Rij and controls rats at either 1.5 months or 6 months (Extended Data Fig. 3b); changes in myelin sheath thickness observed at 6 months were not restricted to a particular range of axon diameters (Extended Data Fig. 4a,b).
Absence seizures in rodents are most prominent in the somatosensory cortices33. We reasoned that, if abnormally increased myelination is caused by seizure activity, these changes would be specific to the seizure-affected regions. Therefore, we assessed myelin in the posterior corpus callosum (splenium), connecting cortical regions where seizure activity is less prominent in humans and rodents26,33. The seizure-associated myelin difference observed in the body of the corpus callosum was not found in the splenium, as shown in Extended Data Fig. 5. Taken together, these data demonstrate increased oligodendrogenesis and abnormally increased myelination in a temporal and anatomical pattern that parallels seizure activity.
Seizures are necessary for aberrant callosal myelination
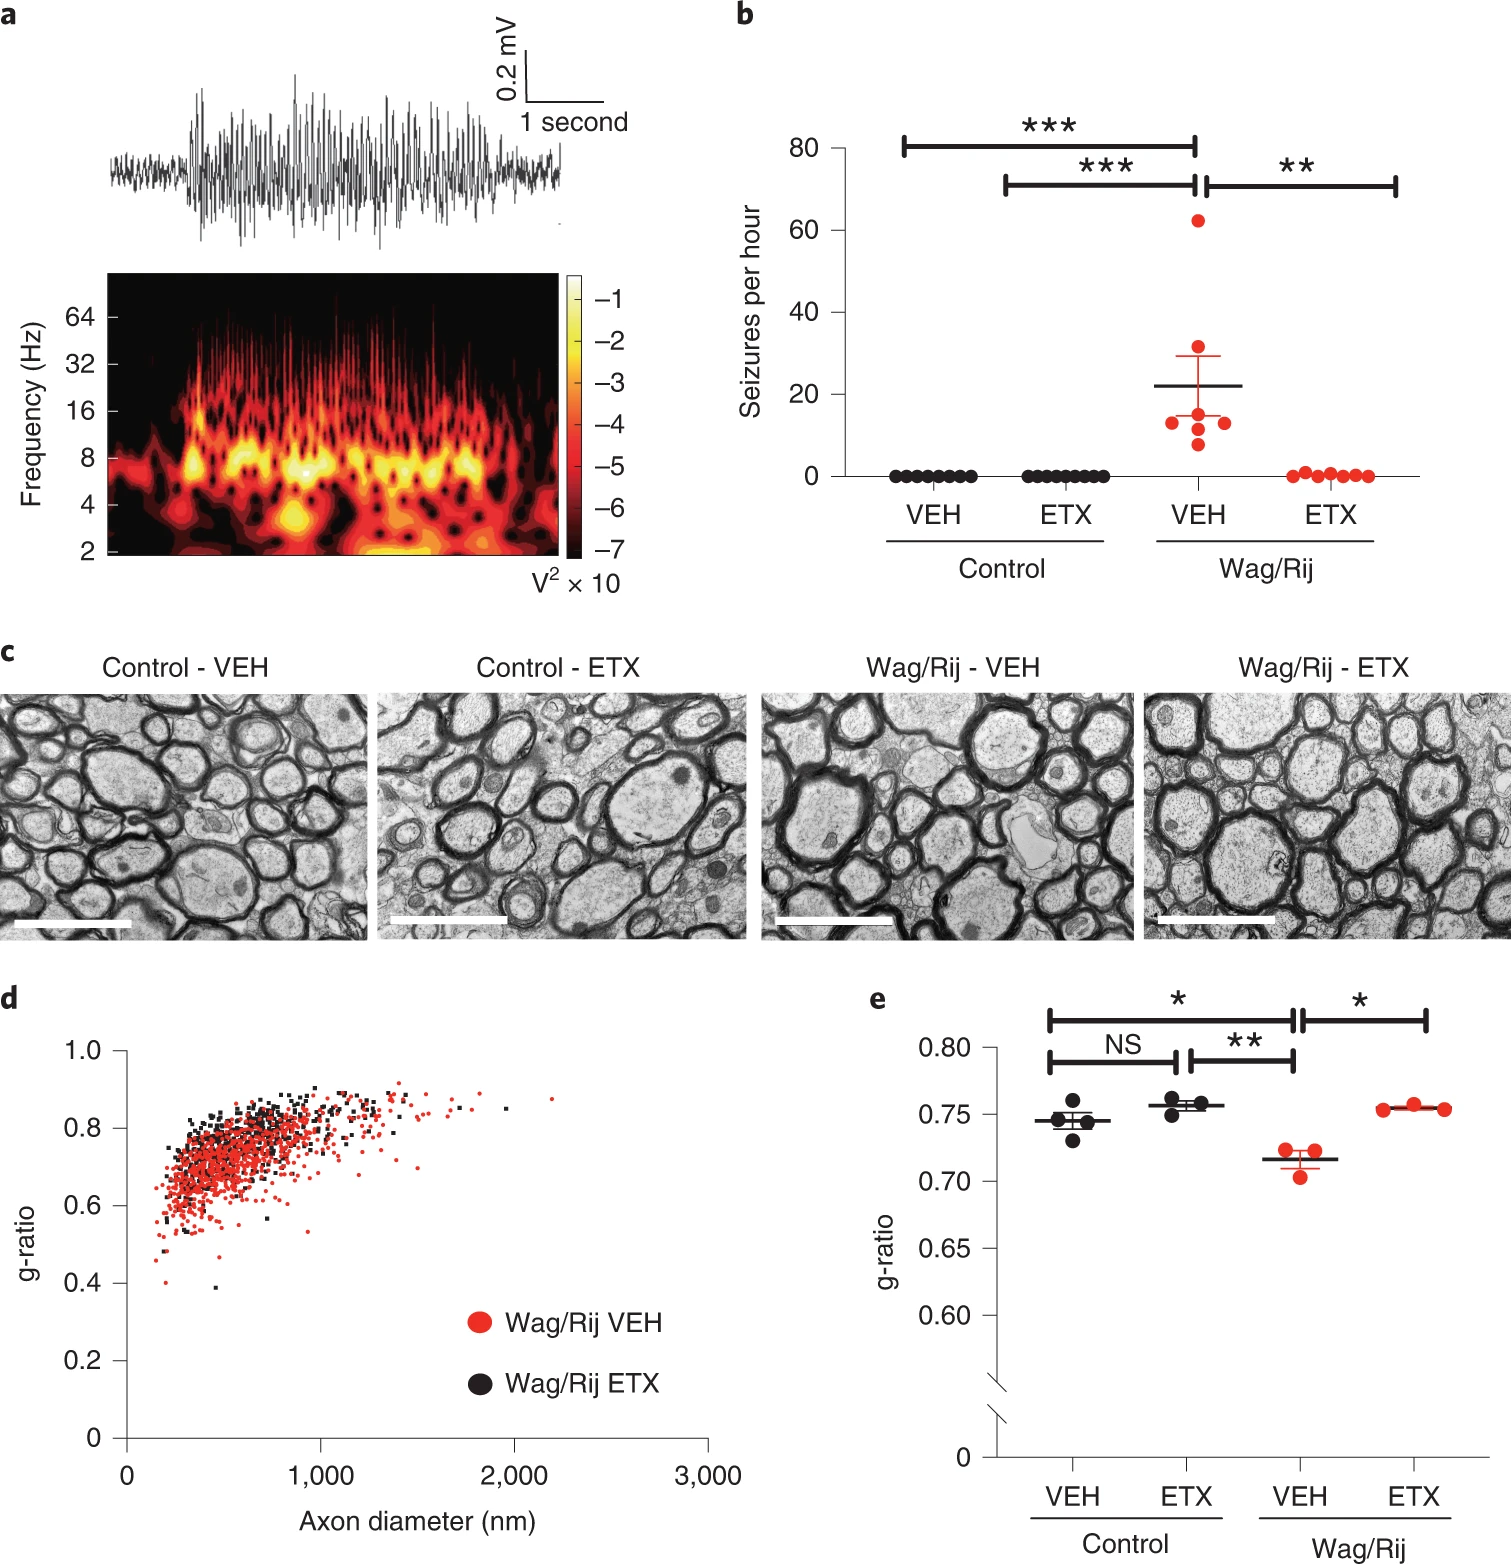
We reasoned that absence seizures likely induce aberrant activity-regulated myelination. To confirm that seizures are required for the observed increase in callosal myelination, we treated Wag/Rij and control rats with the anti-seizure drug ethosuximide (ETX) at ~300 mg/kg/day, a dose known to prevent or reduce seizures in Wag/Rij rats29. This dosing led to a mean plasma concentration of 101.3 ± 10.33 µg ml−1 (mean ± s.e.m., n = 20 rats), without signs of toxicity and similar to therapeutic levels in humans, typically between 40 µg ml−1 and 100 µg ml−1 (https://pubchem.ncbi.nlm.nih.gov/compound/Ethosuximide). Treatment was initiated at 1.5 months of age, before seizure onset. After 5 months of treatment, EEG at 6.5 months of age revealed frequent absence seizures of 5 +/- 0.5 second duration in vehicle-treated Wag/Rij rats (Fig. 2a,b) as previously described29. ETX robustly decreased or prevented seizures, as expected (Fig. 2b). We examined callosal myelination in control and Wag/Rij rats after vehicle or ETX administration at 7 months of age. Similarly to the findings described in Fig. 1, myelin sheath thickness was increased in vehicle-treated 7-month-old Wag/Rij rats compared to controls. However, seizure blockade with ETX treatment normalized myelin sheath thickness (g–ratio) in Wag/Rij rats (Fig. 2c–e). ETX did not influence g-ratio in control rats (Fig. 2e), nor did it affect axonal diameter in any group (Extended Data Fig. 2b).
Seizures are necessary for aberrant callosal myelination.
a, Representative spike-wave discharge seizure from a 6.5-month-old VEH-treated Wag/Rij rat (upper panel); spectral analysis demonstrating that the predominant seizure frequency is ~8 Hz (lower panel). b, Mean seizures per hour for each rat. Control-VEH, n = 8 rats; Control-ETX, n = 9 rats; Wag/Rij-VEH, n = 7 rats; Wag/Rij-ETX, n = 7 rats. Kruskal–Wallis analysis revealed significant variance in seizure burden (seizures per hour) between groups (Kruskal–Wallis statistic, 25.14, P < 0.0001). Dunn’s post hoc testing: Control-VEH versus Wag/Rij-VEH, P < 0.0001, Control-ETX versus Wag/Rij-VEH, P < 0.0001, Wag/Rij-VEH versus Wag/Rij-ETX, P = 0.0099. c, Representative transmission electron micrographs from the mid-sagittal body of the corpus callosum of 7-month-old rats. Scale bars, 2 μm. d, Scatter plots of g-ratios in 7-month-old VEH-treated or ETX-treated Wag/Rij rats. Each dot represents the g-ratio of one axon. e, Mean g-ratios for each 7-month-old Wag/Rij rat and control rat from measurements shown in d. Control-VEH, n = 4 rats; Control-ETX, n = 3 rats; Wag/Rij-VEH, n = 3 rats; Wag/Rij-ETX, n = 3 rats. One-way ANOVA revealed significant variance in group g-ratios F3,9 = 11.36, P = 0.0021. Tukey testing with corrections for multiple comparisons revealed decreased g-ratio (increased myelin thickness) in Wag/Rij-VEH rats with seizures compared to control rats (Control-VEH versus Wag/Rij-VEH, P = 0.015, and Control-ETX versus Wag/Rij-VEH, P = 0.0028). This increase in myelin sheath thickness was prevented with seizure blockade by ETX (Wag/Rij-VEH versus Wag/Rij-ETX, P = 0.0038), which normalized g-ratios (Control-VEH versus Wag/Rij-ETX, P = 0.5841, and Control-ETX versus Wag/Rij-ETX, P = 0.9952). ETX treatment did not alter g-ratios in control rats (Control-VEH versus Control-ETX, P = 0.4492). Each dot represents the mean for one rat (b, e) shown with group means ± s.e.m.; control rats are represented with black dots, and Wag/Rij rats are represented with red dots. *P < 0.05, **P < 0.01, ***P < 0.001, NS, non-significant (P > 0.05). VEH, vehicle; ETX, ethosuximide.
Source data
Together, these findings indicate that absence seizures increase myelination specifically within the seizure-affected network and suggest a mechanism of aberrantly increased activity-dependent myelination that could be deleterious (maladaptive), contributing to epilepsy pathogenesis. To further test this hypothesis, we sought to evaluate seizure-related myelin changes in a second model of absence seizures.
Increased myelination in a second model of generalized epilepsy
We next quantified oligodendrogenesis and myelin structure in a second, distinct rodent model of generalized epilepsy with absence seizures—Scn8a+/mut mice. Scn8a+/mut mice bear a heterozygous loss-of-function mutation in the voltage-gated sodium channel Nav1.6, which results in interneuron dysfunction in the reticular thalamic nucleus, thalamocortical hyper-synchrony and spontaneous 4–8-Hz absence seizures30,36. Scn8a+/mut mice exhibit seizures that begin around post-natal day (P) 21 and steadily increase in number until P35–P4530. The use of this mouse model confers the advantage of wild-type littermates on a congenic background and the opportunity for targeted genetic manipulation of activity-dependent myelination.
Before seizure onset (P21), callosal OPC proliferation and oligodendrocyte number were equivalent in Scn8a+/mut mice and littermate wild-type control mice (Scn8a+/+). In contrast, after seizures are well-established at P45, we found increased proliferating OPCs (Scn8a+/+: 8,562 ± 592 Ki67+ OPCs and Scn8a+/mut: 11,390 ± 502 Ki67+ OPCs; 33% increase) and increased mature oligodendrocytes (Scn8a+/+: 110,369 ± 20,189 oligodendrocytes and Scn8a+/mut: 207,716 ± 27,252 oligodendrocytes; 88% increase) in the corpus callosum of Scn8a+/mutanimals relative to littermate controls (Fig. 3a–d). Noting that corpus callosum volume is increased in Scn8a+/mut mice at P45 but not at P21 (Extended Data Fig. 6a), likely due to increased callosal myelination, we normalized oligodendrocyte quantities at P45 to callosal volume to assess cell density. This demonstrated increased mature oligodendrocyte density in the corpus callosum of Scn8a+/mut mice compared to Scn8a+/+ mice (Extended Data Fig. 6b). There was no difference in callosal OPC or oligodendrocyte cell death, assessed with TUNEL staining (Extended Data Fig. 6c,d). Because neuro-inflammation related to microglial and astrocyte reactivity can affect activity-dependent myelination11,37, we quantified microglia density and activation state and assessed astrocyte density and hypertrophy. We found a small increase in callosal microglial cell density in P45 Scn8a+/mut mice relative to Scn8a+/+ mice, whereas microglial reactivity (assessed with CD68 immunostaining) was equivalent between P45 Scn8a+/mut and Scn8a+/+ mice (Extended Data Fig. 7a–c). Astrocytes did not exhibit hypertrophy or increased cell density (Extended Data Fig. 7d–g). Taken together, these findings are not suggestive of a pronounced state of microglial or astrocyte reactivity in P45 Scn8a+/mut mice.

Increased oligodendrogenesis and myelination in Scn8a+/mut mice after epilepsy onset.
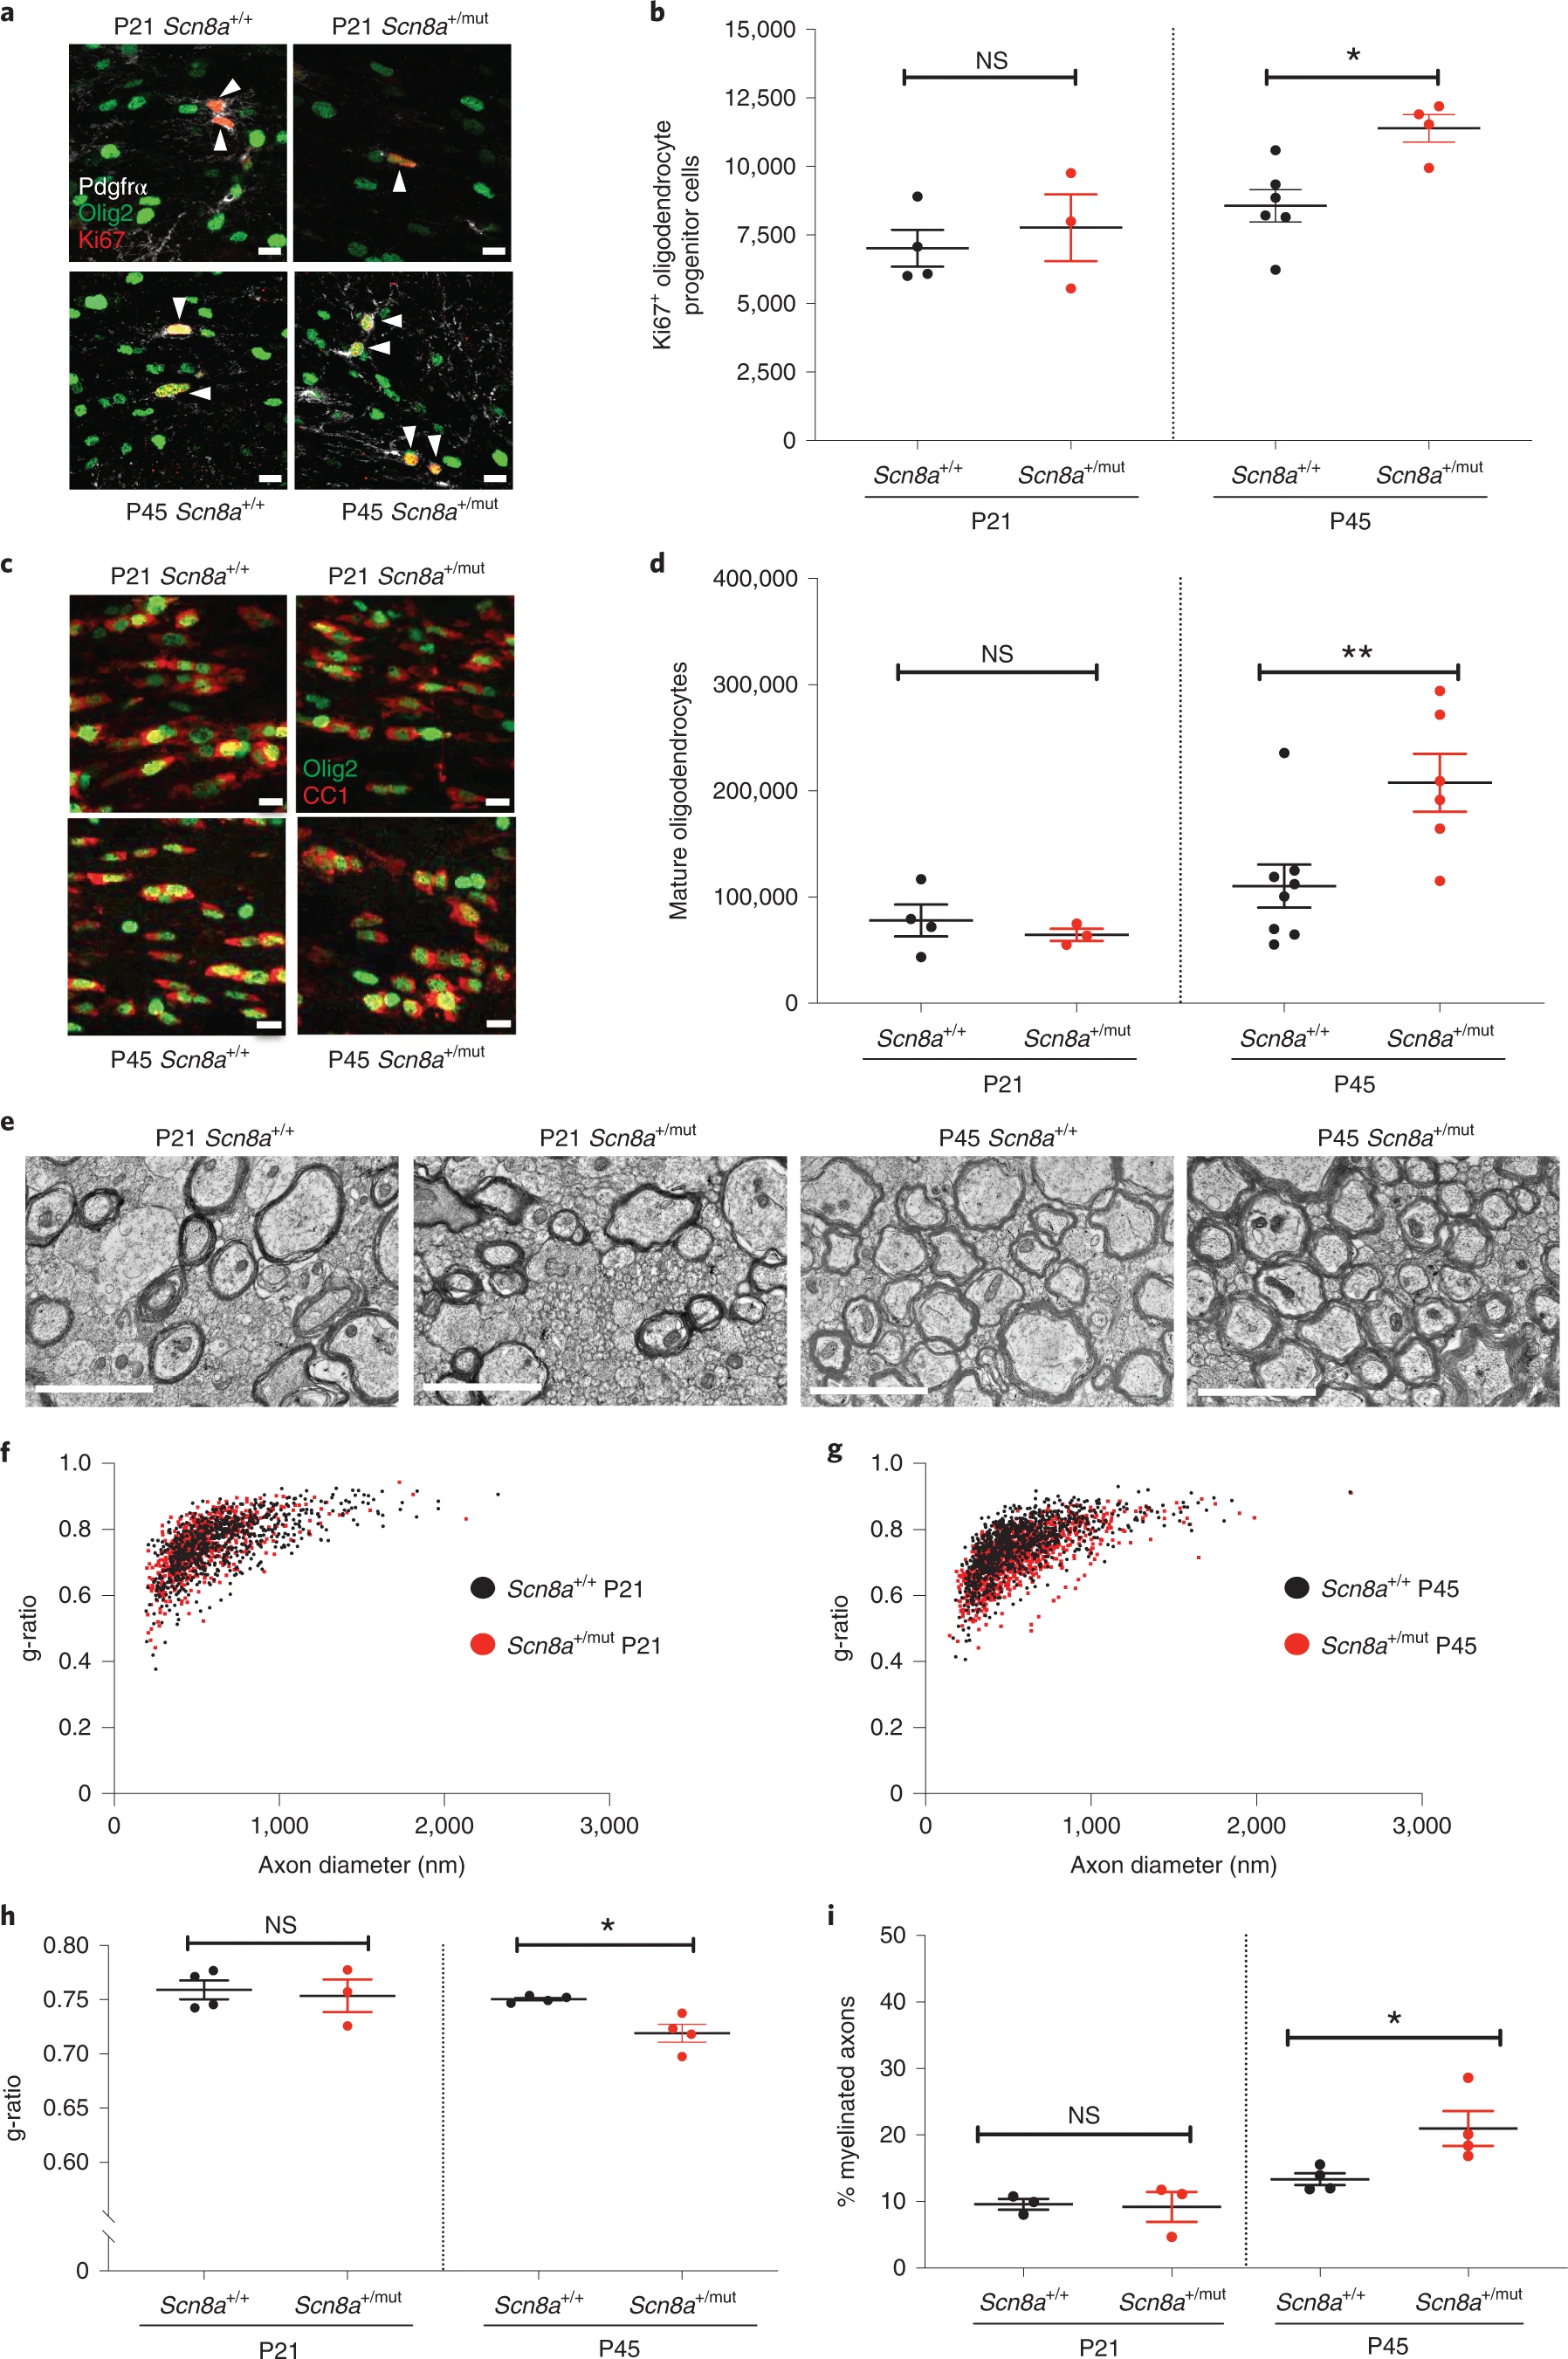
a, Representative photomicrographs of dividing callosal OPCs (Ki67: red, PDGFRα: white, Olig2: green), indicated with arrowheads. Scale bars, 10 μm. b, Total callosal Ki67+ OPCs in Scn8a+/+ and Scn8a+/mut mice. P21, Scn8a+/+ n = 4 mice; Scn8a+/mut n = 3. P45, Scn8a+/+ n = 6 mice; Scn8a+/mut n = 4. One-way ANOVA: F3,13 = 6.684; P = 0.0057. Post hoc Sidak’s test, Ki67+ OPCs in Scn8a+/mut versus Scn8a+/+ at P45: P = 0.021; at P21: P = 0.76. c, Representative photomicrographs of callosal mature oligodendrocytes expressing CC1 (red) and Olig2 (green). Scale bars, 10 μm. d, Total callosal oligodendrocytes in Scn8a+/+ and Scn8a+/mut mice. P21, Scn8a+/+ n = 4 mice; Scn8a+/mut n = 3 mice. P45, Scn8a+/+ n = 8 mice; Scn8a+/mut n = 6 mice. One-way ANOVA: F3,17 = 7.382; P = 0.0022. Post hoc Sidak’s test, Scn8a+/mut versus Scn8a+/+ mice at P45: P = 0.0069; at P21, P = 0.94. e, Representative transmission electron micrographs of callosal axons in P21 and P45 Scn8a+/+ and Scn8a+/mut mice. Scale bar, 2 μm. f, g, Scatter plots of individual axon g-ratios from P21 (f) and P45 (g) mice. Each dot represents the g-ratio of one axon. h, Mean g-ratios from Scn8a+/+ and Scn8a+/mut mice. P21, Scn8a+/+ n = 4 mice; Scn8a+/mut n = 3 mice. P45, Scn8a+/+ n = 4 mice; Scn8a+/mut n = 4 mice. One-way ANOVA: F3,11 = 4.471; P = 0.028. Post hoc Sidak’s test: g-ratios in Scn8a+/mut versus Scn8a+/+ at P45, P = 0.046; at P21, P = 0.89. i, Percentage of total callosal axons that are myelinated in Scn8a+/+ and Scn8a+/mut mice. P21: Scn8a+/+ n = 3; Scn8a+/mut n = 3. P45: Scn8a+/+ n = 4, Scn8a+/mut n = 4. One-way ANOVA: F3,10 = 8.565, P = 0.0041. Post hoc Sidak’s test: percent myelination in Scn8a+/+ versus Scn8a+/mut at P21, P = 0.9897; at P45, P = 0.0248. Each dot represents the mean for one mouse (b, d, h, i) shown with group means ± s.e.m.; Scn8a+/+ mice are represented by black dots, and Scn8a+/mut mice are represented with red dots. *P < 0.05, **P < 0.01, ***P < 0.001, NS, non-significant (P > 0.05).
Source data
Together, these findings indicate that absence seizures increase myelination specifically within the seizure-affected network and suggest a mechanism of aberrantly increased activity-dependent myelination that could be deleterious (maladaptive), contributing to epilepsy pathogenesis. To further test this hypothesis, we sought to evaluate seizure-related myelin changes in a second model of absence seizures.
Increased myelination in a second model of generalized epilepsy
We next quantified oligodendrogenesis and myelin structure in a second, distinct rodent model of generalized epilepsy with absence seizures—Scn8a+/mut mice. Scn8a+/mut mice bear a heterozygous loss-of-function mutation in the voltage-gated sodium channel Nav1.6, which results in interneuron dysfunction in the reticular thalamic nucleus, thalamocortical hyper-synchrony and spontaneous 4–8-Hz absence seizures30,36. Scn8a+/mut mice exhibit seizures that begin around post-natal day (P) 21 and steadily increase in number until P35–P4530. The use of this mouse model confers the advantage of wild-type littermates on a congenic background and the opportunity for targeted genetic manipulation of activity-dependent myelination.
Before seizure onset (P21), callosal OPC proliferation and oligodendrocyte number were equivalent in Scn8a+/mut mice and littermate wild-type control mice (Scn8a+/+). In contrast, after seizures are well-established at P45, we found increased proliferating OPCs (Scn8a+/+: 8,562 ± 592 Ki67+ OPCs and Scn8a+/mut: 11,390 ± 502 Ki67+ OPCs; 33% increase) and increased mature oligodendrocytes (Scn8a+/+: 110,369 ± 20,189 oligodendrocytes and Scn8a+/mut: 207,716 ± 27,252 oligodendrocytes; 88% increase) in the corpus callosum of Scn8a+/mutanimals relative to littermate controls (Fig. 3a–d). Noting that corpus callosum volume is increased in Scn8a+/mut mice at P45 but not at P21 (Extended Data Fig. 6a), likely due to increased callosal myelination, we normalized oligodendrocyte quantities at P45 to callosal volume to assess cell density. This demonstrated increased mature oligodendrocyte density in the corpus callosum of Scn8a+/mut mice compared to Scn8a+/+ mice (Extended Data Fig. 6b). There was no difference in callosal OPC or oligodendrocyte cell death, assessed with TUNEL staining (Extended Data Fig. 6c,d). Because neuro-inflammation related to microglial and astrocyte reactivity can affect activity-dependent myelination11,37, we quantified microglia density and activation state and assessed astrocyte density and hypertrophy. We found a small increase in callosal microglial cell density in P45 Scn8a+/mut mice relative to Scn8a+/+ mice, whereas microglial reactivity (assessed with CD68 immunostaining) was equivalent between P45 Scn8a+/mut and Scn8a+/+ mice (Extended Data Fig. 7a–c). Astrocytes did not exhibit hypertrophy or increased cell density (Extended Data Fig. 7d–g). Taken together, these findings are not suggestive of a pronounced state of microglial or astrocyte reactivity in P45 Scn8a+/mut mice.
Increased oligodendrogenesis and myelination in Scn8a+/mut mice after epilepsy onset.
a, Representative photomicrographs of dividing callosal OPCs (Ki67: red, PDGFRα: white, Olig2: green), indicated with arrowheads. Scale bars, 10 μm. b, Total callosal Ki67+ OPCs in Scn8a+/+ and Scn8a+/mut mice. P21, Scn8a+/+ n = 4 mice; Scn8a+/mut n = 3. P45, Scn8a+/+ n = 6 mice; Scn8a+/mut n = 4. One-way ANOVA: F3,13 = 6.684; P = 0.0057. Post hoc Sidak’s test, Ki67+ OPCs in Scn8a+/mut versus Scn8a+/+ at P45: P = 0.021; at P21: P = 0.76. c, Representative photomicrographs of callosal mature oligodendrocytes expressing CC1 (red) and Olig2 (green). Scale bars, 10 μm. d, Total callosal oligodendrocytes in Scn8a+/+ and Scn8a+/mut mice. P21, Scn8a+/+ n = 4 mice; Scn8a+/mut n = 3 mice. P45, Scn8a+/+ n = 8 mice; Scn8a+/mut n = 6 mice. One-way ANOVA: F3,17 = 7.382; P = 0.0022. Post hoc Sidak’s test, Scn8a+/mut versus Scn8a+/+ mice at P45: P = 0.0069; at P21, P = 0.94. e, Representative transmission electron micrographs of callosal axons in P21 and P45 Scn8a+/+ and Scn8a+/mut mice. Scale bar, 2 μm. f, g, Scatter plots of individual axon g-ratios from P21 (f) and P45 (g) mice. Each dot represents the g-ratio of one axon. h, Mean g-ratios from Scn8a+/+ and Scn8a+/mut mice. P21, Scn8a+/+ n = 4 mice; Scn8a+/mut n = 3 mice. P45, Scn8a+/+ n = 4 mice; Scn8a+/mut n = 4 mice. One-way ANOVA: F3,11 = 4.471; P = 0.028. Post hoc Sidak’s test: g-ratios in Scn8a+/mut versus Scn8a+/+ at P45, P = 0.046; at P21, P = 0.89. i, Percentage of total callosal axons that are myelinated in Scn8a+/+ and Scn8a+/mut mice. P21: Scn8a+/+ n = 3; Scn8a+/mut n = 3. P45: Scn8a+/+ n = 4, Scn8a+/mut n = 4. One-way ANOVA: F3,10 = 8.565, P = 0.0041. Post hoc Sidak’s test: percent myelination in Scn8a+/+ versus Scn8a+/mut at P21, P = 0.9897; at P45, P = 0.0248. Each dot represents the mean for one mouse (b, d, h, i) shown with group means ± s.e.m.; Scn8a+/+ mice are represented by black dots, and Scn8a+/mut mice are represented with red dots. *P < 0.05, **P < 0.01, ***P < 0.001, NS, non-significant (P > 0.05).
Source data
Transmission electron microscopy revealed that myelin sheath thickness was increased in association with established seizures at P45 in Scn8a+/mut mice relative to Scn8a+/+ littermate controls (Scn8a+/+ g-ratio: 0.75 ± 0016 and Scn8a+/mut g-ratio: 0.71 ± 0.008; Fig. 3e–h). Before seizure onset at P21, g-ratios were equivalent in Scn8a+/mut and littermate control mice (Fig. 3f,h). Mean myelinated axon diameter was equivalent at P21 and at P45 in Scn8a+/mut mice relative to Scn8a+/+ littermate controls, indicating that altered axon size does not contribute to g-ratio differences (Extended Data Fig. 2c). We also found an increase in the percent of axons that were myelinated at P45 in Scn8a+/mut mice compared to Scn8a+/+ mice, whereas total axon density was equivalent (Fig. 3i and Extended Data Fig. 6e). Similar to Wag/Rij rats, we did not observe that increased myelin sheath thickness in Scn8a+/mut mice was restricted to any particular axon size (Extended Data Fig. 4c,d).
Taken together, findings in Wag/Rij rat and Scn8a+/mut mouse models demonstrate that absence seizures induce increased OPC proliferation and increased oligodendrocyte generation together with abnormally increased myelination within the affected thalamocortical seizure network.
We next sought to determine the functional effect of seizure-associated myelination and tested the hypothesis that aberrantly increased myelination contributes to disease pathogenesis.
Myelin plasticity promotes generalized epilepsy progression
In the healthy brain, activity-dependent myelination is thought to promote coordination between regions within distributed neuronal networks, a process that supports multiple forms of learning7,11,12,13,14,15,16,17. We hypothesized that absence seizure-associated, abnormally increased myelination might contribute to thalamocortical network hypersynchrony30,32, increasing disease severity. To assess the functional effect of myelin plasticity in absence seizure progression, we sought to block activity-dependent myelination. Activity-dependent secretion of brain-derived neurotrophic factor (BDNF), and its subsequent signaling through the TrkB receptor on OPCs, is required for activity-dependent myelination of corticocallosal projection neurons11. Conditional deletion of TrkB from OPCs prevents activity-dependent oligodendrogenesis and myelination in the corpus callosum but does not alter homeostatic oligodendrogenesis nor lead to myelin loss11.
To enable blockade of activity-dependent myelination in Scn8a+/mut mice, we bred Scn8a+/mutand Scn8a+/+ littermates with floxed TrkB in the presence or absence of Cre, inducibly expressed under the PDGFRα promoter (Scn8a+/mut;TrkBfl/fl; PDGFRα::Cre-ER). Induction of Cre in this model with tamoxifen leads to TrkB deletion in about 80% of OPCs11; leak of Cre expression is not found in neurons38. Our cross yielded four littermate groups of mice: (1) Scn8a+/+;TrkBfl/fl (referred to as Scn8a+/+, wild-type mice with intact activity-dependent myelination); (2) Scn8a+/+;TrkBfl/fl;PDGFRα::Cre-ER (referred to as Scn8a+/+ OPC conditional knockout (cKO), wild-type mice with impaired activity-dependent myelination); (3) Scn8a+/mut;TrkBfl/fl (referred to as Scn8a+/mut, mice with absence seizures and intact activity-dependent myelination); and (4) Scn8a+/mut;TrkBfl/fl;PDGFRα::Cre-ER (Scn8a+/mut OPC cKO, mice with absence seizures and impaired activity-dependent myelination). All mice were treated with tamoxifen to ensure that any differences between genotype groups do not reflect differences in tamoxifen treatment. After tamoxifen treatment, mice were implanted for EEG to monitor seizures.
The original Scn8a+/mut mouse line is on a C3HeB/FeJ background, whereas Scn8a+/mut;TrkBfl/flmice have a mixed C3HeB/FeJ and C57/BL6 background. Background strain can influence the age of seizure onset and progression39. Therefore, we determined the timeline of epileptogenesis in Scn8a+/mut mice with this mixed background. In Scn8a+/mut mice (mixed background) with intact activity-dependent myelination, 4–8-Hz absence seizures begin around P90. Seizures then increase steadily and occur 20–30 times per hour, on average, by 6 months of age (Extended Data Fig. 8).
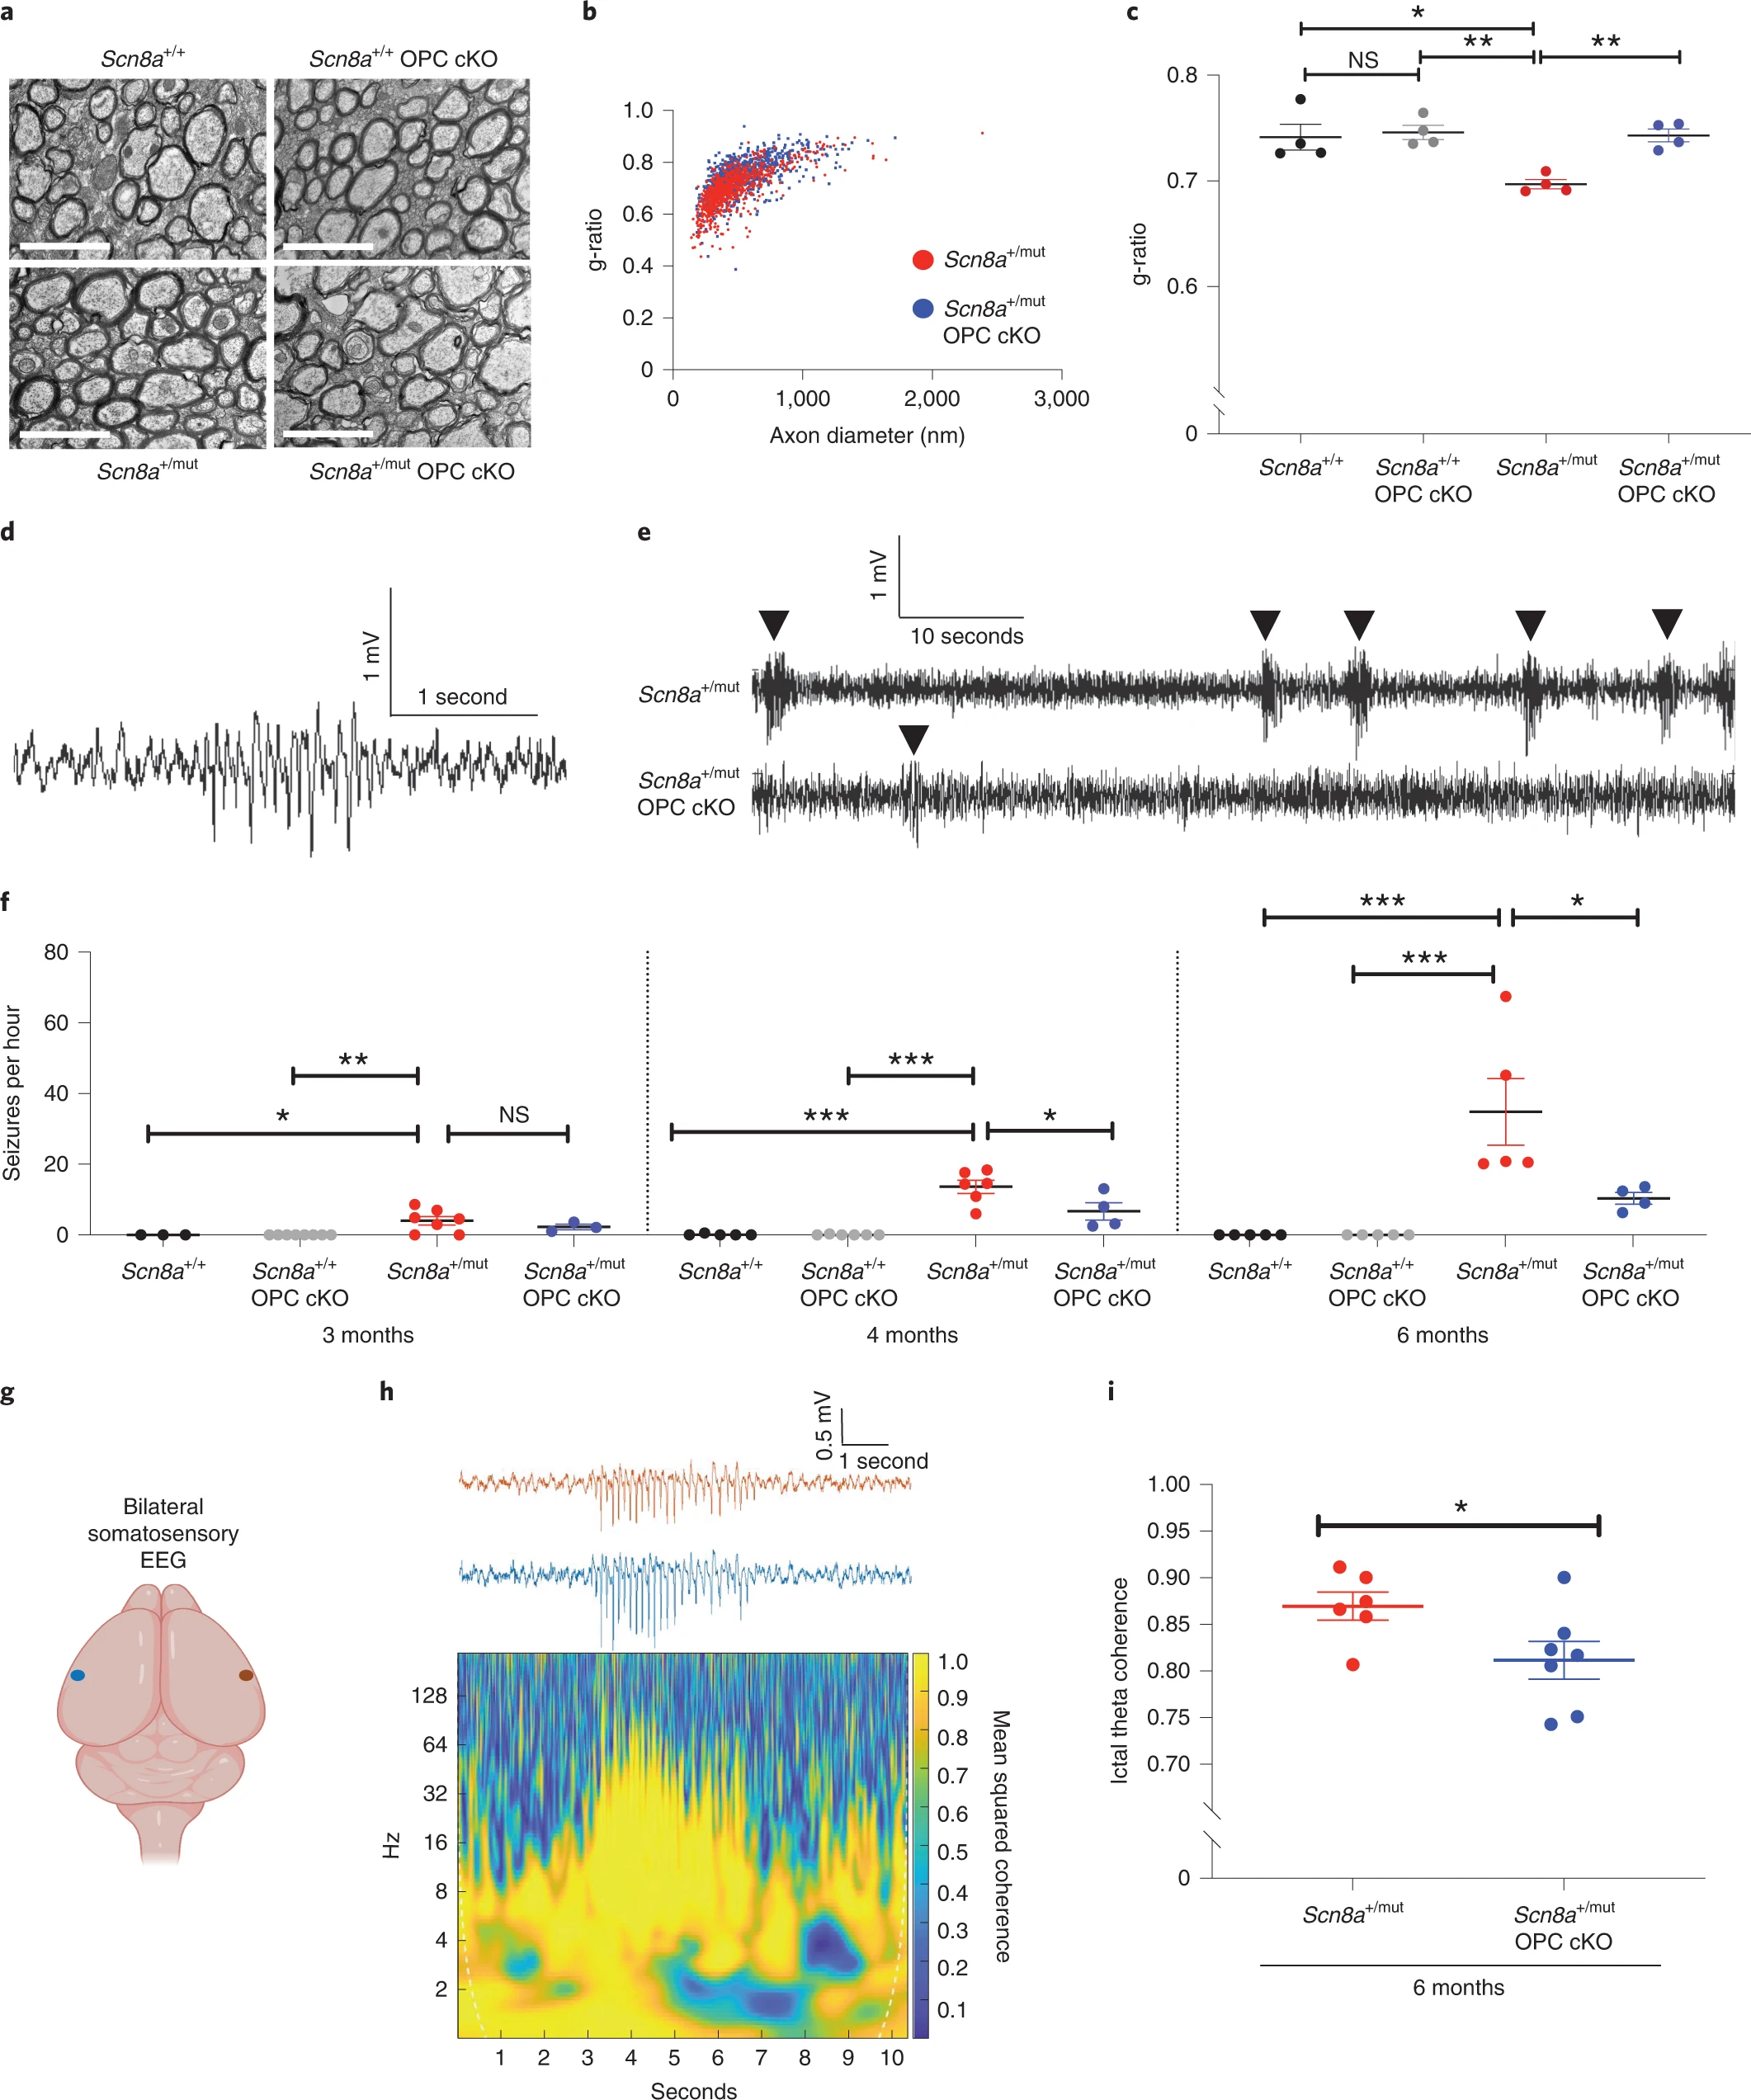
We next confirmed that deletion of the TrkB receptor from OPCs prevents the myelination response to seizures. As expected, deletion of the TrkB receptor from OPCs in Scn8a+/mut;TrkBfl/fl;PDGFRα::Cre mice (Scn8a+/mut OPC cKO) prevented the aberrantly increased myelination (decreased g-ratio) observed in Scn8a+/mut mice (Fig. 4a–c). Differences in g-ratios were not related to changes in axonal diameter (Extended Data Fig. 2d).
Activity-dependent myelination contributes to generalized epilepsy progression.
a, Representative transmission electron micrographs from corpus callosum body of 6-month-old mice. Scale bar, 2 μm. b, g–ratios from 6-month-old Scn8a+/mut and Scn8a+/mut OPC cKO mice. Each dot represents the g-ratio for one axon. c, Mean g-ratios for each mouse. Scn8a+/+, n = 4 mice; Scn8a+/+ OPC cKO, n = 4 mice; Scn8a+/mut, n = 4 mice; Scn8a+/mut OPC cKO, n = 4 mice. One-way ANOVA, F3,12 = 8.753, P = 0.0024. Post hoc Tukey’s test: Scn8a+/mut versus Scn8a+/+, P = 0.0085, Scn8a+/mut versus Scn8a+/+ OPC cKO, P = 0.0042. Scn8a+/mut OPC cKO mice versus Scn8a+/+, P > 0.99. Scn8a+/mut OPC cKO mice versus Scn8a+/+ OPC cKO, P > 0.99. Scn8a+/mut OPC cKO versus Scn8a+/mut mice, P = 0.0066. Scn8a+/+ versus Scn8a+/+ OPC cKO, P = 0.9756. d, Representative seizure in a Scn8a+/mut mouse. e, Continuous EEG recordings showing decreased incidence of seizures (arrowheads) in Scn8a+/mut OPC cKO mice at 6 months. f, Mean seizures per hour for each mouse. 3 months: Scn8a+/+, n = 3 mice; Scn8a+/+ OPC cKO, n = 8 mice; Scn8a+/mut, n = 7, Scn8a+/mut OPC cKO, n = 3 mice. One-way ANOVA: F3,17 = 5.814, P = 0.0063. Post hoc Tukey’s test: Scn8a+/+ versus Scn8a+/mut, P = 0.045. Scn8a+/mut versus Scn8a+/mut OPC cKO, P = 0.6. 4 months: Scn8a+/+, n = 5 mice; Scn8a+/+ OPC cKO, n = 6 mice; Scn8a+/mut, n = 6 mice, Scn8a+/mut OPC cKO, n = 4 mice. One-way ANOVA: F3,17 = 23.05, P < 0.0001. Tukey’s test: Scn8a+/+ versus Scn8a+/mut, P < 0.0001. Scn8a+/mut versus Scn8a+/mut OPC cKO, P = 0.0193. 6 months: Scn8a+/+, n = 5 mice; Scn8a+/+OPC cKO, n = 5 mice; Scn8a+/mut, n = 5 mice; Scn8a+/mut OPC cKO, n = 4 mice. One-way ANOVA: F3,15 = 11.13, P = 0.0004. Tukey’s test: Scn8a+/+ versus Scn8a+/mut, P = 0.0008. Scn8a+/mut versus Scn8a+/mut OPC cKO, P = 0.0218. g, Schematic of recording electrodes over somatosensory cortices, created with BioRender. h, Representative seizure from a 6-month-old Scn8a+/mut mouse with coherence plot. i, Ictal theta band coherence. Scn8a+/mut, n = 6 mice, Scn8a+/mut OPC cKO, n = 7 mice. Two-tailed t-test: P = 0.047. Each dot represents the mean for one animal (c, f, i), with group means ± s.e.m. Scn8a+/+, black dots; Scn8a+/+ OPC cKO, gray dots; Scn8a+/mut, red dots; Scn8a+/mut OPC cKO, blue dots. *P < 0.05, **P < 0.01, ***P < 0.001, NS, non-significant (P > 0.05).
Source data
Having elucidated the timeline of seizure progression and confirmed that TrkB deletion from OPCs prevents aberrant myelination in association with seizures, we next examined the number of seizures per hour in Scn8a+/mut mice lacking TrkB expression in OPCs (Scn8a+/mutOPC cKO). We found that seizure burden was strikingly reduced in Scn8a+/mut OPC cKO mice with impaired activity-dependent myelination. Scn8a+/mut mice with intact activity-regulated myelination exhibit a marked increase in the number of seizures per hour over time (Fig. 4d–f). In contrast, Scn8a+/mut mice with OPC-specific loss of TrkB expression that lack activity-regulated myelination exhibit substantially fewer seizures per hour, an effect that was sustained at least until 6 months of age (4-month time point: Scn8a+/mut seizures per hour, 13.64 ±1.88, and Scn8a+/mut OPC cKO seizures per hour, 6.7 ± 2.45, a 51% decrease; 6-month time point: Scn8a+/mut seizures per hour, 34.83 ± 9.45, and Scn8a+/mut OPC cKO seizures per hour, 10.34 ± 1.67, a 70% decrease. Data are shown in Fig. 4f). The mean duration of individual seizures in Scn8a+/mut mice was 2.3 ± 0.2 seconds, consistent with previously published findings in Scn8a+/mut mice30; the mean duration of individual seizures was not significantly different in Scn8a+/mut cKO mice (Extended Data Fig. 9a). Taken together, these findings indicate that activity-dependent myelination contributes to increasing absence seizure burden over time.
Myelin plasticity promotes ictal synchrony
Mechanisms of seizure genesis are thought to originate in intrinsic neuronal properties, independent from myelination30,32, raising the question of how changes in myelination might contribute to seizure burden. We hypothesized that aberrant myelination might promote seizure progression by further facilitating ictal synchrony once the thalamocortical network has already become prone to seizures. To test this idea, we assessed inter-hemispheric somatosensory cortical ictal coherence with EEG in 6-month-old Scn8a+/mut and Scn8a+/mut OPC cKO mice, focusing on theta frequency activity (4–8 Hz). We found that ictal EEG coherence between the somatosensory cortices was substantially diminished in Scn8a+/mut OPC cKO mice that lack activity-dependent myelination, compared to Scn8a+/mutmice (Fig. 4g–i). By contrast, there was no difference in ictal coherence in the bilateral visual cortices (Extended Data Fig. 10), where seizure activity is minimal and where myelin changes were not observed in Wag/Rij rats (Extended Data Fig. 5).
Blockade of myelin plasticity abrogates epilepsy progression
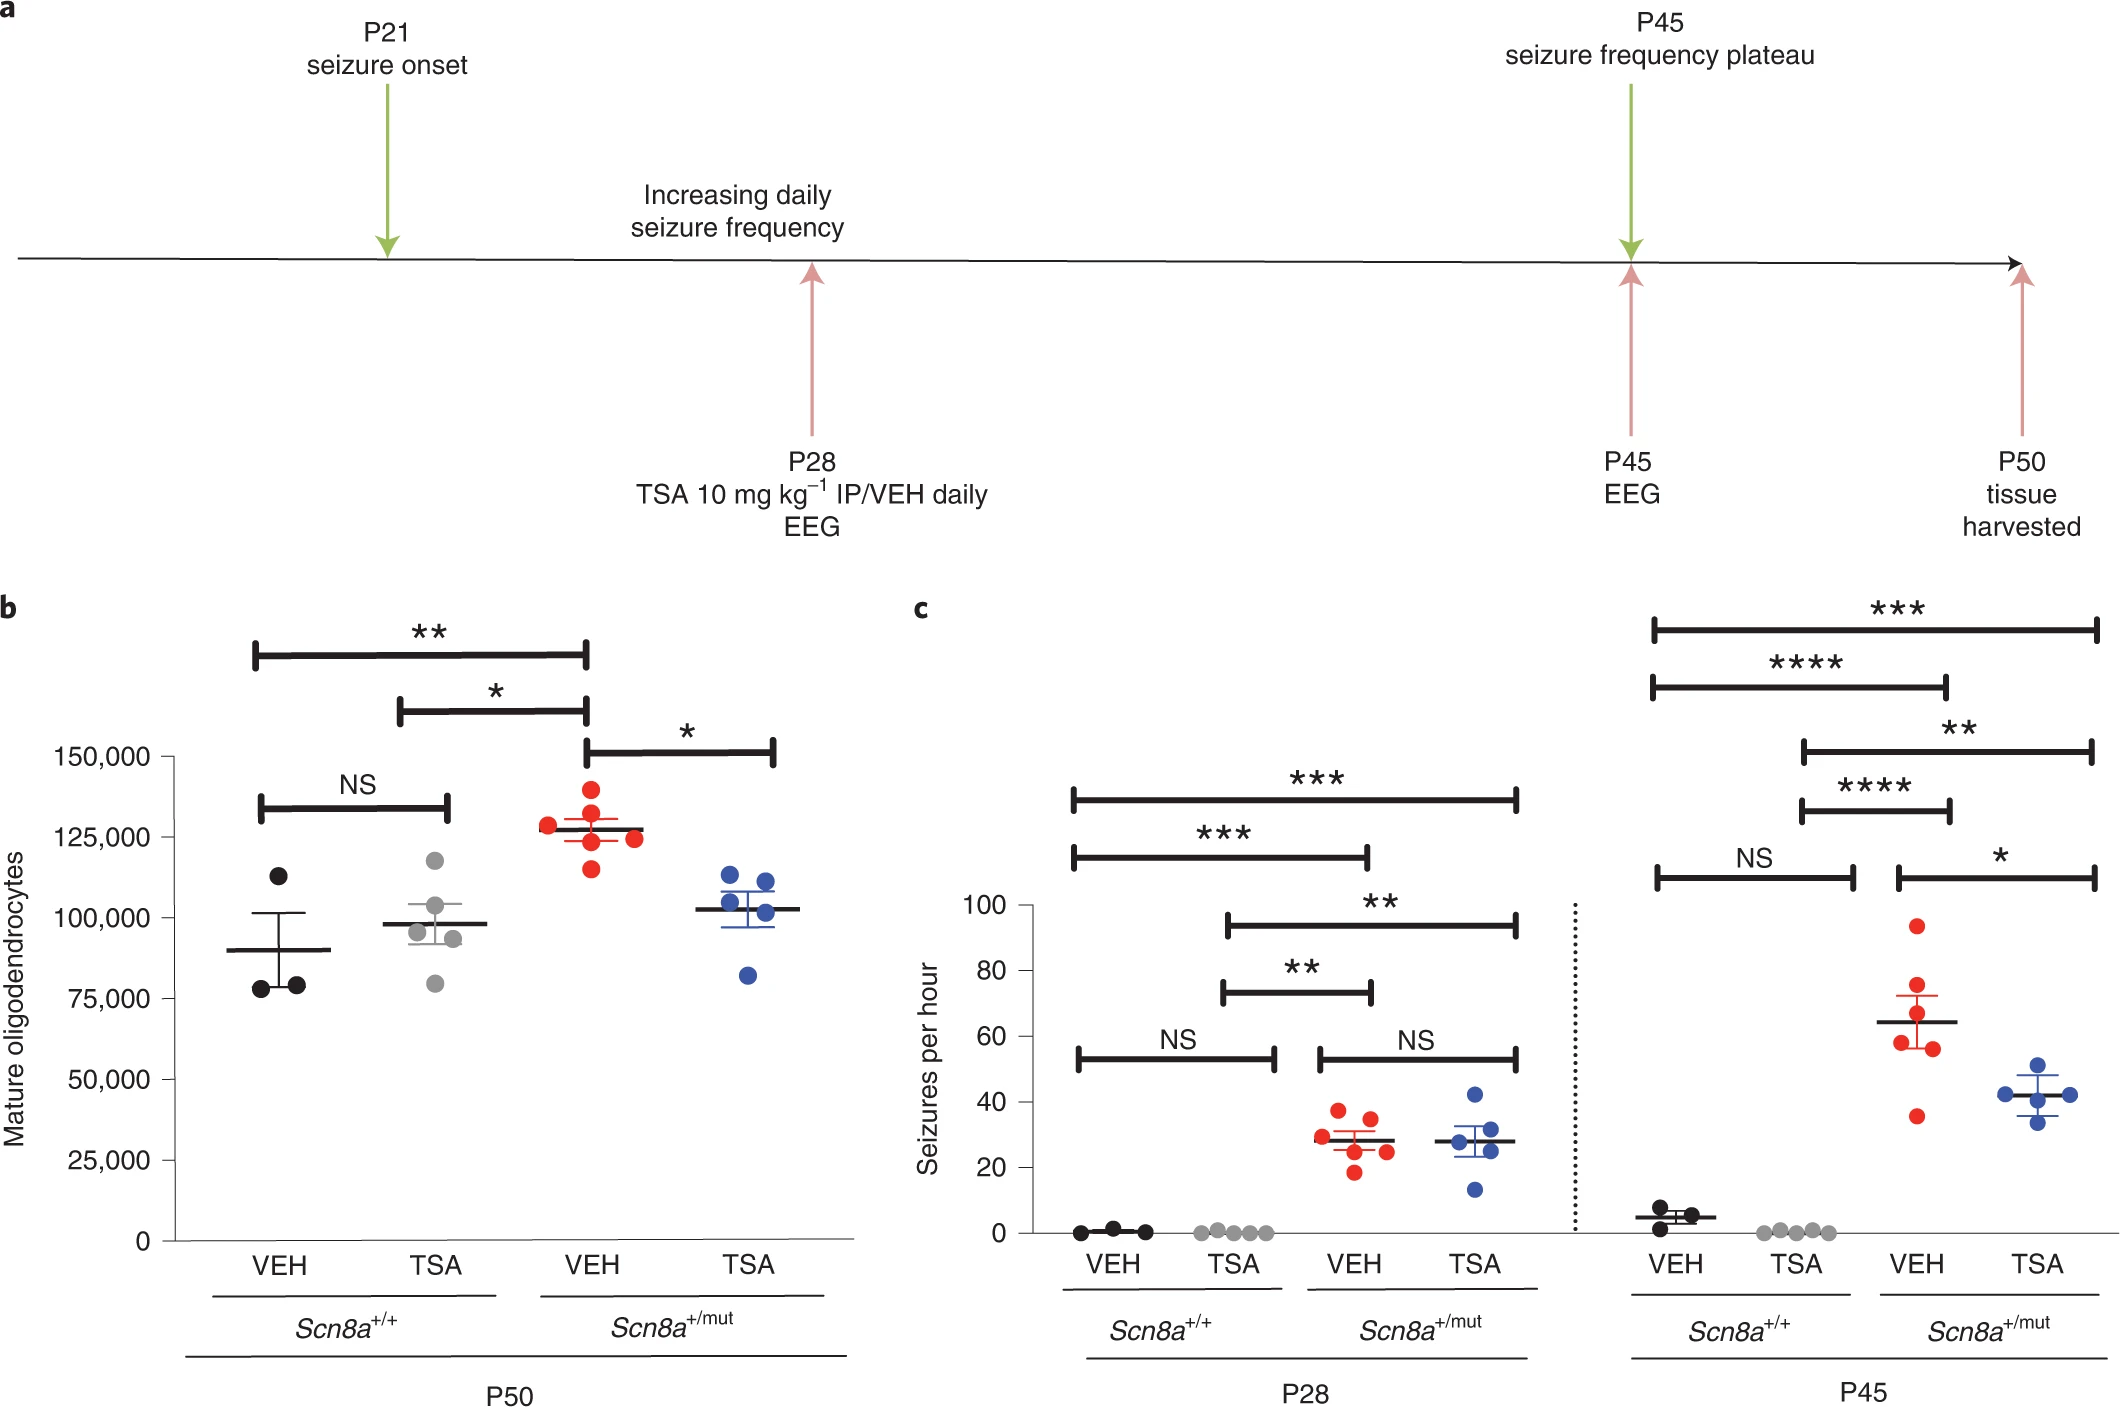
To further assess the role of activity-dependent myelination in seizure progression, and to assess the potential for targeting maladaptive myelination in the treatment of absence seizures, we next pharmacologically blocked activity-dependent myelination in Scn8a+/mutmice on the C3HeB/FeJ background (with seizure onset at P21), to assess the effect on seizure burden. Trichostatin A (TSA) is a histone deacetylase (HDAC) inhibitor that is known to prevent activity-dependent oligodendrogenesis and myelination by its interference in epigenetic changes that are required for the maturation of OPCs to myelinating oligodendrocytes4. To simulate a clinically relevant scenario in which therapeutics are administered after seizure onset in humans, we administered TSA daily beginning ~7 days after seizure onset, at P28 and continuing throughout the remaining period of seizure progression (Fig. 5a). We confirmed that TSA administration prevented abnormally increased callosal oligodendrogenesis in Scn8a+/mut mice (Fig. 5b). We next assessed the effect of pharmacological inhibition of activity-dependent myelination with TSA on seizure progression. Before treatment initiation on P28, seizure burden in vehicle-treated and TSA-treated Scn8a+/mut mice was equivalent (Fig. 5c). However, TSA treatment between P28 and P45 led to decreased seizure burden at P45 (vehicle-treated Scn8a+/mut mice: 64.33 ± 8.00; TSA-treated Scn8a+/mut mice, 42 ± 2.79, a ~35% decrease in the number of seizures, shown in Fig. 5c) without affecting seizure duration (Extended Data Fig. 9b), similar to genetic blockade of activity-dependent myelination described above.
Pharmacological blockade of oligodendrogenesis decreases generalized epilepsy progression.
a, Vehicle (VEH) or TSA HDAC inhibitor treatments were initiated at P28 (~1 week after seizure onset); EEG was recorded at P28 and P45. b, Total callosal oligodendrocytes for each mouse. Scn8a+/+-VEH, n = 3 mice; Scn8a+/+-TSA, n = 5 mice; Scn8a+/mut-VEH, n = 6 mice, Scn8a+/mut-TSA, n = 5 mice. One-way ANOVA: F3,15 = 7.433, P = 0.0028. Post hoc Tukey testing: VEH-treated Scn8a+/mut mice oligodendrocyte number versus Scn8a+/+-VEH (P = 0.0055) and Scn8a+/+-TSA (P = 0.011); TSA-treated Scn8a+/mut mice had fewer mature oligodendrocytes than Scn8a+/mut VEH-treated mice (P = 0.031), equivalent to Scn8a+/+-VEH (P = 0.59). c, Mean seizures per hour for each mouse. P28 time point: Scn8a+/+-VEH, n = 3 mice; Scn8a+/+-TSA n = 5 mice; Scn8a+/mut-VEH n = 6 mice; Scn8a+/mut-TSA n = 5 mice. One-way ANOVA: F3,15 = 25.95, P < 0.0001. Tukey testing at P28 showed no pre-treatment difference in seizure burden (seizures per hour) between Scn8a+/mut-VEH and Scn8a+/mut-TSA groups (P > 0.99). Scn8a+/mut-VEH versus Scn8a+/+-VEH, P = 0.0002; Scn8a+/mut-VEH versus Scn8a+/+-TSA, P < 0.0001; Scn8a+/mut-TSA versus Scn8a+/+-VEH, P = 0.0003; Scn8a+/mut-TSA versus Scn8a+/+-TSA, P < 0.0001. P45 time point: Scn8a+/+-VEH n = 3 mice; Scn8a+/+-TSA n = 5 mice; Scn8a+/mut-VEH n = 6 mice; Scn8a+/mut-TSA n = 5 mice. One-way ANOVA: F3,15 = 33.25, P < 0.0001. Tukey testing revealed increased seizures in Scn8a+/mut groups (Scn8a+/mut-VEH versus Scn8a+/+-VEH, P < 0.0001; Scn8a+/mut-VEH versus Scn8a+/+-TSA, P < 0.0001; Scn8a+/mut-TSA versus Scn8a+/+-VEH, P = 0.0032; Scn8a+/mut-TSA versus Scn8a+/+-TSA, P = 0.0003); however, Scn8a+/mut-TSA treated mice had fewer seizures than Scn8a+/mut-VEH (P = 0.032). Scn8a+/+-VEH versus Scn8a+/+-TSA: P28, P > 0.99; P45, P = 0.95. Each dot represents the mean for one mouse; group means ± s.e.m. are shown. Scn8a+/+-VEH, black dots; Scn8a+/+-TSA, gray dots; Scn8a+/mut-VEH, red dots; Scn8a+/mut-TSA, blue dots. *P < 0.05, **P < 0.01, ***P < 0.001, NS, non-significant (P > 0.05).
Source data
Discussion
Given that repetitive patterns of neuronal activity can regulate myelination, and that activity-dependent myelination can influence neural network function4,5,6,7,8,9,12,13,14,15,17, we reasoned that aberrant patterns of neuronal activity might induce oligodendrogenesis and myelination within seizure networks. Aberrant myelination could then reciprocally contribute to subsequent maladaptive network plasticity and epilepsy progression. Here, we found network-specific increased oligodendrogenesis and myelination only after the onset of absence seizures in two distinct rodent models (Wag/Rij rats and Scn8a+/mut mice) of generalized epilepsy. Increased myelination did not occur when seizures were pharmacologically prevented. Blocking activity-regulated myelination genetically or pharmacologically reduced ictal coherence within the seizure network and abrogated epilepsy progression, preventing the increase in seizure quantity that typically occurs over time in mice with intact myelin plasticity. Taken together, these findings illustrate maladaptive myelination that contributes to disease severity in models of generalized epilepsy.
Absence seizures result from abnormal, hypersynchronous oscillations in thalamocortical connections and generalize to involve both hemispheres of the brain by propagating across the corpus callosum28. Multiple epilepsy syndromes, including some that are lifelong and/or medically intractable, involve typical or atypical absence seizures. This includes the generalized genetic epilepsies and the often devastating developmental and epileptic encephalopathy Lennox–Gastaut syndrome25. Progressive forms of generalized epilepsy, and historical accounts of the natural history of untreated generalized epilepsy, involve increases in the number and severity of seizures over time, similar to what is seen in animal models25,31. Recent evidence indicates that this period of seizure progression is a key determinant of disease severity in humans as well as rodent models, such that early blockade of absence seizures and/or their downstream effects mitigates morbidity29,40. Thus, improved understanding of mechanisms underlying seizure progression could enable discovery of disease-modifying and/or curative treatments for generalized and other forms of epilepsy.
The findings presented here indicate that maladaptive myelination is a consequence of seizures and/or related changes in neural activity and does not precede the onset of recurrent seizures in the models that we studied, underscoring the primary role of neurons in epilepsy onset30,32. Our findings contrast with, but do not exclude, the possibility that, in some cases, developmental myelin differences preceding seizures, including within the corpus callosum, could also influence seizure severity41,42,43.
Both Wag/Rij rats and Scn8a+/mut mice exhibit increased myelin sheath thickness (decreased g-ratio), whereas Scn8a+/mut mice also exhibit an increase in myelinated axons, indicative of de novo myelination. These differences may be related to species and/or age of onset of seizures, which is ~2 months in Wag/Rij rats and ~P21 in Scn8a+/mut mice. The observed increases in callosal myelin sheath thickness were subtle, but this magnitude of change could substantially modulate network function given the dynamic range of g-ratios4,6,11,35. Small changes within this range can meaningfully modulate neuronal network function and behavior4,11. Whether the change in myelinated axon number reflects de novo myelination of previously unmyelinated axons or discontinuously myelinated axon segments44, and whether thicker myelin sheaths reflect newly generated internodes or activity-regulated remodeling by existing oligodendrocytes9, remain to be determined. Furthermore, it will be important to determine whether myelin internode length changes in association with seizures using models amenable to such measurements10. The effects of seizure-associated myelination on inhibitory interneurons and other neuronal subtypes remain to be explored10.
The observed myelination-dependent increase in ictal somatosensory EEG coherence suggests that aberrantly increased myelination within the thalamocortical network may increase the potential for highly synchronous activity that underlies absence seizures, thus enabling more frequent transition of the network to the seizure state. Activity-regulated myelination may also contribute to epilepsy by influencing spike timing-dependent synaptic plasticity, temporal dynamics involving interneuron function and neuronal excitability41,42,45,46 and/or by serving as a compensatory mechanism that provides metabolic support to enable rapid firing during seizures47.
Notably, HDAC inhibition has been shown to promote synaptic plasticity48; therefore, the observed effects of TSA treatment are unlikely to be explained by impaired synaptic plasticity. HDAC inhibition has also been shown to improve the course of absence epilepsy when initiated before seizure onset in Wag/Rij rats49, although the link to oligodendrogenesis has not been previously appreciated.
Our studies also suggest a link between BDNF signaling in OPCs and aberrant myelination that promotes seizures. The role of BDNF signaling in epilepsy is complex (Supplementary Note 1). An important consideration for our study is that BDNF to TrkB signaling was prevented specifically in OPCs (in Scn8a+/mut OPC cKO mice). Thus, we did not determine the effect of BDNF signaling blockade across all cell types (such as neurons) on seizures, nor do we conclude that BDNF antagonism would be a useful therapeutic for the treatment of absence seizures. Future work should explore whether additional molecular pathways that link neurons, oligodendrogenesis and myelination are involved in epilepsy (Supplementary Note 1).
The broader implications of these findings in rodent models to generalized epilepsy in humans remain to be fully elucidated, and several open questions remain for future study (Supplementary Note 2). Given the many mechanisms occurring in different human forms of epilepsy (including differences in age at onset, seizure location, seizure severity, etiology and associated neuro-inflammation), it is likely that the extent and role of myelin plasticity also varies between different types of epilepsy.
Mounting evidence suggests that a range of aberrant patterns of myelination may predispose brain networks toward seizures, through multiple mechanisms. Our findings in models of generalized epilepsy indicate that activity-regulated myelination, previously described in the setting of neural network adaptation related to learning, can also reinforce deleterious patterns of neural activity. Therefore, myelin plasticity may become maladaptive in some contexts. More myelin is not necessarily better, and seizure-related plasticity that increases myelination of axons beyond a normal optimum could disrupt the normal function, for example by interfering with precise oscillatory synchrony between brain regions that supports cognition7,12,13,14. This raises a key question about how oligodendrocyte lineage cells may sense and integrate circuit-level information to fine-tune circuit dynamics in an optimal manner in health. Further study of maladaptive myelination in disease contexts may elucidate novel strategies to treat neurological diseases, such as epilepsy, while also providing greater insight into mechanisms of myelin plasticity that promote function in the healthy brain.