
Interactions between SARS-CoV-2 N-Protein and α-Synuclein Accelerate Amyloid Formation

by Slav A Semerdzhiev, Mohammad A A Fakhree, Ine Segers-Nolten, Christian Blum, Mireille M A E Claessens
Excerpt from the article published in ACS Chem Neuroscience. 2021 Dec 3. doi: 10.1021/acschemneuro.1c00666.
Editor’s Highlights
- COVID-19 Protein Found to Speed Toxic Alpha-Synuclein Buildup which is believed to be central to the pathogenesis in Parkinson’s Disease.
- The most well-known example is the 1918 influenza pandemic (Spanish flu) which coincided with an increase in encephalitis lethargica, followed by numerous cases of post-encephalitic Parkinsonism.
- SARS-CoV-2 spike protein (S-protein) has no effect on α-synuclein aggregation, while SARS-CoV-2 nucleocapsid protein (N-protein) considerably speeds up the aggregation process.
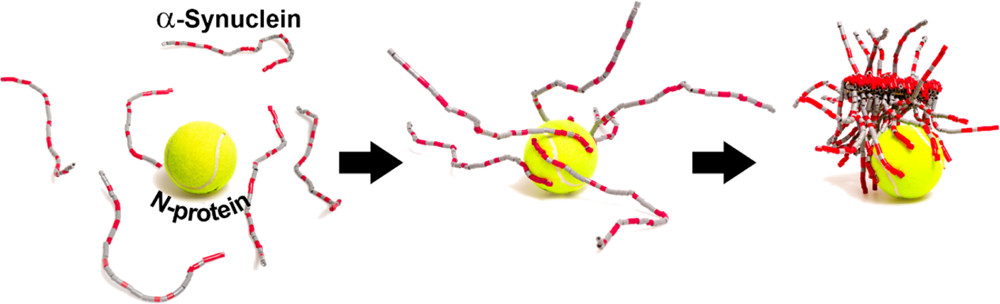
- In the initial interaction between the SARS-CoV-2 N-protein and αS, multiprotein complexes are formed. In the presence of N-protein, the onset of αS aggregation into amyloid fibrils is strongly accelerated, indicating that N-protein facilitates the formation of a critical nucleus for aggregation.
Abstract
First cases that point at a correlation between SARS-CoV-2 infections and the development of Parkinson’s disease (PD) have been reported. Currently, it is unclear if there is also a direct causal link between these diseases. To obtain first insights into a possible molecular relation between viral infections and the aggregation of α-synuclein protein into amyloid fibrils characteristic for PD, we investigated the effect of the presence of SARS-CoV-2 proteins on α-synuclein aggregation. We show, in test tube experiments, that SARS-CoV-2 spike protein (S-protein) has no effect on α-synuclein aggregation, while SARS-CoV-2 nucleocapsid protein (N-protein) considerably speeds up the aggregation process. We observe the formation of multiprotein complexes and eventually amyloid fibrils. Microinjection of N-protein in SH-SY5Y cells disturbed the α-synuclein proteostasis and increased cell death. Our results point toward direct interactions between the N-protein of SARS-CoV-2 and α-synuclein as molecular basis for the observed correlation between SARS-CoV-2 infections and Parkinsonism.
Introduction
Symptoms of SARS-CoV-2 infections that cause the current Covid-19 pandemic are not limited to the respiratory tract. The virus also affects other organs and tissues. SARS-CoV-2 has been found in neurons in different brain regions. (1,2) For many of the patients infected with SARS-CoV-2, acute and subacute neurological complications have been reported. (3−5)One of these complications, the loss of smell, is a common premotor symptom in Parkinson’s disease (PD). This symptom and the recent reports of cases of Parkinsonism in relatively young patients after a SARS-CoV-2 infection suggests that there may be a link between SARS-CoV-2 infections and the development of PD. (6−9)
The link between viral infections and neurodegeneration is established for some viruses. (10−13) The most well-known example is the 1918 influenza pandemic (Spanish flu) which coincided with an increase in encephalitis lethargica, followed by numerous cases of post-encephalitic Parkinsonism. (14,15) In more recent times, multiple indications of a relation between PD and viral infections have been reported. (13,16) Whether viral infections indirectly cause neurodegeneration via the immune system or if the effect is direct is unclear. (17)Neurodegenerative diseases such as Alzheimer’s disease (AD) and PD are protein aggregation diseases in which specific proteins, tau and Aβ peptide in AD and α-synuclein (αS) in PD, assemble into amyloid aggregates. Once started, the aggregation process spreads from cell to cell and the formed aggregates and deposits hamper brain function. (18−20) In a direct mechanism, the virus itself triggers the protein aggregation process. The virus would thus be responsible for the onset of the pathological protein aggregation process. Indeed, such a direct relation has been found for Aβ peptide aggregation (AD) in model cell lines and animals infected with herpes simplex and respiratory syncytial virus. (21)
Motivated by the first reports on a potential relation between SARS-CoV-2 infections and the development of Parkinsonism, we set out to investigate if there are indications that these two diseases are molecularly linked. We investigate the direct effect of SARS-CoV-2 proteins on αS aggregation and αS proteostasis in model systems. We show, in test tube experiments, that the SARS-Cov-2 spike protein (S-protein) has no effect on αS aggregation, while SARS-CoV-2 nucleocapsid protein (N-protein) considerably speeds up the aggregation process. N-protein and αS directly interact and this interaction results in the formation of complexes that contain multiple proteins and eventually amyloid fibrils. Microinjection of N-protein in SH-SY5Y cells disturbed the αS proteostasis and increased cell death. Our results suggest that the observed link between SARS-CoV-2 infection and PD might originate from a molecular interaction between virus protein and αS.
First cases that point at a correlation between SARS-CoV-2 infections and the development of Parkinson’s disease (PD) have been reported. Currently, it is unclear if there is also a direct causal link between these diseases. To obtain first insights into a possible molecular relation between viral infections and the aggregation of α-synuclein protein into amyloid fibrils characteristic for PD, we investigated the effect of the presence of SARS-CoV-2 proteins on α-synuclein aggregation. We show, in test tube experiments, that SARS-CoV-2 spike protein (S-protein) has no effect on α-synuclein aggregation, while SARS-CoV-2 nucleocapsid protein (N-protein) considerably speeds up the aggregation process. We observe the formation of multiprotein complexes and eventually amyloid fibrils. Microinjection of N-protein in SH-SY5Y cells disturbed the α-synuclein proteostasis and increased cell death. Our results point toward direct interactions between the N-protein of SARS-CoV-2 and α-synuclein as molecular basis for the observed correlation between SARS-CoV-2 infections and Parkinsonism.
Results and Discussion
The N-protein and S-protein are the most abundant, (partly) soluble structural SARS-CoV-2 proteins with copy numbers of ∼1000 and ∼300 monomers per virus particle, respectively. (21) The net positively charged N-protein packs the negatively charged viral genome into a higher order structure. (22) The N-protein has been assigned additional functions during viral infection. (23) The S-protein is anchored to the membrane where it is exposed on the virus surface and plays a role in receptor recognition, docking, and virus entry. (24,25) The S-protein is the main target in vaccination strategies since it induces the immune response of the infected host. The N-protein is also considered as a target for vaccine development because in the SARS family of viruses, the N-protein gene is more conserved and stable than the S-protein gene. (26)
Considering their abundance in infected cells, we assess if interactions between αS and N-protein or S-protein affect the aggregation of αS into amyloid fibrils in in vitro experiments. In these experiments, we followed the aggregation of αS in the presence and absence of N-protein and S-protein using Thioflavin T (ThT) fluorescence assays. The fluorescence of the dye ThT increases upon binding to amyloid fibrils. ThT fluorescence can therefore be used as a direct readout for fibril formation. A key parameter in such assays is the time to the first (visible) onset of aggregation or aggregation lag time. This time reflects how fast aggregation prone nuclei appear and amyloid fibrils are formed. It thus quantifies the impact of external triggers, such as additional proteins, on the aggregation of αS. In the absence of additional proteins, the onset of aggregation of αS is observed at time scales >240 h (Figure 1a). We observe no change in the outcome of the aggregation assay in the presence of S-protein (Figure 1a). Although a computational study recently suggested binding between S-protein and αS, we see no indication that this interaction promotes aggregation. (27) In the presence of N-protein, we see a strong decrease in the time to the onset of aggregation which reduces to <24 h (Figure 1b). On long time scales, a transition to a second plateau is observed in the presence of N-protein as discussed later in the text.
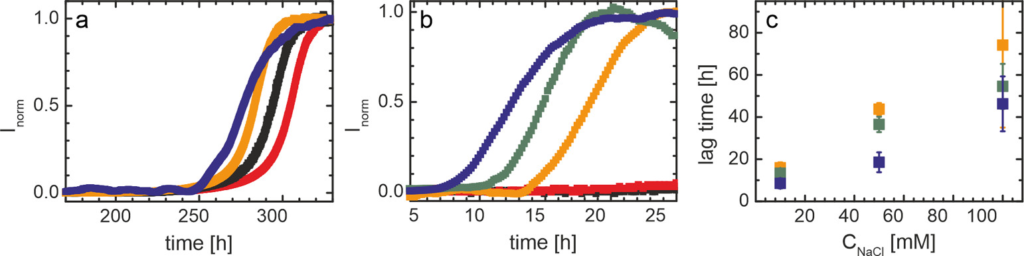
Aggregation of αS in the absence and presence of SARS-CoV-2 proteins.
(a) Aggregation assay of αS in the absence (black) and presence (color) of S-protein. The aggregation process is followed by recording the fluorescence of the amyloid-binding dye ThT. The assay was performed at a NaCl concentration of 10 mM with 50 μM αS and 0.1 μM (red), 0.5 μM (orange), and 1 μM (blue) S-protein. The ThT fluorescence intensity (I) is normalized to the plateau value. (b) ThT-based aggregation assay of αS in the presence of N-protein. The assay was performed at a salt concentration of 10 mM NaCl with 50 μM αS and 0 μM (black) 0.1 μM (red), 0.5 μM (orange), 0.8 μM (green), and 1 μM (blue) N-protein. The ThT intensity (I) is normalized to the initial plateau value. (c) Influence of the salt concentration on aggregation lag time for N-protein concentrations of 0.5 μM (orange), 0.8 μM (green), and 1 μM (blue) at an αS concentration of 50 μM. The points represent the mean of three independent measurements, and error bars show the standard deviation.
We exclude that the increase in ThT fluorescence is the result of N-protein aggregation; at identical concentrations, incubation of N-protein alone does not increase the ThT fluorescence intensity (see Figure S1). To quantify the change in the onset of αS aggregation, we determine the aggregation lag time. With increasing N-protein concentration, the αS aggregation lag time decreases. This concentration-dependent decrease evidences that direct interactions between αS and N-protein trigger αS aggregation.
N-protein and αS are net oppositely charged; near neutral pH (7.4), the calculated net charge amounts to +24e and −9e, respectively. Electrostatic attraction is therefore likely to play a role in the intermolecular interactions. Increasing the ionic strength of the solution, and thus screening the electrostatic charge, indeed increases the aggregation lag time (Figure 1c). However, also under higher salt conditions, the lag time is still considerably shorter in the presence of N-protein compared to the control. Moreover, the N-protein concentration dependence of the decrease in the lag time is conserved. Even at the highest salt concentration tested, the timescale at which we observe αS aggregation do not revert to the >240 h observed for αS alone. We therefore conclude that besides electrostatics, other attractive forces contribute to the interaction between αS and N-protein.
To obtain insights into the strength of the interaction between αS and N-protein, we performed a microscale thermophoresis (MST) assay. MST relies on changes in the diffusion coefficient of a particle upon binding to a partner. In the experiment, one of the partners needs to be fluorescently labeled and labeling the one with the lower molecular weight provides optimal contrast. In our experiments, we therefore fluorescently labeled αS. The concentration of fluorescently labeled αS was kept constant and the MST response was studied as a function of the N-protein concentration. The lower and higher plateau in the MST signal were interpreted as free αS and αS bound to N-protein, respectively (Figure 2a). We observe a sharp transition from the unbound to bound state of αS and an EC50 of approximately 0.3 μM. The steepness of the transition indicates that binding is cooperative.
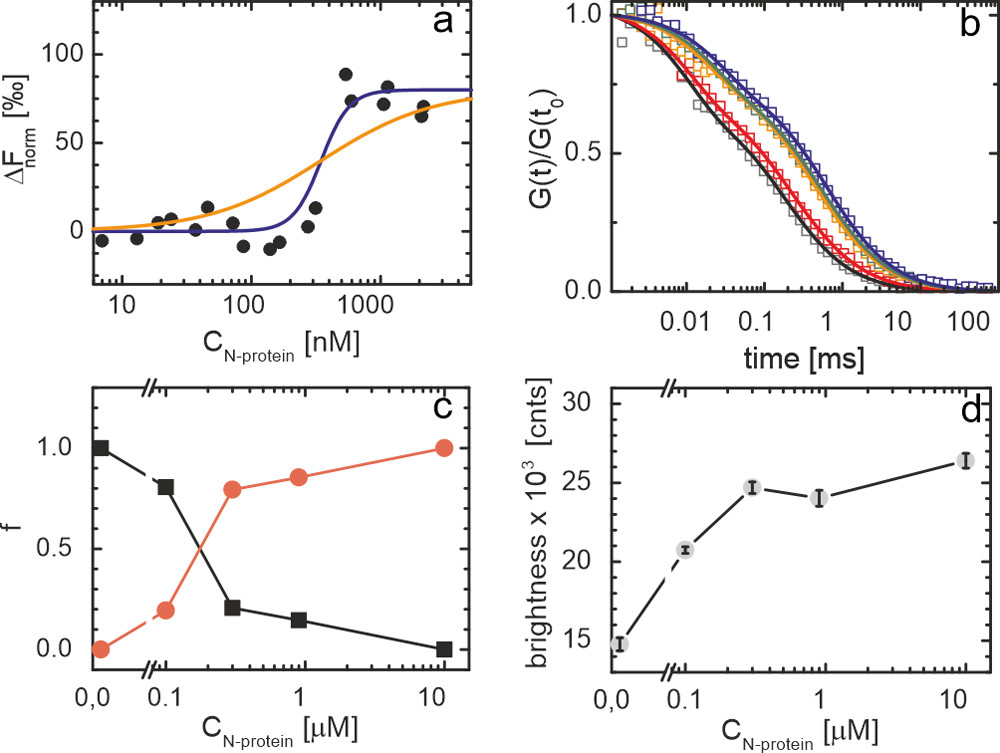
Interaction between αS and N-protein. (a) Binding curve characterizing the interaction between αS and N-protein obtained from MST experiments.
MST data points are shown in black. The lines indicate binding with a Hill coefficient of 1 (orange) and 4 (blue) and an EC50 of 0.3 μM. These curves serve as a guide to the eye. (b) FCS autocorrelation curves normalized to G(t0) (where t0 = 0.001 ms) (hollow symbols) of fluorescently labeled αS in the presence of 0 μM (black), 0.1 μM (red), 0.3 μM (orange), 0.9 μM (green), and 1.0 μM (blue) N-protein. Not all data points are shown for clarity. Fits to the autocorrelation curves are visible as lines with the corresponding color. In fitting the curves, a triplet fraction was considered and a fast and a slow diffusing component when necessary. (c) Fractions (f) of the slow (red) and fast (black) diffusing components obtained from the fits to the autocorrelation curves shown in (b). (d) Average particle brightness as a function of the N-protein concentration. The errors bars show the standard deviation in the observed brightness.
Fluorescence correlation spectroscopy (FCS) experiments were performed to obtain first insights into the number of αS molecules in αS/N-protein complexes. In the FCS experiment, αS was fluorescently labeled. Upon increasing the N-protein concentration, we observe a strong shift in the correlation curves to longer times, indicating the formation of slow diffusing complexes (Figure 2b). For αS alone, the FCS autocorrelation curve can be fitted to a single diffusing species with a diffusion coefficient of approximately 86 μm2/s, in agreement with the expected size of the protein and earlier findings. (28) With increasing N-protein concentration, a second slower diffusing species with a diffusion coefficient of approximately 27 μm2/s appears. In Figure 2c, we plot the fraction of both the slow and fast diffusing species as a function of the N-protein concentration. In agreement with the MST data, we observe a transition from the unbound to bound state that is cooperative and an EC50 of ∼0.2 μM. Concomitant with the appearance of the αS/N-protein complex, we observe an increase in the average brightness of the diffusing protein complexes (Figure 2d). In the αS/N-protein complex, the brightness increased by a factor of 1.8 times compared to unbound αS. Considering that of the total αS concentration of 20 nM, only half was labeled and ignoring the possible fluorescence quenching due to fluorophore–fluorophore interactions that have been observed in other protein systems under certain conditions, this indicates that on average, 3 to 4 αS proteins are present in an αS/N-protein complex. (29) Note that although this indicates that N-proteins accumulate αS, the FCS experiment was performed in excess of N-protein. The aggregation experiments were performed in excess of αS; accumulation of even higher numbers of αS on N-protein is therefore likely. We conclude that the decrease in αS aggregation lag time in the presence of N-protein results from direct interactions between the two protein species and the accumulation of αS on N-proteins.
The increase in ThT fluorescence intensity during αS aggregation in the presence of N-protein deviates from the typically observed pattern. Instead of the typical single step nucleation and growth process, we observe two growth steps. At longer time scales, a second, higher, plateau in the ThT fluorescence intensity appears (Figure 3a). To verify that in both plateaus the observed ThT fluorescence results from the formation of amyloid fibrils, we performed atomic force microscopy (AFM) experiments. We obtained samples for AFM experiments that cover both the first and second plateau in ThT fluorescence. AFM images obtained from samples in both plateaus in ThT fluorescence show the presence of helical amyloid fibrils with a mean height of approximately 8 nm (Figure 3b,c). The AFM images, however, indicate that the morphology of the fibrils is different in both plateaus. In the first plateau, fibrils of two different morphologies can be discriminated. These fibrils differ in helical periodicity. To determine the periodicity of the helix, a discrete Fourier transform (DFT) was performed on the images of fibrils formed in both plateaus. We observe two clear peaks in the DFT analysis at periodicities of approximately ≈130 and ≈90 nm (Figure 3d). The morphology of fibrils in the samples obtained in the second plateau is homogeneous (Figure 3d). DFT analysis shows that these fibrils have a periodicity of 130 nm (Figure 3d). This periodicity agrees with previous AFM and cryo-electron microscopy studies on the structure of αS amyloid fibrils in the absence of N-protein. (30) N-protein speeds up the formation of αS fibrils but does not change the morphology of fibrils observed after long time incubation.
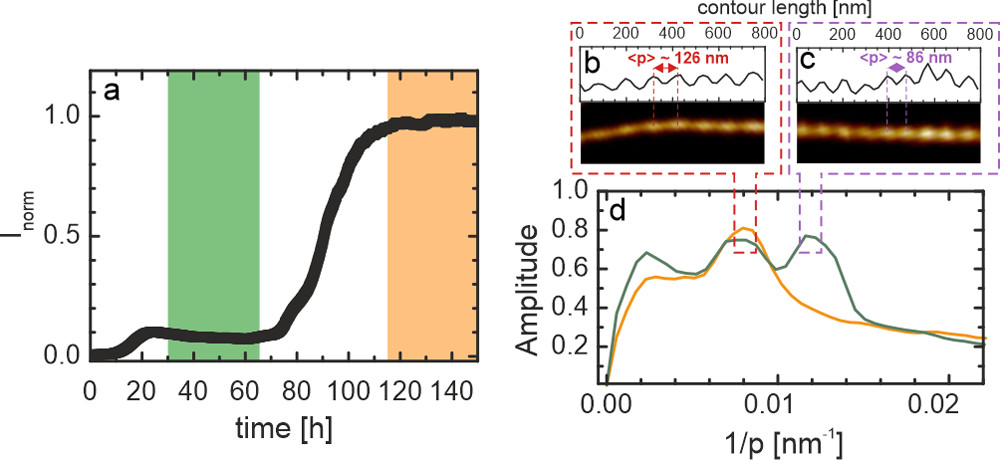
Aggregation of αS into amyloid fibrils in the presence of N-protein.
(a) Full ThT aggregation curve of αS in the presence of N-protein (1 μM N-protein, 50 μM αS, and 50 mM NaCl). The data are normalized to the final plateau in ThT intensity. The colors refer to the color coding in (d). (b,c) In the AFM images, two distinctly different fibril populations, with different morphologies, can be discriminated. The cross sections along the length of the fibrils (top) show that these fibrils differ in helical periodicity. (d) Discrete Fourier analysis on fibrils obtained in the first (green) and second (orange) plateau. In first plateau, two populations with different periodicities (p) of ≈90 and ≈130 nm are observed (green line). The peak at low 1/p values is an analysis artifact. In the second plateau, fibrils with a p = 130 nm dominate the population and in the analysis, fibrils with a periodicity p = 90 nm are no longer visible (orange line). A total of 79 and 72 fibrils were analyzed for the first and second plateau, respectively.
Above we have shown proof that the direct interaction between N-protein and αS triggers αS aggregation into amyloid fibrils in in vitro experiments. Next, we have conducted microinjection experiments to investigate the effect of the presence of N-protein in a cellular context. After infection, SARS-CoV N-proteins are predominantly found in the cytoplasm. (26,31−34) From literature data, we estimate the concentration of N-protein in infected cells to be of the order of 500 nM. (35) The injected N-protein concentration and injection volume were chosen to approximately result in this concentration in the cells and to mimic concentrations expected in infections (see the Materials and Methods).
The intrinsically disordered protein αS has been suggested to have many functions. In the cell, αS is found on trafficking vesicles and its main function most likely involves membrane remodeling in membrane trafficking processes. (36−43) Bound to the membranes of vesicles, αS adopts an α-helical conformation that can be discriminated from the unstructured protein (or other conformational states) in Förster resonance energy transfer (FRET) experiments. (44,45) The FRET probes used in in vitro experiments have also been applied to identify and localize membrane-bound αS in cells. (46) It is thus possible to use FRET to discriminate between conformational sub-ensembles that potentially represent different functions and thereby gain insights into the αS proteostasis.
SH-SY5Y cells express αS and are a well-established neuronal cell model in PD research. With these cells, two different sets of experiments were performed. In one set, single cells were microinjected with both FRET-labeled αS and N-protein and fixed 5 days after injection. In a second set of experiments, the cells were injected with FRET-labeled αS and N-protein and additional unlabeled αS and fixed 3 days after injection. We expect that the redistribution of αS from functional to dysfunctional states is a slow process. We hypothesize that by either giving the cells more time or by increasing the αS concentration, this redistribution may become visible. In these experiments, the cells injected with only FRET-labeled αS served as a control. After fixation, cells were counterstained with 4′,6-diamidino-2-phenylindole (DAPI) and imaged using a confocal fluorescence microscope.
Compared to the control where approximately 10% rounded up/dead cells are observed, we find approximately double the amount of dead cells after microinjection of N-protein. Typical images of the surviving injected cells are presented in Figure 4a. In the control, we see the previously reported distribution of αS between a high FRET vesicle-bound and a low FRET cytosolic αS population. (46) Vesicle-bound αS is clearly present in orange (high FRET) fluorescent puncta, while cytosolic αS is visible as a spread-out green (low FRET) background. The overall appearance of the FRET signal from cells that were co-injected with N-protein is very similar, both high FRET fluorescent puncta and a low FRET spread-out cytosolic signal can be found. However, in the cells that were microinjected with N-protein, we observe a less high FRET (orange) signal compared to the control group (Figure 4a). This indicates that in the presence of N-protein, the αS proteostasis is disturbed resulting in less vesicle-bound αS.
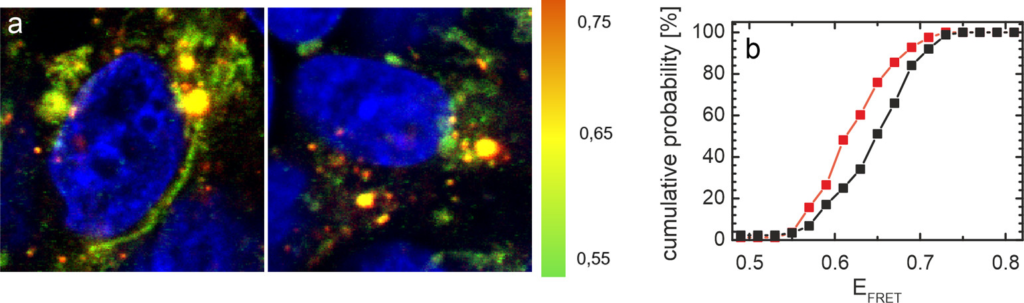
Distribution of αS in SH-SY5Y cells is affected by N-protein.
(a) FRET images of cells microinjected with the αS FRET probe. The color coding represents EFRET (green: low EFRET; yellow: mid EFRET; and orange: high EFRET). The cell nucleus is counterstained with DAPI and visible in blue. A representative image of cells co-injected with N-protein and the αS FRET probe is shown on the left, and the control cells on the right were only injected with the αS FRET-probe. (b) Distribution of average FRET efficiencies of αS per image for all cells injected with N-protein (red) and control cells (black). The cumulative histograms contain data from at least 80 images for both the control and the N-protein-injected samples. The average FRET efficiency of αS in cells injected with N-protein is shifted to lower EFRET values.
To substantiate the visual impression that in the presence of N-protein an overall average lower FRET value is observed, we estimated the αS FRET efficiency [EFRET = intensity acceptor/(intensity donor + intensity acceptor)] averaged over all pixels for each image made (Materials and Methods). Subsequently, we plotted cumulative histograms for the averaged αS FRET efficiency per image for the N-protein-injected cells together with the controls (see Figure S2). The histograms obtained for 3 and 5 days after microinjection agree well. For both sets of experiments, the distribution of the αS FRET efficiencies for the N-protein-injected cells is shifted to lower values compared to the control. For the control samples, the mean αS FRET efficiencies quantitatively agree (see Figure S2). The width of the distribution is slightly enhanced for the control data obtained 5 days after microinjection. The good agreement between the data sets justifies accumulation of the data. In Figure 4b, we show the cumulative distribution of FRET efficiencies of αS in all control cells and all cells injected with N-protein. Compared to the control, the FRET efficiency distribution of αS in cells injected with N-protein is systematically shifted to lower values. Our data show that the presence of N-protein results in redistribution of αS between (dis)functional conformational states. In vitro experiments show that the observed change in FRET efficiency does not result from a direct interaction between the N-terminus of αS and N-protein. Even in the presence of excess N-protein where we expect all αS to be bound, we do not observe a change in FRET efficiency of the FRET-labeled αS compared to the control (see Figure S3). The N-protein does apparently not interact with αS in the FRET-labeled N-terminal region or this binding does not induce measurable conformational changes in αS.
In summary, the in vitro experiments on recombinantly expressed proteins show that SARS-CoV-2 S-protein does not affect the aggregation of αS into amyloid fibrils. The SARS-CoV-2 N-protein, however, very effectively decreases the time to the onset of αS aggregation. Additionally, the aggregation process in the presence of N-protein differs from the aggregation process of αS alone. In the presence of N-protein, aggregation of αS proceeds in two steps, represented by two plateaus in the ThT fluorescence. The analysis of AFM images of fibrils shows that two populations of fibrils with a helical periodicity of approximately 90 and 130 nm are present during the first plateau phase. Only a single population of fibrils with a helical periodicity of 130 nm is found in the second plateau. The fibrils with the smaller helical periodicity are no longer observed. Although aggregation of αS in the presence of N-protein proceeds in two steps, first fibril nucleation is fast. The first plateau in the ThT fluorescence is found at a relatively low ThT intensity which indicates that the produced fibril mass is not very high. The fibrils formed in the first phase trigger the formation of or conversion to a second, thermodynamically more stable, fibril polymorph. The higher stability of this polymorph results in an increase in fibril mass and a plateau of higher ThT intensity. Note that the time scales on which the second polymorph appears are still fast compared to amyloid fibril formation in the absence of N-protein.
The MST and FCS data show that there is a direct interaction between N-protein and αS. The binding of the αS to the net positively charged N-protein appears to be mediated by attractive electrostatic interactions. This indicates that the interaction involves the negatively charged C-terminus of αS. The absence of a change in the FRET efficiency of the αS FRET probe confirms that the interaction with the N-protein is likely mediated via the C-terminal region or the aggregation-prone central NAC region of αS. In solution, electrostatic repulsion between net negatively charged αS proteins prevents their aggregation. Charge compensation due to binding to N-protein not only exposes the aggregation-prone NAC region of αS but also eliminates electrostatic repulsion of other αS proteins. Our data also show that the complexes contain multiple αS proteins. The close proximity of multiple αS proteins in the complex in an aggregation-prone conformation potentially facilitates the formation of a nucleus that triggers further aggregation and thus decreases the time to the onset of aggregation. (47)
Even in the complex environment of the cell, we see clear signs that the presence of the N-protein markedly affects αS proteostasis. In the cell, αS exists in at least two different conformational sub-ensembles. The presence of the N-protein results in a change in the FRET efficiency distribution and hence in either a change in the population of microinjected FRET-labeled αS sub-ensembles or in the appearance of a new conformation. In the microinjection experiments on cells, the concentration of N-protein is low compared to the concentration of αS. It is therefore rather remarkable that we can detect a clear shift in the distribution of the αS FRET efficiencies.
The presence of N-protein indirectly affects the FRET efficiency of the αS FRET probe by disturbing αS proteostasis. The affinity of αS for N-protein is of the same order of magnitude or higher as the affinity reported for other αS interactions. (48−50) Therefore, the N-protein will compete with other αS-binding partners for interactions inside the cell. For reliable cellular performance, protein interaction networks must be robust. Small changes and additional binding partners are therefore not expected to easily disturb interaction networks. We, however, do see a clear redistribution of αS over (dis)functional states even at the rather short time scales studied. The observed increase in the fraction of images containing dead cells further supports the idea of an imbalance in the cells proteostasis after injection with N-protein. We cannot confirm that this imbalance is the result of αS aggregation and the presence of amyloid fibrils in the cells injected with N-protein, although we observe elongated and fibril mesh-like structures. Considering that PD typically develops on very long time scales, the absence of fibrils in the microinjected cells would not be surprising.
Conclusions
We have identified a SARS-CoV-2 protein that induces the aggregation of αS in the test tube. In the initial interaction between the SARS-CoV-2 N-protein and αS, multiprotein complexes are formed. In the presence of N-protein, the onset of αS aggregation into amyloid fibrils is strongly accelerated, indicating that N-protein facilitates the formation of a critical nucleus for aggregation. Fibril formation is not only faster but it also proceeds in an unusual two-step process. In cells, the presence of N-protein changes the distribution of αS over different conformations that likely represent different functions at already short time scales. Disturbance of αS proteostasis might be a first step toward nucleation of fibrils. Our results point toward a direct interaction between the N-protein of SARS-CoV-2 and αS as a molecular basis for the observed relations between virus infections and Parkinsonism. The observed molecular interactions thus suggest that SARS-CoV-2 infections may have long-term implications and that caution is required in considering N-protein as an alternative target in vaccination strategies.