
Huntington disease oligodendrocyte maturation deficits revealed by single-nucleus RNAseq are rescued by thiamine-biotin supplementation
By Ryan G. Lim, Osama Al-Dalahmah, Jie Wu, Maxwell P. Gold, Jack C. Reidling, Guomei Tang, Miriam Adam, David K. Dansu, Hye-Jin Park, Patrizia Casaccia, Ricardo Miramontes, Andrea M. Reyes-Ortiz, Alice Lau, Richard A. Hickman, Fatima Khan, Fahad Paryani, Alice Tang, Kenneth Ofori, Emily Miyoshi, Neethu Michael, Nicolette McClure, Xena E. Flowers, Jean Paul Vonsattel, Shawn Davidson, Vilas Menon, Vivek Swarup, Ernest Fraenkel, James E. Goldman, and Leslie M. Thompson
Excerpt from the article published in Nature Communications 13, 7791, 21 December 2022, DOI: https://doi.org/10.1038/s41467-022-35388-x
Editor’s Highlights
- Huntington’s disease (HD) is caused by an autosomal dominant CAG repeat expansion in the first coding exon of the Huntingtin gene and a corresponding expanded polyglutamine repeat in the Huntingtin (HTT) protein.
- Oligodendrocytes (OL) for which there has been a growing awareness that these and other OL-lineage cells, including oligodendrocyte progenitor cells (OPCs), are abnormal in HD.
- The OL lineage pathology may reflect both a maturational deficiency and an inability to turn over myelin components.
- Appropriate glucose metabolism is critical for the proper development and function of OLs, as OPCs transition to myelinating OLs.
- Common metabolic changes across cell types in HD contribute to driving cell type-specific transcriptional changes.
- Specifically, thiamine metabolism deficits may be contributing to OL maturation deficits.
Abstract
The complexity of affected brain regions and cell types is a challenge for Huntington’s disease (HD) treatment. Here we use single nucleus RNA sequencing to investigate molecular pathology in the cortex and striatum from R6/2 mice and human HD post-mortem tissue. We identify cell type-specific and -agnostic signatures suggesting oligodendrocytes (OLs) and oligodendrocyte precursors (OPCs) are arrested in intermediate maturation states. OL-lineage regulators OLIG1 and OLIG2 are negatively correlated with CAG length in human OPCs, and ATACseq analysis of HD mouse NeuN-negative cells shows decreased accessibility regulated by OL maturation genes. The data implicates glucose and lipid metabolism in abnormal cell maturation and identify PRKCE and Thiamine Pyrophosphokinase 1 (TPK1) as central genes. Thiamine/biotin treatment of R6/1 HD mice to compensate for TPK1dysregulation restores OL maturation and rescues neuronal pathology. Our insights into HD OL pathology spans multiple brain regions and link OL maturation deficits to abnormal thiamine metabolism.
Introduction
Huntington disease (HD) is a progressive neurodegenerative disease characterized by prominent loss of medium spiny neurons (MSN) in the striatum and cortical atrophy1. The disease, which manifests with cognitive, psychiatric and movement impairments, is caused by an autosomal dominant CAG repeat expansion in the first coding exon of the Huntingtin gene and a corresponding expanded polyglutamine repeat in the Huntingtin (HTT) protein2. Genome-wide approaches, including bulk RNA- and ChIP-sequencing, have facilitated understanding the molecular impact of mutant HTT (mHTT) expression in a variety of model systems3,4,5,6 and have suggested deficits in neurodevelopmental programs in HD3,7,8,9. However, bulk tissue analysis limits the understanding of cell type-specific changes. The ability to distinguish common signatures of HD across multiple cell types from those that are unique to specific cell types can facilitate our mechanistic understanding of the disease. Past studies uncover these differences by expressing mHTT using cell type-specific drivers in animal models of HD10 or using human HD induced pluripotent stem cells (iPSCs) differentiated to specific cell types; these studies support the idea that cell type-specific effects of HD synergistically lead to pathogenesis11,12. Recent studies using single cell transcriptomics approaches also show cell type-specific neurodevelopmental impairments in HD13,14.
One such cell type are oligodendrocytes (OL) for which there has been a growing awareness that these and other OL-lineage cells, including oligodendrocyte progenitor cells (OPCs), are abnormal in HD. Prior studies focusing on HD models have shown early myelination deficits based on structural and transcriptomic data in mouse models of HD15,16, and that OL targeted mHTT expression causes HD symptoms as well as myelination deficits and altered OL maturation in mice via a mechanism involving myelin regulatory factor (Myrf)17. Myelination deficits were also evident in BACHD and R6/2 mice18,19 and OL maturation impairments, glial dysfunction20,21 and impaired OPC differentiation have been described in HD. For example, HD embryonic stem cell-derived glial progenitors transplanted into shiverer mice exhibit decreased differentiation and hypomyelination22, while another study showed that remyelination was impaired in cuprizone-treated mice, implicating abnormal OPC function in HD23, and inactivation of mHTT in OPCs prevented myelin abnormalities in HD mice11. Corroborating these findings in HD models, several studies have shown myelination and OL impairment in HD patient tissue. Bulk transcriptional studies of HD postmortem tissues revealed that MYT1L, a myelin transcription factor, and MBP were decreased in the caudate and prefrontal cortex, respectively24,25, and radiographic and neuropathological studies also reveal that OLs and myelination are abnormal (summarized in ref. 26). Neuropathologic examination of postmortem HD brains revealed a higher density than normal of OLs in the caudate nucleus27,28, including in pre-symptomatic HD patients. Stereological examinations of white matter revealed a decrease of 20–30% of the cross-sectional area of white matter in coronal levels from frontal to occipital regions29, as well as in the fornix30, in both lower and higher HD grades, suggesting that white matter loss represents an early change.
To further support these prior findings of OL maturation deficits, provide additional insight into cell type-specific versus agnostic signatures, and fill in the gaps in knowledge of key drivers that regulate OL impairments, we used single nucleus-RNAseq (snRNAseq) to obtain cell type-specific gene expression data across multiple brain regions from both the rapidly progressing R6/2 mouse model31 and human post-mortem brain samples of increasing grades of disease severity—including both adult- and juvenile-onset HD—and used these data for correlative and causal network modeling. We detail the differences in cell type-specific and agnostic gene expression changes, as well as putative causal drivers of cell type-specific transcriptomic changes. Consistent with previous literature, we find that OL-lineage cells show significant transcriptional dysregulation. We expand on these observations, finding that HD OPCs and OLs have altered the expression of development and maturation genes in both mice and human, with many HD OL-lineage cells showing intermediate states of development. Causal network modeling identified putative key drivers whose expression and extent of dysregulation was shown to correlate with the CAG repeat length in human tissue. We found that a gene central to the OPC/OL causal network, Protein kinase C epsilon (PRKCE), was downregulated in human and mouse, and we provide functional studies to clarify its role in promoting OL maturation. These findings are further supported by evidence from ATACseq and subsequent validation studies. We also identified impairments in glucose and lipid metabolism, identified as cell type-agnostic signatures, as potential drivers of this pathology. This connection to metabolism led us to find potentially unique roles for diacylglycerol (DAG), which regulates PRKCE, and for thiamine and biotin (T&B) metabolic processes in HD OL maturation impairments. Thiamine Pyrophosphokinase 1 (Tpk1), which converts thiamine into thiamine pyrophosphate, was differentially expressed in the most cell types in the 12w R6/2 mice, and both TPK1 and SLC19A2, a thiamine transporter, were downregulated in human HD. Interestingly, mutations in TPK1 or the thiamine-transporter SLC19A3 lead to thiamine pyrophosphate deficiencies and early-onset neurodegeneration with brain atrophy, basal ganglia impairment, and motor dysfunction which can be effectively treated with high dose T&B32,33. In addition, mutations in SLC19A2 lead to Roger’s syndrome, with megaloblastic anemia, thrombocytopenia, diabetes mellites, and sensorineural deafness34and general dietary thiamine deficiencies are known to contribute to a number of neurological and psychiatric symptoms35. To further examine potential connections between early metabolic changes in HD and OL maturation, we treated R6/1 mice, which has a longer therapeutic window than R6/2 mice and also show dys-maturation signatures in a number of cell types14, with T&B and conducted snRNAseq on the striata of T&B treated and vehicle-treated mice. T&B treatment resulted in significant rescue of dys-maturation signatures in OL and neurons, and an overall decrease in the number of significant differentially expressed genes (DEGs). Our data provide evidence that dysregulated metabolism and metabolic genes can directly contribute to the cell maturation deficits observed in OLs and other cell types, and that diet supplementation may be a therapeutic modality for HD.
Results
Single nuclei RNAseq of R6/2 mouse model of HD
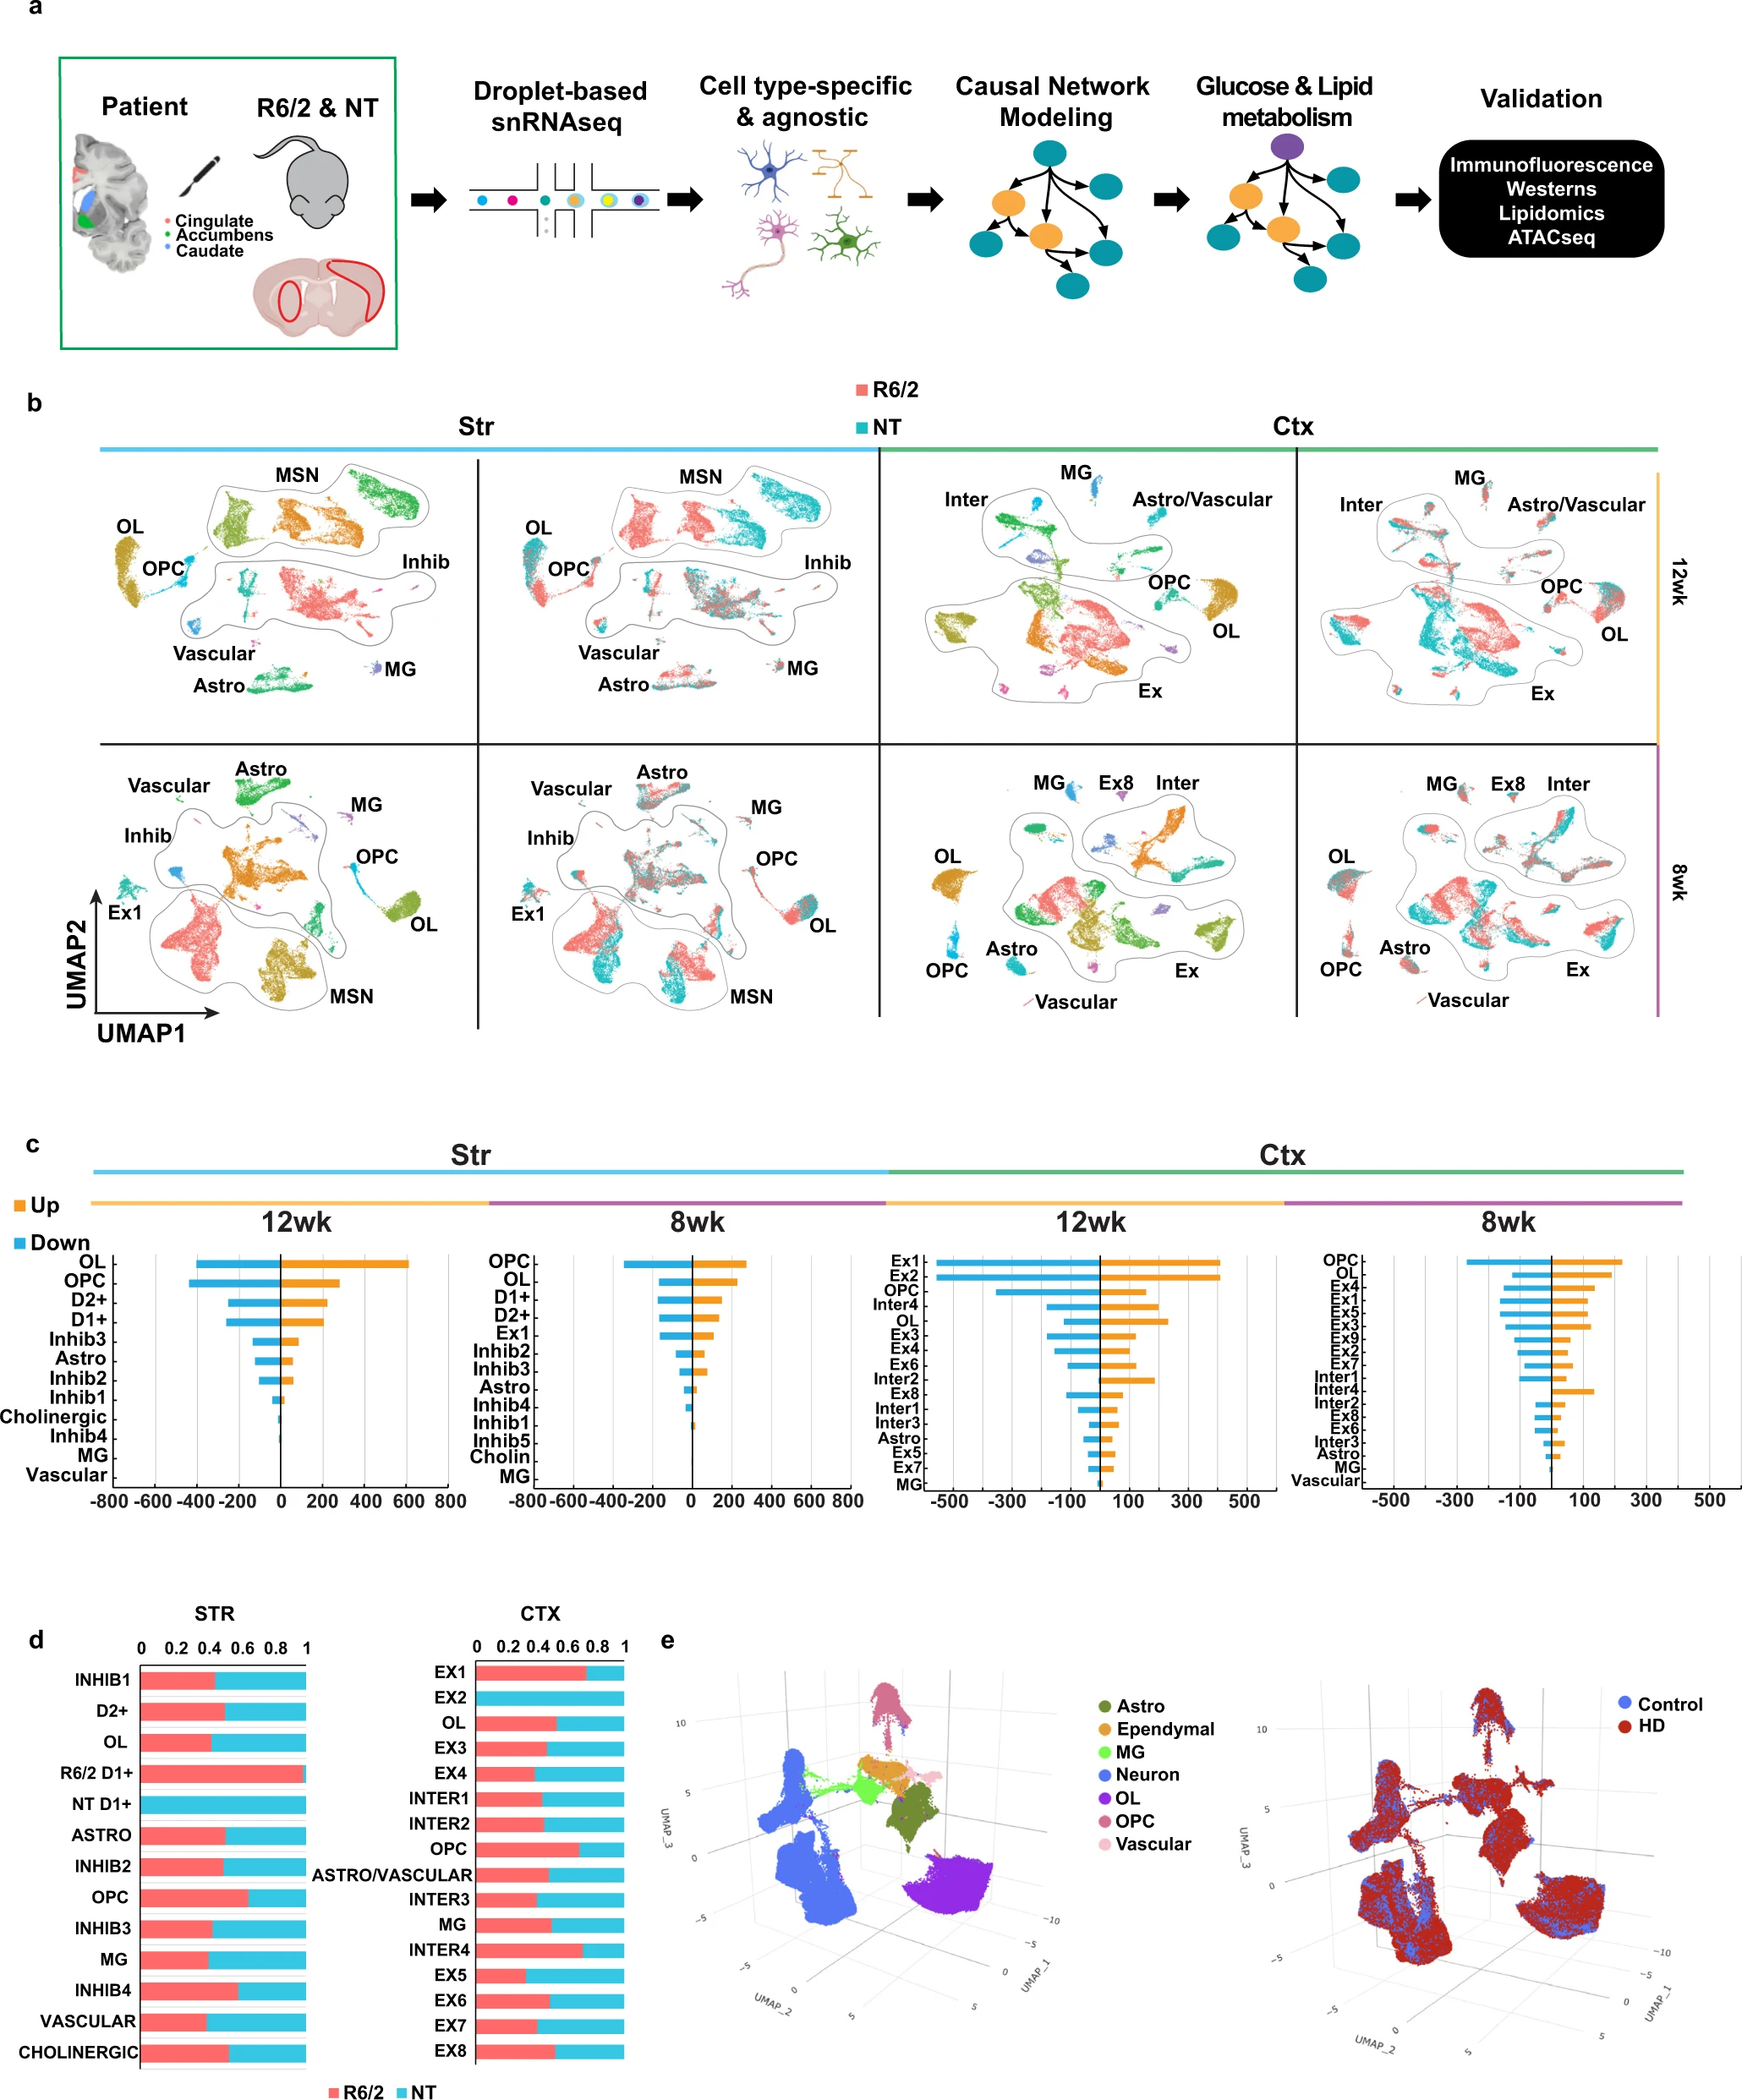
R6/2 mice are a rapidly progressing transgenic model that express mHTT exon 1 and have features in common with human symptomatic HD, including transcriptional changes31. To uncover progressive, cell type-specific, and region-specific transcriptional changes, snRNAseq was conducted on three striatal and cortical samples each from R6/2 and non-transgenic (NT) mice at 8w and 12w of age (Fig. 1a and Supplementary Fig. 1a see “Methods”). snRNAseq data were also generated and analyzed from human HD and control brains (Fig. 1a, e and Supplementary Fig. 1b, c described below). Unsupervised clustering identified 13 clusters in the 8w and 12w striatal samples, and 18 and 16 clusters in the 8w and 12w cortical samples, respectively (Fig. 1b and Supplementary Fig. 1a), which we annotated using known cell type gene markers (Supplementary Fig. 1d). R6/2 and NT cells clearly separate in some of the clusters, such as the 12w D1 + MSNs, which corresponded to a large number of DEGs between the two conditions (Fig. 1b–d and Supplementary Data 1). We also identified DEGs in the excitatory (Ex) and inhibitory (Inhib) neurons, astrocyte (Astro), OLs, and OPC clusters (Fig. 1c). Minimal to no changes were seen in the microglia (MG), vascular cells, and cholinergic neurons (Fig. 1c). These clusters had the smallest number of cells and therefore could lack the power required to identify statistical differences. Regional differences are reflected in the number of cell type-specific DEGs across both regions (Fig. 1c). When we combined all data from both ages and regions, we found no clustering differences for each cell type between age and region, except for cell types that were specific to either the striatum or cortex, e.g., MSNs in the striatum (Supplementary Fig. 1e). The only differences between the age groups were seen as a slight shift within cluster between the 8w and 12w OLs.
Single nucleus RNAseq of mouse and human R6/2 and HD samples.
a Illustration of workflow used for this study. After frozen tissue is microdissected from the Cingulate, Caudate, and nucleus Accumbens from 66 samples from 29 human donors (3 grade I, 4 grade II, 4 grade III, 3 grade IV, 5 juvenile-onset HD, and 10 matched controls), or the striatum and cortex of the mice (n = 3), nuclei are isolated, 10× Libraries are prepared followed by next generation sequencing. Created with BioRender.com b Uniform manifold projection and approximation plots (UMAP) of the R6/2 and NT mouse data colored by cluster or genotype. Initial QC and filtering led to the identification of 108,974 nuclei from mouse tissues. General cell type annotations: Astro Astrocytes, OL Oligodendrocyte, OPC Oligodendrocyte progenitors, MSN Medium spiny neurons, Inhib inhibitory neurons, MG Microglia, Ex Excitatory neurons, Inter Interneurons. c Barplot showing the number of up (orange) and down (blue) regulated DEGs per a cell type in the mouse data. b, c Striatal (Str, light blue bar) samples on the left and cortical (Ctx, light green bar) samples on the right, 12w samples marked by yellow bar and 8w marked by purple bar. d Proportion of R6/2 and NT cells within each cluster, red = R6/2 & blue = NT. e UMAP plots of the human snRNAseq results showing color-coded by cell type (Left), condition (Right).
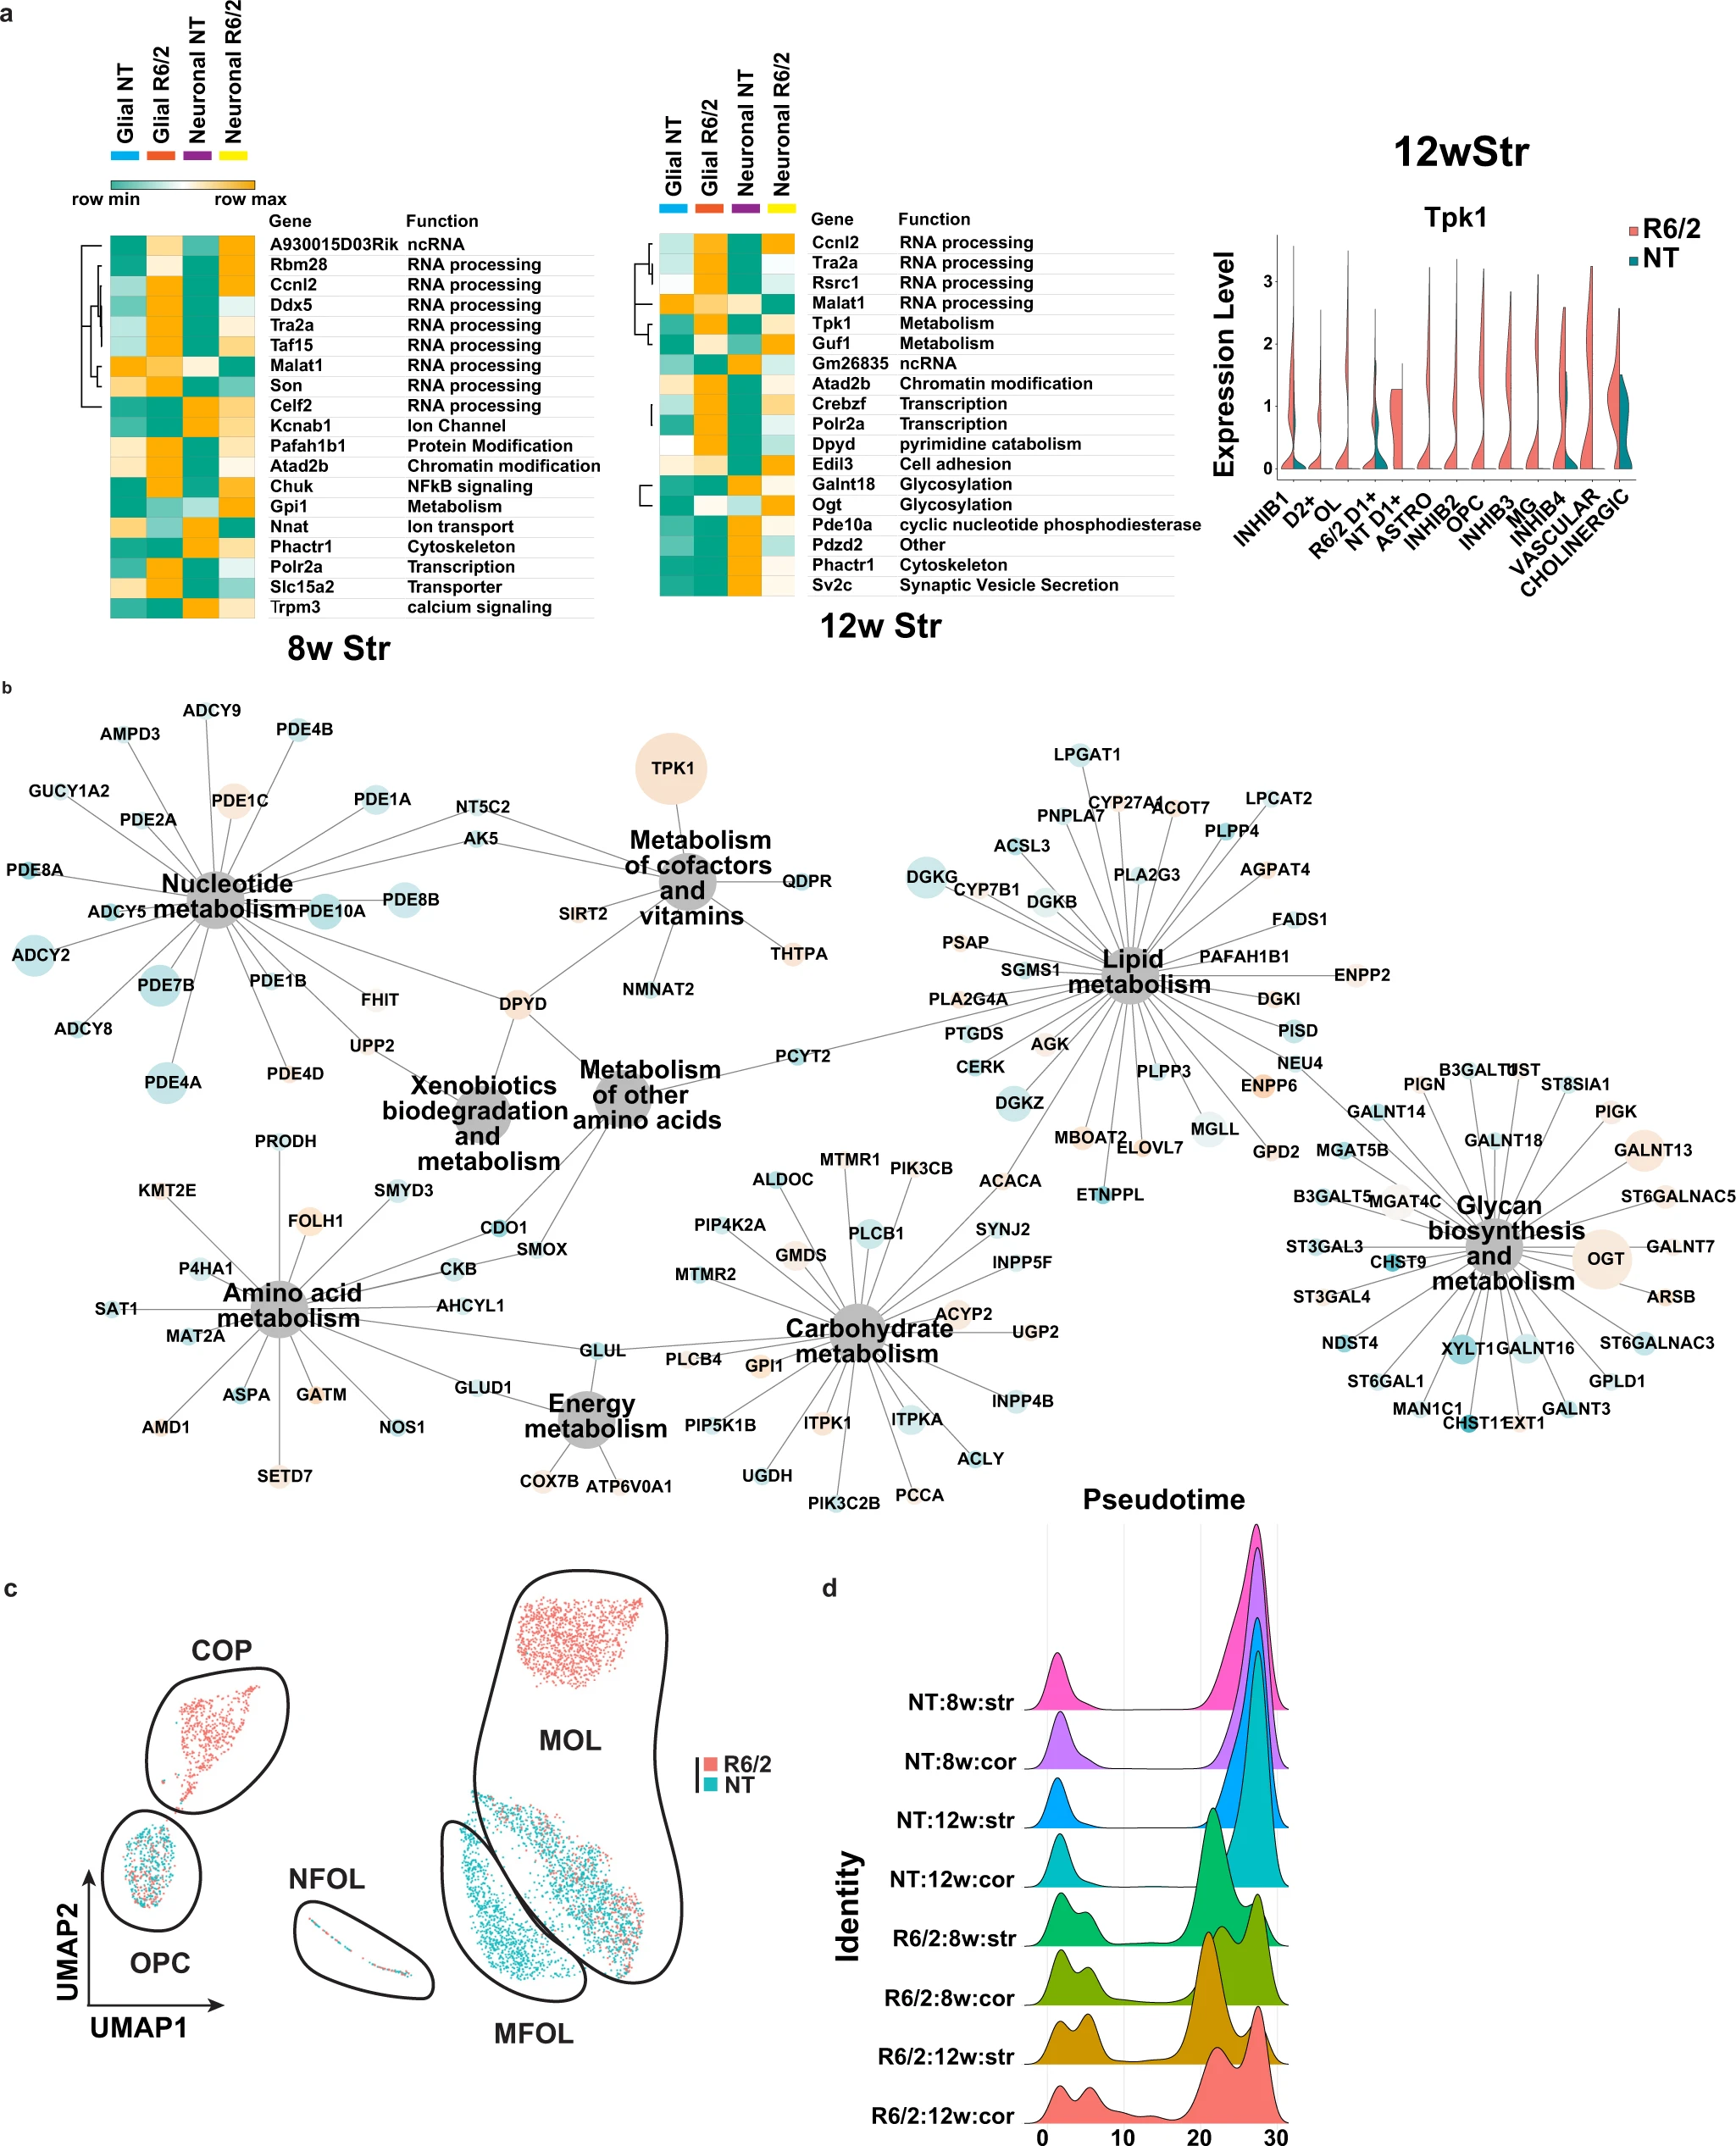
Gene ontology (GO36) enrichment and KEGG pathway analyses were used to investigate the biological implications of the cell type-specific DEGs. The top 10 significant terms revealed that the majority of DEGs, regardless of cell type, are involved in neuronal related functions, including neurogenesis, synaptic function, and glutamate-related signaling (Supplementary Fig. 2a), but certain cell types were enriched for unique terms such as RNA processing in inhibitory neurons. We also identified common terms related to “developmental process” in the cell types with the most DEGs, such as in OLs and OPCs. Similar to the GO analysis data there were recurring KEGG pathways across regions, ages, and cell types as well as sets of unique pathways that group together (Supplementary Fig. 2b). We also identified cell type-agnostic DEGs that were common to both glia and neurons. Figure 2a and Supplementary Fig. 3a show the top multi-cluster DEGs identified in at least 50% of the cell types/clusters per tissue region and age. Many DEGs across both glia and neurons are involved in RNA processing and splicing, and metabolism. KEGG pathway analysis also highlighted glucose metabolic pathways, many of which appeared in the earlier 8w samples (Supplementary Fig. 2b). The dysregulated metabolic genes were found to be in or downstream of the glucose super metabolism pathway that includes glycolysis, the hexosamine biosynthetic, polyol, and diacylglycerol pathways, including Tpk1 that happened to be dysregulated across the most cell types in the 12w striatum (Fig. 2a). Moreover, Tpk1 was also among the top dysregulated genes in the 12w cortex, and another glycolytic gene, glucose-6-phosphate isomerase 1 (Gpi1), was one of the top multi-cluster DEGs in both 8w striatum and cortex (Fig. 2a and Supplementary Fig. 3a). Both metabolic genes are upregulated in R6/2. We investigated whether there was an enrichment for KEGG metabolic genes in the DEGs and which metabolic pathways were most impacted Fig. 2b, 12w striatum and Supplementary Fig. 3b. Tpk1, Ogt, Dgkx genes, and Galnt13, found in sub-pathways related to glucose and lipid metabolism, are among the most commonly dysregulated genes in all cell types.
Analysis of differentially expressed genes in R6/2 mice and subclustered analysis of OPCs and OL.
a Left: Heatmaps and hierarchical clustering of normalized mean expression values in all glial or neuronal cells of the top cell type-agnostic DEGs. Cell color represents row min (seafoam green) and max (orange). Color bars denote NT glial cells (light blue), R6/2 glial cells (orange), NT neural cells (purple), and R6/2 neuronal cells (yellow). RNA processing and splicing (Ccnl2, Tra2a, ddx5, Celf2, and Taf15) and metabolism (Guf1, Tpk1, and Gpi1) related genes. Glucose super metabolism pathway genes that include glycolysis, the hexosamine biosynthetic pathway, polyol pathway, and diacylglycerol pathways, include Ogt, Tpk1, Gpi1, and Galant18. 8w and 12w Str data shown, cortical data in Supplementary Fig. 3a. Right: violin plot of exemplary gene Tpk1 that show global upregulation in R6/2 mice, across all cell types, from 12w Str. b Network showing all KEGG metabolic genes significantly dysregulated across the 12w Str DEGs from every cell type. 12w Str data shown, 8w Str and cortical data in Supplementary Fig. 3b. Node size is equal to the number of cell types in which the gene is found to be significantly dysregulated, and nodes are colored by up and downregulation (orange = up and blue = down). c UMAPs of subclustered OPCs and OL in the 12w striatum, colored by genotype. Cluster composition: NT cells are mainly MOLs and MFOLs, or OPCs; while R6/2 cells are COP, NFOL, and MOL. Statistical contrasts: R6/2 vs NT for each cluster, cluster comparisons between R6/2 and NT MOLs, NT MFOLs and R6/2 MOL, COP vs OPCs. 8wStr and cortical data show in Supplementary Fig. 3c. d Density plots of cell numbers across pseudotime cell stages, colored by genotype and age.
Taken together, these data indicate that developmental genes, RNA processing, and glucose and lipid metabolism may be core, cell type-agnostic signatures, while cell type-specific changes are more related to cell functions and identity. Further, OPCs and OLs show massive transcriptional dysregulation that includes both developmental genes and functional genes such as MBP.
R6/2 OPCs are committed to maturation while OLs appear transcriptionally less mature than NT OLs
Given the changes in developmental genes in OPC and OLs, and the unique embedding of R6/2 cells right between the OPC and OL clusters (Fig. 1), we investigated whether these cells might represent intermediate maturation cell states between OPCs and OLs. The OL-OPC data were subclustered, revealing six clusters in the 12w striatum and five clusters in the 8w striatum, 8w cortex, and 12w cortex. Each cluster represented distinct populations of OPCs or OLs comprised of R6/2 and/or NT (Fig. 2c (12wk striatum), and Supplementary Fig. 3c–e, integrated data cross regions, and ages are described in supplementary results and Supplementary Data 2). These subclustered data were then further annotated based on the gene expression markers and annotations defined by Marques and Zeisel et al.37 as OPCs, committed oligodendrocyte precursors (COP), newly formed oligodendrocytes (NFOL), myelin-forming oligodendrocytes (MFOL), or mature oligodendrocytes (MOL) (Fig. 2c and Supplementary Fig. 3c). The relative proportions of R6/2 and NT cells in each cell stage and DEG analyses revealed that R6/2 OPCs (OPC & COP) and OLs (NFOL, MFOL, and MOL), at both ages and in both anatomic regions have changes in expression that suggest developmental/maturation impairments. DEGs included: Mog, Mag, Mbp, Opalin, microtubule genes, and genes involved in OL maturation, function, and myelination (Supplementary Data 1 and Supplementary Fig. 3e). DEGs involved in glucose and lipid metabolism were also found in OPCs and OLs, including upregulation of Tpk1. Pseudotime analysis38 further suggested that most R6/2 cells were in transitional cell states between OPCs (pseudotime 0) and MOLs (pseudotime 30+), with many HD cells found in the COP cluster and a cluster of NFOL, while NT cells were mostly either OPCs, MFOL, or MOLs (Fig. 2c, d and Supplementary Fig. 3c–f, these results are further described in the Supplementary Results).
The downregulation of mature OL genes in the R6/2 cells and the distribution of R6/2 cells in intermediate stages of OL differentiation suggests states of abnormal maturation (Fig. 2d) and implies that OPC maturation and subsequent OL differentiation is impaired in R6/2 mice.
Causal network modeling (CNM) identifies disrupted gene expression networks in R6/2 mice and reveals potential cell type-specific mechanisms of transcriptional change
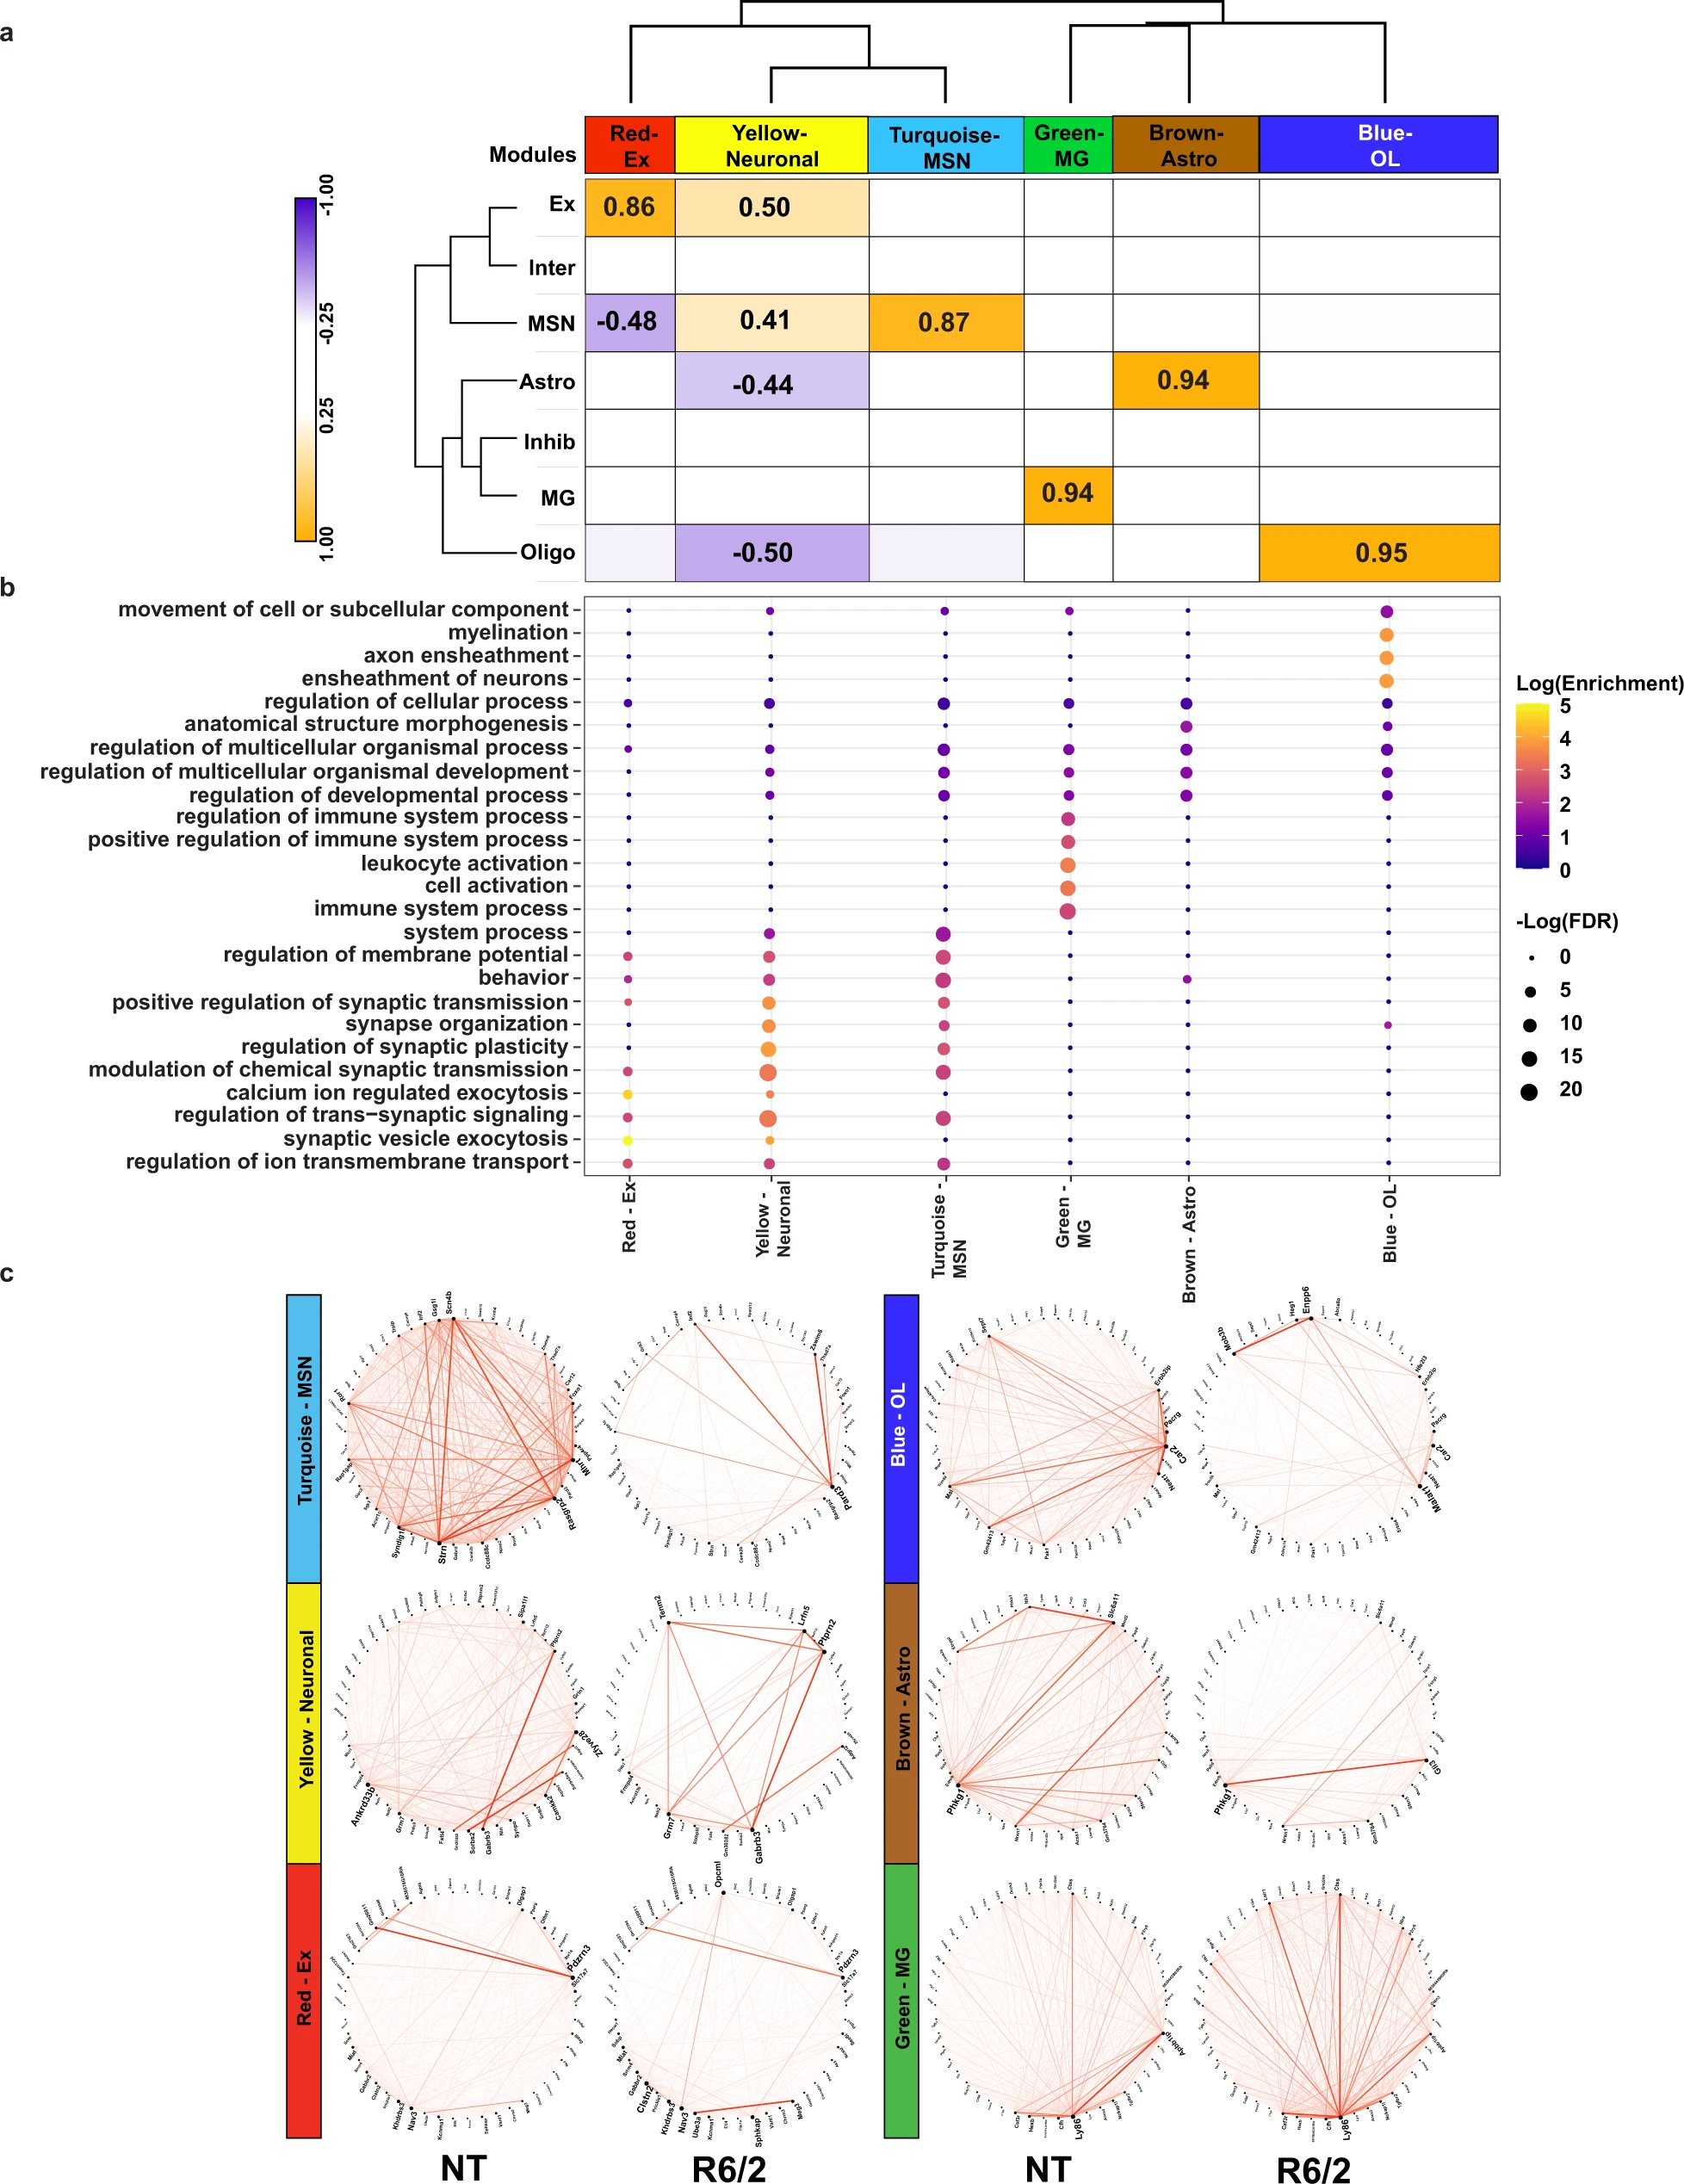
To investigate disruptions in cell type-specific gene networks in HD, and identify potential key driver genes, we utilized weighted gene co-expression network analysis (WGCNA39) and Bayesian causal network modeling (Fig. 1a) to identify causal relationships between genes identified as cell type-specific DEGs and genes correlated within WGCNA network modules40,41,42. After feature selection (“Methods”), we used WGCNA and ran a signed network analysis using cells from all NT samples; 6 gene co-expression modules were detected across cortical and striatal tissues at both ages (Fig. 3a, Supplementary Data 3, and Supplementary Fig. 4). Trait-module correlation analyses showed that our modules were correlated to specific cell types (Fig. 3a). The yellow module positively correlated with neuronal cell types and negatively correlated with glia, and the red, turquoise, green, brown, and blue modules positively correlated with Ex, MSNs, MG, Astros, and OLs, respectively. GO enrichment analysis of gene module members showed enrichment for terms related to each cell type (Fig. 3b). For example, the OL-correlated blue module was enriched for myelination-related terms. Except for the green module, each module was significantly enriched for DEGs determined using the hypergeometric test (Supplementary Fig. 5a and Supplementary Data 3), suggesting that these gene networks are relevant to the disease state and become impacted as the disease progresses. The connectivity of the top module members rank-ordered by eigengene-based connectivity (kME) revealed significant alterations (Fig. 3c).
WGCNA analysis of R6/2 mouse snRNAseq data shows cell type-specific changes in network structure.
a Dendrogram and correlation heatmap showing cell type-specific co-expression modules. Heatmap shows modules highly correlated with each cell type, dendrogram shows clustering of neuronal module together and glial together. Cell color represents column min (blue) and max (orange). Any statistically significant trait-module correlations are shown with correlation value. P-values (Supplementary Data 3) are Student asymptotic p-values. b Top five GO terms per module, showing cell type-specific functional relevance. c Circos plots of the top 50 genes with highest kME in NT mice (left) and R6/2 (right). Red lines show connectivity between the top 50 genes. Structural differences can be seen between NT and R6/2.
To understand the potential cell type-specific causal connections between these genes we applied a Bayesian causal network modeling approach (see “Methods”), using the cell x gene data matrix which was filtered and run for each individual cell type and used for network structure learning. Gene features were selected as input by using only that cell type’s DEGs and gene members from the correlated WGCNA module (Fig. 4a, b, Supplementary Fig. 5b–d, and Supplementary Data 4). We explored the MSN and OPC/OL bayes nets (bnets) in detail for two reasons: (1) since MSN are the most studied cell type in HD the bnet should recapitulate previous findings and also reveal both known and undefined interactions between known dysregulated genes, providing validation for our approach, and (2) both cell types were the most impacted in our mouse model (total number of DEG) with the OPCs and OLs showing the largest number of DEGs that suggested developmental deficits. The merged NT and R6/2 bnets per each cell type are shown in Fig. 4a, b. We enlarged genes that represent key drivers (hub genes with high outward centrality, or genes connecting 2 hubs) which are potentially causal regulators of downstream nodes.
Causal network analysis and ATACseq of glia reveals Prkce, Olig1/2, Sox9/10, and glucose and lipid metabolism as important regulators.
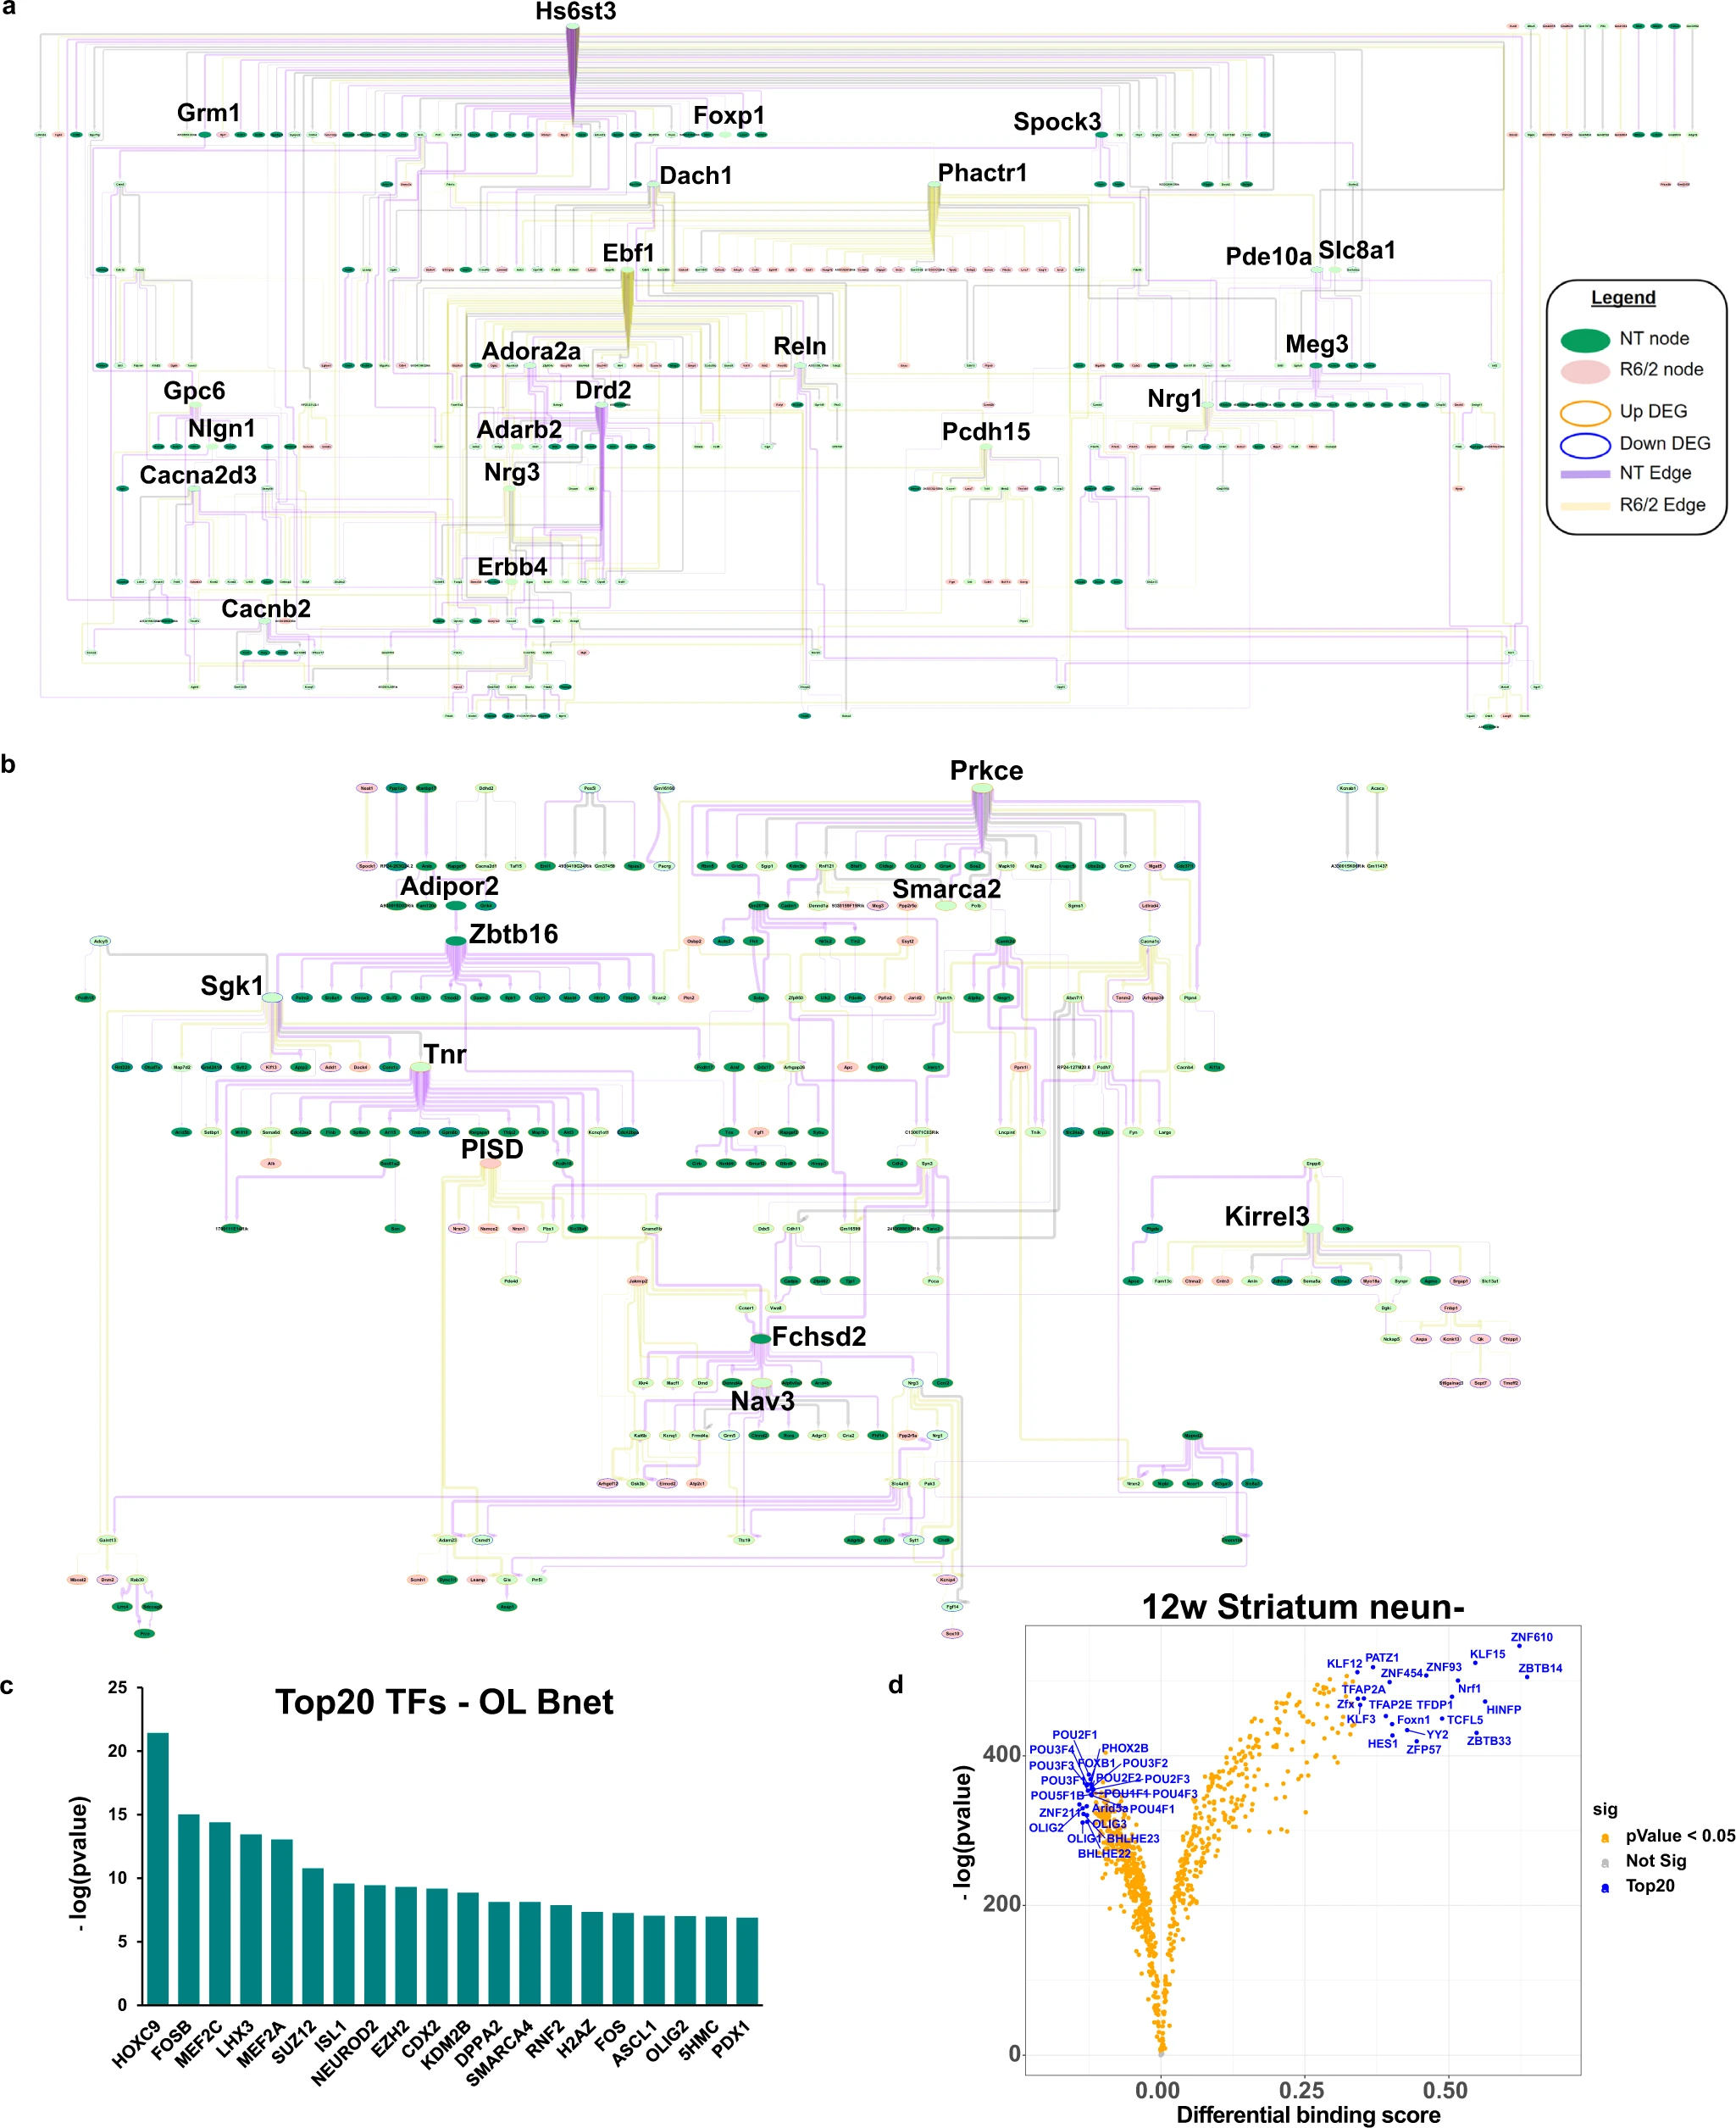
a MSN bnet. b OL bnet. a, b Both causal networks are merged from NT and R6/2. If a node and edge existed in both the NT and R6/2 bnets, the NT data (edge weight) were used for plotting. Each bnets shows nodes that exist only in NT or R6/2 and nodes that exist in both, as well as new edges and edges retained in the R6/2 data. Each bnet was also plotted using a hierarchical structure to show the direction of causal flow. In each plot, genes with a high degree of outward centrality (>10 outward edges) are highlighted by increased gene name size, as well as genes that connect between two genes that have a high degree of outward centrality. We consider these highlighted genes key drivers of the network. Color scheme is as follows: Edge (purple = NT, yellow = R6/2, gray = both), node fill color (green = NT node, pink = R6/2 node, light green = both), node outline color (orange = upregulated, blue = downregulated). MG, Astro, and Ex neuron bnets are in Supplementary Fig. 5b–d. c LISA analysis of OL causal network gene members, showing the top 20 regulatory transcription factors. d Volcano plot showing differential binding scores, and −log(p value) differences of TF binding in open chromatin in 12w NeuN- striatal cells. blue = top20 by differential binding score, orange = p value < 0.05. 8wStr, cortical, and all NeuN+ data can be found in Supplementary Fig. 6b.
The MSN bnet includes genes involved in MSN development/identity, function, and genes implicated in HD, including Ebf1, a key driver identified in the R6/2 bnet (yellow edges) and involved in striato-nigral MSN development43,44. Genes of the indirect pathway in D2 + MSNs, including Adora2a, Drd2, and Penk, were all downregulated and only show NT causal interactions (purple edges), indicating a loss of function of these genes45. Furthermore, Drd2is a parent node of Penk, which is not only a downstream target of Drd2 signaling and dysregulated in HD14, but is transcriptionally regulated by Drd2 expression through dopamine-induced activation46, thus validating the approach.
We next explored the OPC/OL bnet (Fig. 4b) and found Prkce, Sgk1, Zbtb16 and Tnr as key drivers. Prkce is functionally regulated by DAG and transcriptionally by Zbtb1647, a zinc finger binding protein that is involved on OL maturation and myelination, is found downstream of Adipor2, an adiponectin receptor that regulates glucose and lipid metabolism. Downstream of Zbtb16 is serum- and glucocorticoid-inducible kinase 1 (Sgk1), which is normally upregulated in OLs during cellular stress and regulates many ion channels and solute carrier proteins involved in metabolic pathways and glucose uptake (e.g., ref. 48), such as GLUT1, GLUT4, and glutamate transporters. Sgk1 is downregulated in R6/2 mice indicating a potential loss of function in HD—see supplementary results for additional validation studies. Exploration of downstream nodes reveals a connection between Smarca2, which is a protein in the SWI/SNF family involved in gene expression and chromatin remodeling in OLs, and Prkce. Smarca2 (BRM) and Smarca4 (BRG1) play roles in OPC and OL development, including promoting OPC differentiation49,50. The majority of the outward edges from key drivers are NT specific, indicating a loss of causal connection to downstream nodes in the R6/2 mice. Transcription regulator analysis of the network gene members using LISA51 revealed the network is enriched for targets of Smarca4, and Olig2, as well as other regulators previously highlighted for HD, including Suz12, Fos, and Mefc2 (Fig. 4c and Supplementary Data 4).
Finally, to complement these findings using a completely different knowledge-driven approach, and provide additional interpretability, we also included cell type-specific gene regulon network analysis using IRIS352. This analysis identifies predicted transcriptional regulators from prior knowledge which we then used to overlay onto our data driven causal network (Supplementary Fig. 5e, Supplementary Data 4). We found a significant enrichment of genes and regulons already within our causal network (p < 2.373e−201, exact hypergeometric probability), and many connections between several of these regulons, including OLIG2, and our key drivers. ELF5 and E2F3, which were two regulons predicted from the IRIS3 analysis, both regulate Prkce and have previously been implicated in OPC maturation and HD transcriptional dysregulation5,53. These findings further validate the causal networks and together these data suggest an interconnected process between OPC/OL development and lipid and glucose metabolism and known HD-related genes.
MG, Astro, and Ex neuron bnets are described in the supplementary results.
ATACseq of glial-enriched nuclei identifies regulators underlying transcriptional pathology in HD glia
To understand the drivers of gene expression changes in non-neuronal cells (e.g., glia) versus neurons, and validate the transcriptional regulator analyses (LISA & IRIS3), we performed ATACseq on NeuN+ and NeuN- sorted nuclei from both the striatum and cortex of the same R6/2 mouse cohort (Supplementary Fig. 6a and Supplementary Data 5). The neuronal protein NeuN is localized in the nuclei and perinuclear cytoplasm of most neurons. We performed footprinting analysis using the ATACseq data and TOBIAS54 which revealed developmental changes in the glia-enriched NeuN- data (Fig. 4d (12w striatum) and Supplementary Fig. 6b, and Supplementary Data 5), and enrichment for immediate early genes in the neuron-enriched NeuN+ data. Among the top 20 TFs in the NeuN- data that showed differential binding between R6/2 and NT, we found Sox9 and 10 were significantly decreased in the 8wk striatal data, and Olig1 and Olig2 decreased in the 12wk striatal data. Interestingly, when all the samples were grouped and we compared the top 20 up and down TFs per an age and region, there were some overlapping TFs between the 12w cortical and both striatal samples, but these were in opposite directions (e.g., Hes1 and Zbtb14, Supplementary Fig. 6b, c). The 8w cortical samples had the least similarities compared to all other regions and ages (Supplementary Fig. 6b, c) and showed a number of HOX genes within the top 20 TFs with reduced binding. The cortical data showed differential binding of other known HD genes such as Egr1 and Sp1.
Since we did not have ATACseq data from our human samples we next conducted global chromatin accessibility prediction using our human snRNAseq data and the BIRD tool55. BIRD analysis revealed differential peaks at genes important for OPC/OL maturation, such as SMARCA4, which were dysregulated in the snRNAseq data in both mouse and human samples (Supplementary Fig. 6a).
Independently, both analyses of ATACseq data suggest maturation impairments in HD OPC/OLs. Together with the snRNAseq data, a coordinated network of regulators and downstream effectors that implicate known OL developmental genes (e.g., SMARCA4 and Olig2), and other potential regulators (e.g., PRKCE) is observed.
Single nucleus RNAseq from HD and control cingulate, caudate, and nucleus accumbens identifies several heterogeneous OL lineage cells and altered maturation states
Given the altered gene expression in OL lineage cells in R6/2 mice, we investigated whether mHTT expression also impacted gene expression in OPCs and OLs in human HD post-mortem tissue. snRNAseq was carried out on 66 samples from 29 donors (3 grade I, 4 grade II, 4 grade III, 3 grade IV, 5 juvenile-onset HD, and 10 matched controls—the demographics of whom are outlined in Supplementary Data 6). To define the pathology in different brain regions, we microdissected the cingulate cortex, the caudate, and the nucleus accumbens from frozen brain tissue as outlined in Fig. 1a. All major lineages were identified in the 290525 nuclei analyzed (Supplementary Fig. 1e). Projection of nuclei in UMAP space shows that nuclei of the same lineages largely occupy neighboring space (Fig. 1e and Supplementary Fig. 1d, e (tSNE)), without distinct donor or batch related colocalization after correcting for batch effects (Supplementary Fig. 7a, b). We detected changes in gene expression in all cell types; for this study, we focused on cells of the OL lineage.
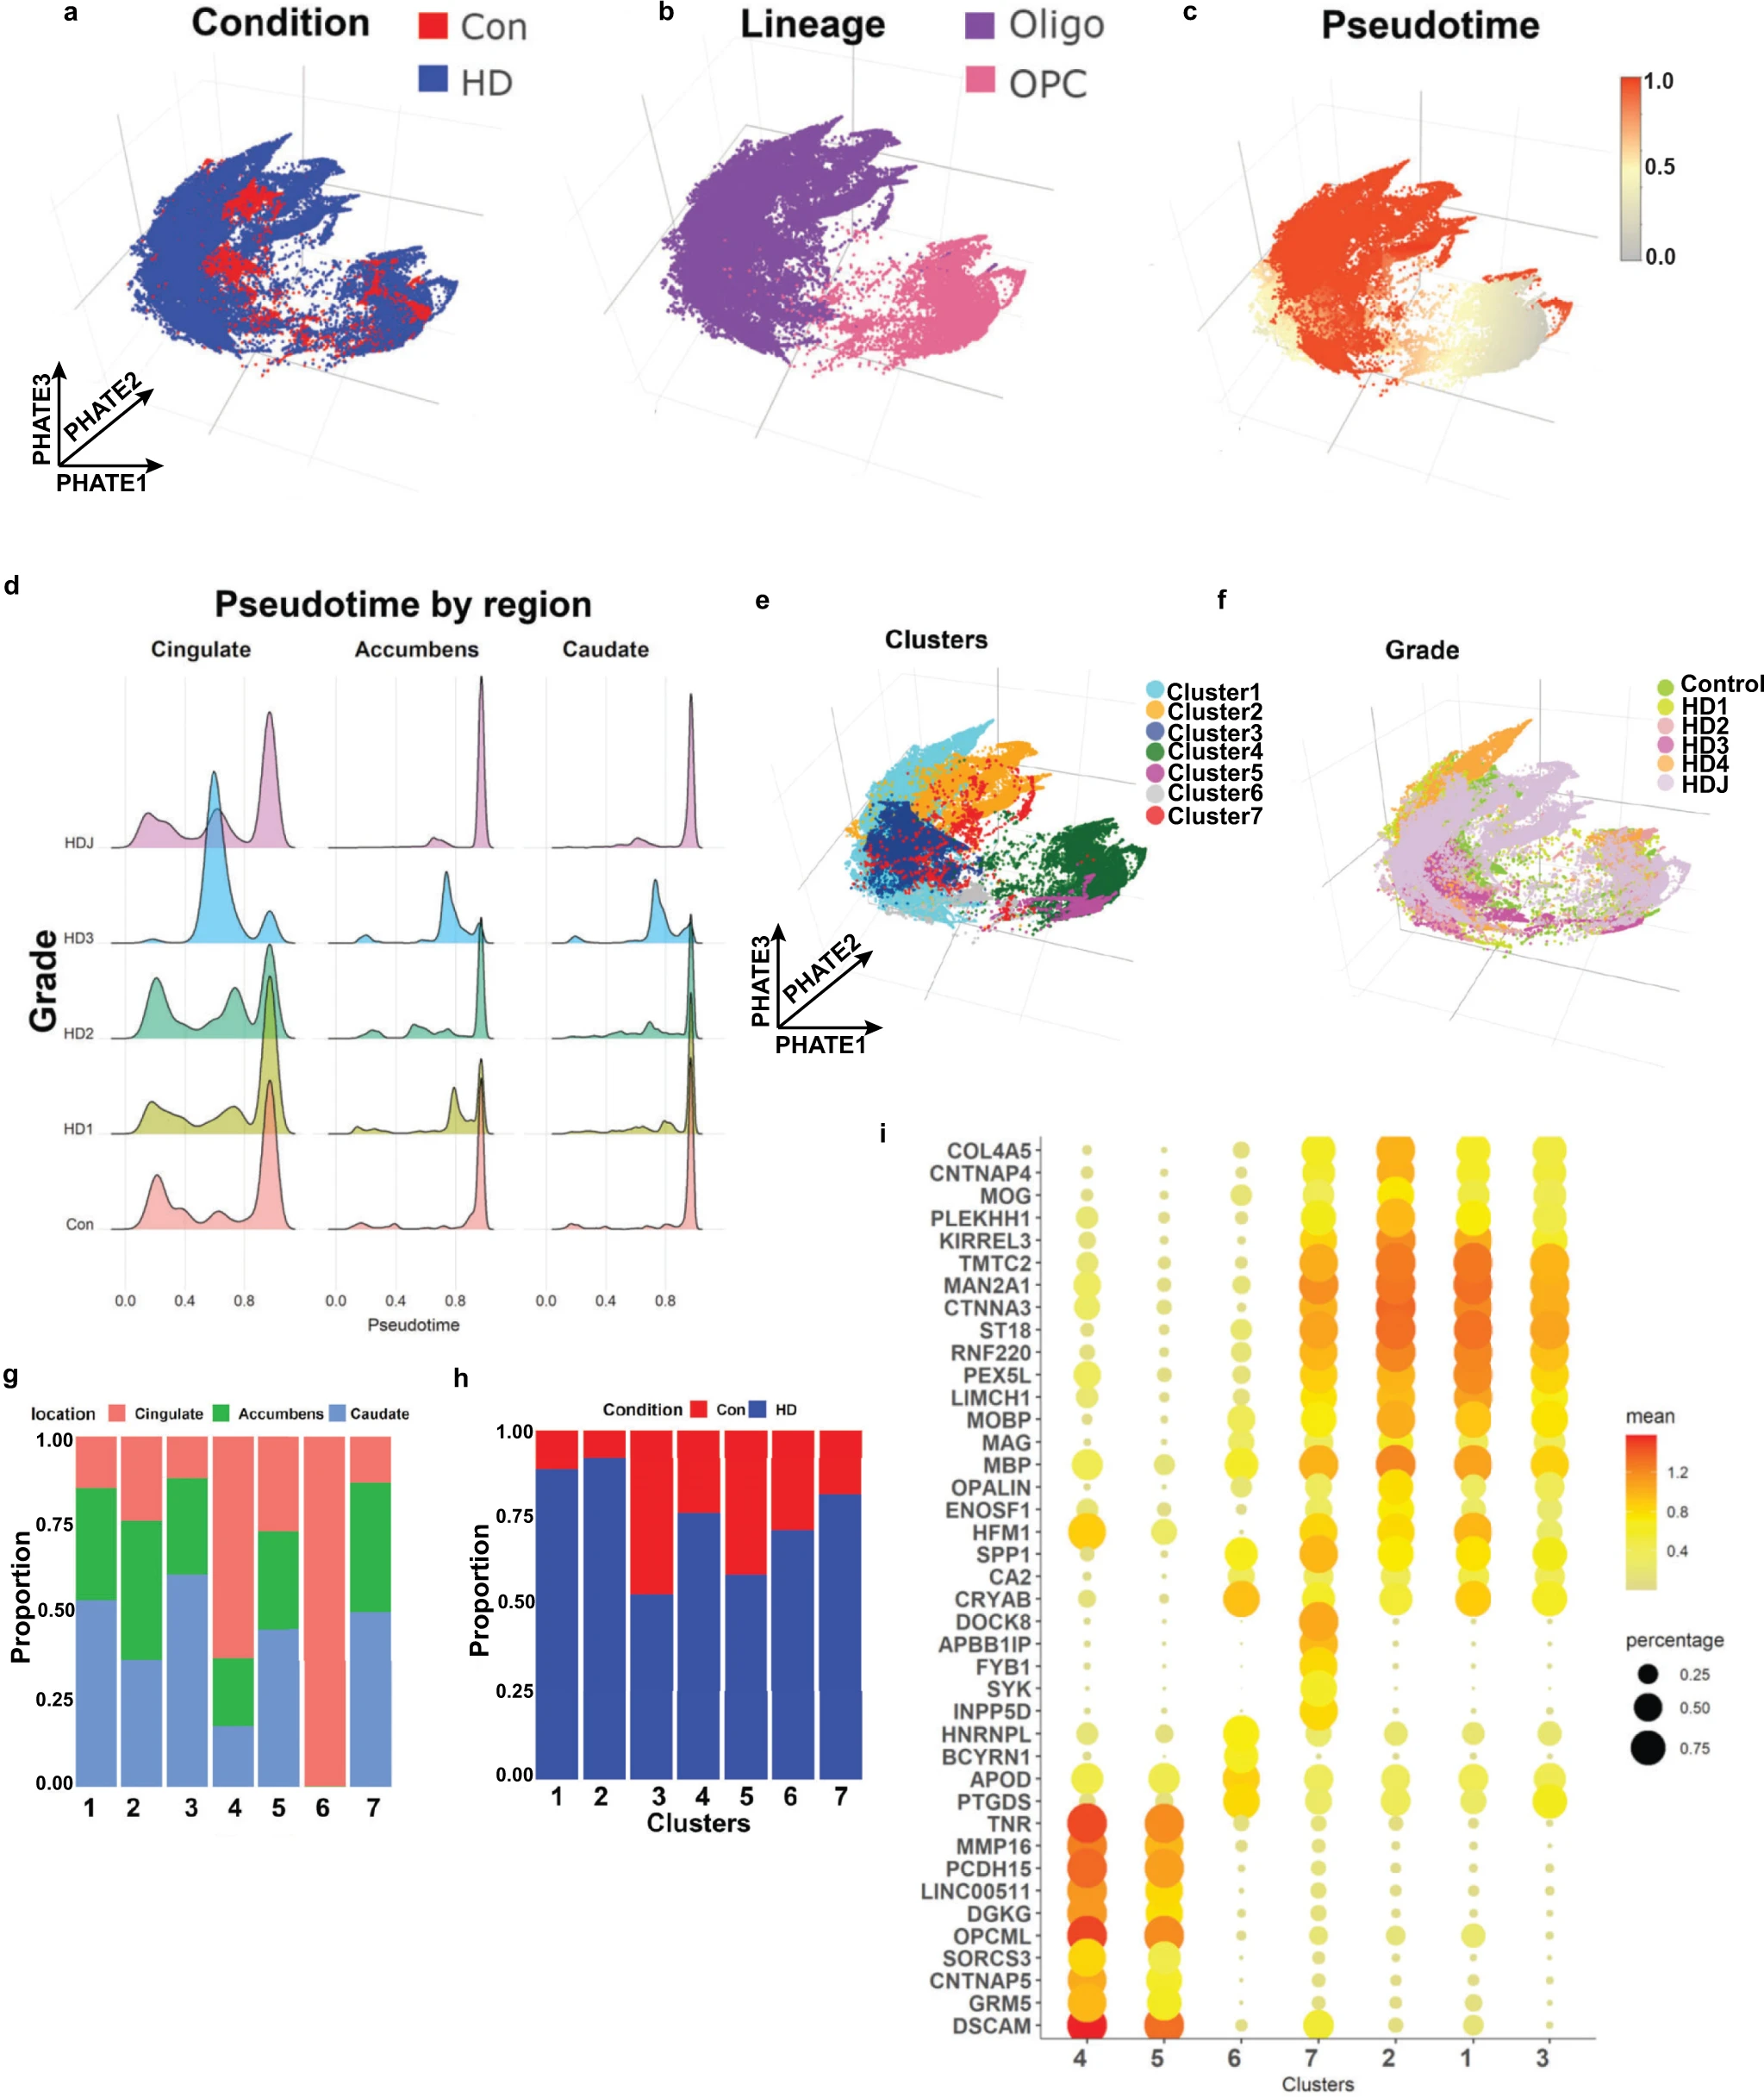
We focused on OLs and OPCs (Fig. 5a, b) and analyzed 80199 OL and 13844 OPC nuclei in isolation from other lineages. Projecting OL and OPC in their own reduced dimension space (PHATE reduction—see “Methods”) shows a continuous trajectory from OPCs to OLs, and separation between HD and control nuclei (Fig. 5a, b). To examine the differentiation states of these cells, using well-established methods56, we calculated the relative ordering of cells along a pseudotime dimension (Fig. 5c). Similar to our mouse data, examination of pseudotime values per anatomic region in control, grades I–III HD, and Juvenile onset HD nuclei show altered maturation states across brain regions and grade in HD. That is, across all brain regions examined, HD nuclei showed a relatively larger proportion of cells with intermediate pseudotime values compared with controls, which is more pronounced with increasing HD grade, particularly in HD grade 3. Conversely, in juvenile onset HD (HDJ), the effect was less appreciable in the cingulate cortex, and more pronounced in the striatum, with the majority of caudate and accumbens OPCs showing intermediate pseudotime values (Fig. 5d). The results suggest that HD maturation pathology is at least partially progressive with HD grade, and that HDJ maturation pathology affects mainly OPCs.
Huntington disease oligodendrocytes are less mature.
Projection of control and HD nuclei in the PHATE dimension color-coded by condition (a), lineage (b), pseudotime value (c), cluster (using the Levine algorithm) (e), and HD grade (f). Note that OPCs have the lowest pseudotime values in c, as OPCs were set as root nodes, while OLs had high values. dPseudotime values are shown in histograms across brain region and HD grade. Note that the proportion of nuclei with intermediate pseudotime values is higher in HD, especially grade III. The relative contribution of anatomic region (g) and condition (h) to each cluster is shown in bar plots. i Gene expression dot plots showing normalized expression of select cluster marker genes, with color denoting expression levels and circle size denoting the proportion of nuclei expressing the gene of interest.
We next performed unbiased sub-clustering of OL and OPC nuclei and identified 7 sub-clusters (Fig. 5e). Most subclusters contained a mix of cells from all three regions (Fig. 5f) and HD grades (Fig. 5g, h), although in clusters 4 and 6 most nuclei were derived from the cingulate, and in clusters 1, 3, and 7 caudate nuclei represented the largest proportion (Fig. 5g). Most clusters contained mixtures of nuclei from both HD and controls, but a number showed a preponderance of one or the other (Fig. 5h) with the caveat that our dataset harbored relatively larger numbers of HD nuclei versus control (Con 17955, HD 76088). With that caveat, Cluster 2 was mostly composed of HDJ nuclei, while cluster 6 was composed of a preponderance of HD3 nuclei (Supplementary Fig. 7c). Examination of select gene markers shows that clusters 4 and 5 represent OPCs with relatively high expression of OPC markers TNR and DSCAM (Fig. 5i and Supplementary Fig. 7d) and low expression of gene markers for mature OLs. Compared to cluster 5, cluster 4 shows lower expression of OPC genes BCAN, VCAN, PDGFRA, and CSPG4, but a higher proportion of cells with TCF7L2 expression, suggesting this cluster represents differentiation committed OPCs57 (Supplementary Fig 7d). Conversely, clusters 1, 2, 3, and 7 show relatively high expression of OL genes CNP, PLP1, and MBP (Fig. 5i). Among the former, cluster 2 shows the highest expression levels of OPALIN and MOG, suggesting it is most mature (myelinating). Cluster 7 showed expression of both OL genes (although at comparatively lower levels) and the OPC gene DSCAM and is interpreted as an intermediate state between OL and OPC lineages. Likewise, cluster 6 showed expression of the immature OL gene CA2 as well as other OL genes including APOD, PTGDS, and CRYAB, but not myelin genes. It is thus also interpreted as immature OL. Interestingly, the HD-enriched clusters 1, 2, and 7 showed higher expression levels of KIRREL3 compared with the control-enriched cluster 3. KIRREL3 is a gene shown to be highly expressed in OL residing in chronic inactive lesions of multiple sclerosis57, and was identified as a key driver in our causal network model. The cluster markers are provided in Supplementary Data 7.
These data show a progressive loss of OL maturation in HD that spans different brain regions. but appears more pronounced in the striatum. The data also suggests similar mechanisms between the mouse and human HD samples, showing differential expression of previously described key drivers, but also unique features of human HD OLs with immune-related genes changes.
Differential gene expression analysis reveals further differences between HD and control OLs
We next identified significant DEGs between HD and control OL and OPC nuclei in different regions; the number of significant DEGs unique to and shared by respective anatomic regions is shown in Venn diagrams for OLs (Fig. 6a and Supplementary Data 8) and OPCs (Fig. 6b and Supplementary Data 8). Given that the neurodegeneration is detected in the caudate nucleus at the earliest stages of HD and that pathology in the nucleus accumbens and cortex is typically seen in more advanced disease, we reasoned that comparing DEGs in these regions is informative in the following ways: (1) DEGs that are shared among the caudate, accumbens, and cingulate likely represent pervasive or core transcriptional pathology in different anatomic regions regardless of disease severity. (2) DEGs shared between the relatively preserved nucleus accumbens and less severely affected cingulate cortex likely represent early pathologic alterations that may be compensatory in early stages of the disease and are lost in more advanced stages. This does not preclude the possibility that any number of these DEGs may represent cell-autonomous changes due to mHTT in OL and OPCs.
Differential gene expression analysis of HD and control OPCs and OLs.
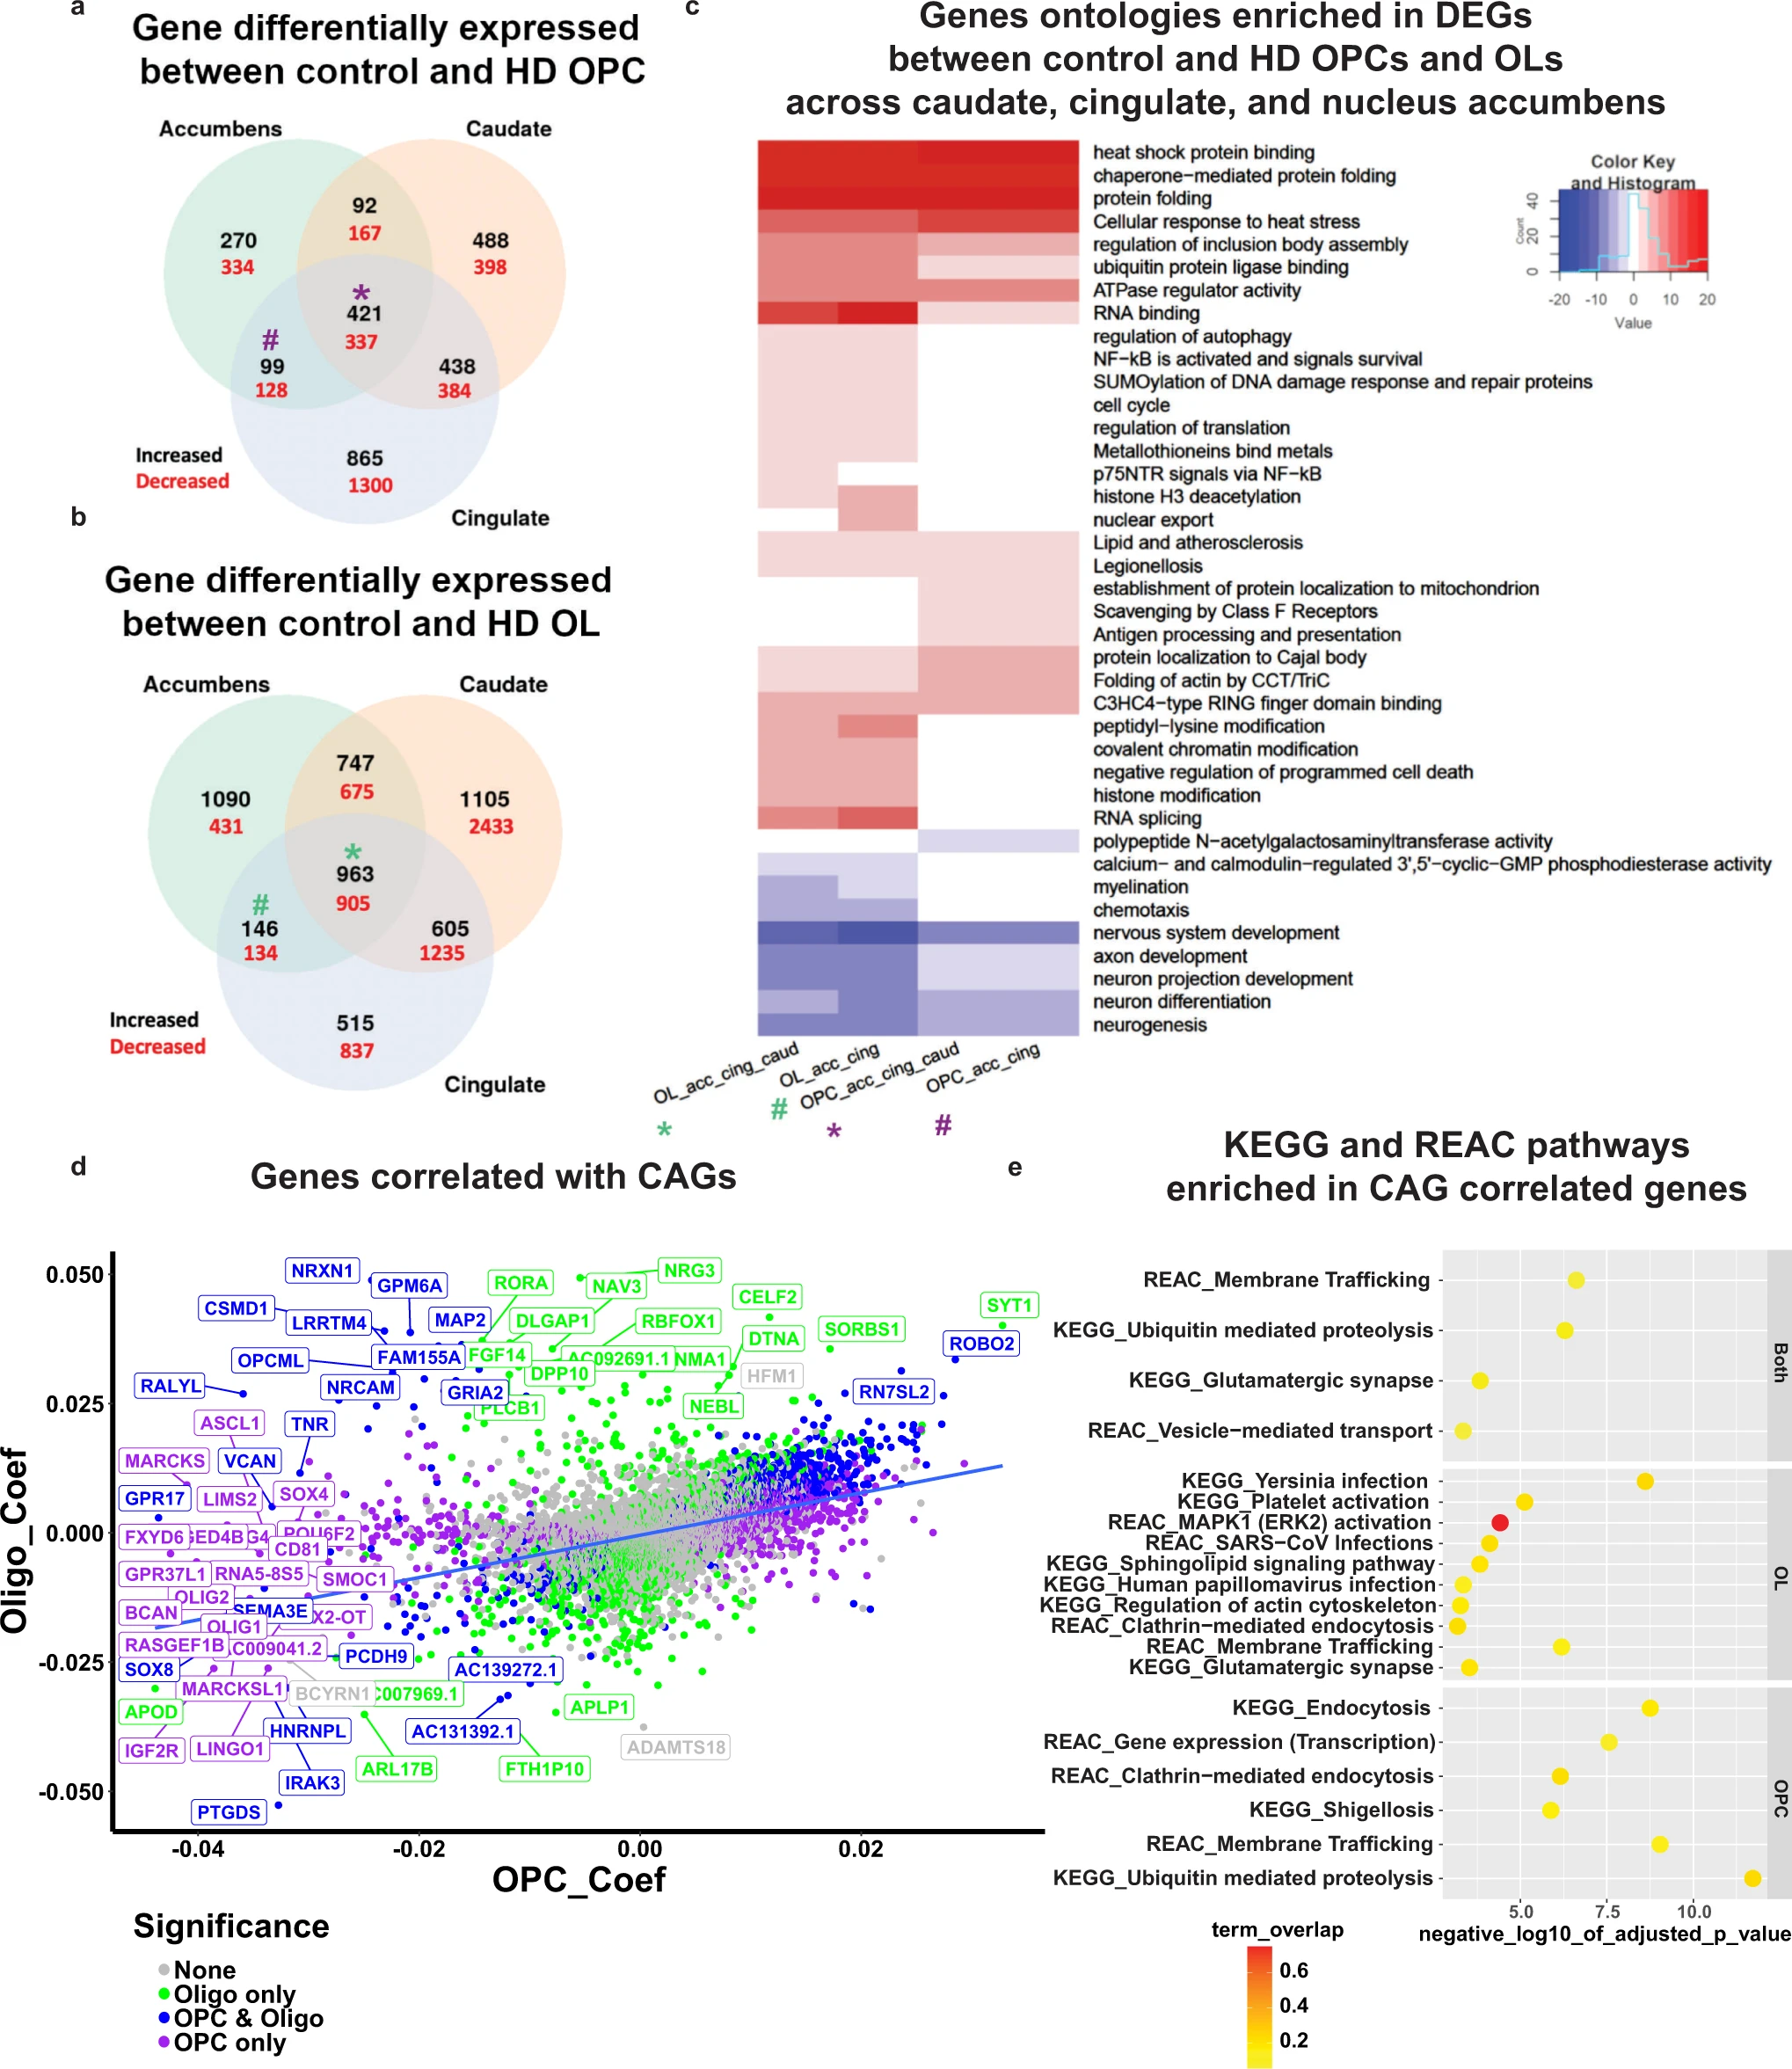
Venn diagram analysis of the DEGs in OPCs (a) and OLs (b). The number of DEGs that are increased (black) or decreased (red) in HD nuclei is highlighted per overlap sector. The stars indicate the DEGs that are shared across all regions, and the # indicates the DEGs shared between the Cingulate and Accumbens. cGene ontology (GO) term analysis of differentially expressed genes in select sectors of the Venn diagrams HD versus control OLs and OPC (from panels a, b). The * and # signs correspond to the DEGs shared across all regions and DEGs shared between accumbens and cingulate OL and OPCs, respectively (purple = OPC DEGs, and green = OL DEGs). The sign of the negative log10 of the adjusted p value indicates the direction of changes; positive sign corresponds to genes increased in HD, and negative sign corresponds to genes decreased in HD. Heat shock protein encoding genes HSPA1A, HSPH1, HSPA4L, HSP90AA1, HSPB1, HSPA4, HSPD1, HSPA1A, HSPA1B, and HSPB1. d Scatter plot of the correlation coefficients of genes that correlate with CAG repeats in OPCs (y-axis) and OLs (x-axis). The graph plots the regression coefficients of each gene in OLs versus OPCs; the upper right quadrant represents genes with positive correlations in both OPCs and OL, the lower left quadrant genes that have negative correlations in both. The color of the genes correspond to whether the coefficient was significant in OLs only (green), OPCs and OLs (blue), or OPCs only (purple). e KEGG and Reactome pathway enrichment analysis of the genes that significantly correlate with CAG repeats in OPCs and OLs (top panel), OLs (middle panel), or OPCs (lower panel). The negative log10 of the adjusted pvalue is indicated on the x-axis, and the pathways on the y-axis. The color of each circle corresponds to the percentage of overlap between the CAG-correlated genes and the genes in each pathway.
With this insight, examination of significant DEGs in these regions highlights a number of themes; first, myelin related and OL identity genes (e.g.,MAG, MBP, MOBP, MOG, OPALIN, PLP1, CNP, and OLIG1 and OLIG2) were downregulated in OLs of all areas in HD, (Supplementary Data 8). This was reflected in a negative enrichment of the GO myelination in HD OL’s across all three brain regions (Fig. 6c). Second, multiple heat shock encoding and heat shock response genes were increased across all anatomic regions, suggesting widespread, pervasive pathology in HD OLs (Supplementary Data 8). Multiple metallothionein genes (e.g., MT2A, MT3, MT1X, MT1M, and MT1E) were also increased in all brain regions in HD (Supplementary Data 8). SPP1, which encodes a secreted protein that is increased in demyelination and remyelination58, was also increased in all these regions. CA2, a gene encoding a carbonic anhydrase enzyme expressed in immature OL and mature OLs but not OPCs59, was increased in cingulate OLs (validated in Supplementary Fig. 8b–e).
To determine whether similar metabolic genes were dysregulated in our human OPC and OLs that were found in our mouse data, we overlapped human OPC and OL DEGs with the dysregulated metabolic genes in the 12w striatum data and found a large overlap with these DEGs (Supplementary Fig. 8a) including DGKx, GALNTx genes, PTGDS, and TPK1. Furthermore, several DEGs shared between the accumbens and cingulate OLs were related to metabolism, including adipogenesis (ARL4A, COQ3, CHUK, ABCA1, GBE1, and ME1—increased in HD OLs), fatty acid metabolism (EVOVL2 and PLA2G6—decreased in HD OLs), and pyruvate metabolism (pyruvate kinase M1/M2 PKM – decreased in HD OLs). These results implicate metabolic pathways, including lipid and glucose metabolism in HD pathology (Fig. 6c and Supplementary Data 8). The involvement of immune genes we observed in HD-enriched clusters is also reflected in the enrichment of immune-related ontologies in the HD OLs DEGs, including NFKB activation and inflammasome (Fig. 6c and Supplementary Data 8). Similar to the mouse data, we also see terms related to nervous system development, ion channels, and cell adhesion (Fig. 2a and Supplementary Data 8).
These results confirmed the pseudotime analysis showing a decrease in OL maturation in HD. Downregulation of OL-specific functional genes and a significant enrichment of metabolic genes, similarly identified in our mouse data, suggest a common theme and possible connection between metabolic processes and OL development in HD.
Dysregulated gene expression is related to numbers of CAG repeats
The length of CAG repeats varied among our donors, and even between regions in the same donor (Supplementary Data 6). To determine if any of the OL or OPC genes varied as a function of the numbers of CAG repeats, we conducted a regression analysis with gene expression as response variable and CAG repeats as explanatory variable. We collapsed cells from each sample and used the pseudobulk samples as input for the regression analysis, corrected for batch and brain region, and only extracted the significant CAG coefficients (Supplementary Data 7). A number of genes showed significant correlations between expression and CAG repeat lengths, some in OPCs or OLs or both (Fig. 6d). Among genes with negative correlations in OPCs are transcription factors OLIG1 and OLIG2, ASCL1, SOX2, and SOX4, which play roles in OL-lineage development, along with IGF2R, suggesting that progression through the OL lineage is further inhibited with longer repeat length. Indeed, OPC lineage genes including OPCML and CSPG4 were negatively correlated with CAG repeat length (Fig. 6d). Moreover, PTGDS, a cluster 6 marker, had the most negative coefficients in both OPCs and OLs as a function of CAG repeat length, implicating prostaglandin synthesis in the severity of HD pathology. Some of these genes also were identified in our OL bnet as key drivers, including: SGK1, TNR, and NAV3 (Fig. 4b). We also investigated KEGG and REAC pathways that were enriched in genes correlated with CAG repeat lengths (Fig. 6e and Supplementary Data 7). Among the pathways that are enriched in OLs with increasing repeat lengths are those of inflammation, which is more pronounced in human brain than in the mice, sphingolipid signaling, and ERK2 activation, known to control myelination60. Both OLs and OPCs show enrichment in genes related to glutamatergic synapses and ubiquitin-mediated proteolysis. When we examined the OL genes with negative coefficients, we found that a number of them are involved in cholesterol metabolism including (DHCR7, DHCR24, ABCA2, and ACAT2 – Supplementary Data 7), which further implicates lipid metabolism as central to OL pathology in HD.
Validation of OL pathology in human HD and mouse data
Many genes that regulate OL maturation or were identified as key regulators were similarly dysregulated in HD patient and mouse data including: MOBP, MAL, CLDN11, MBP, OLIG1, OPALIN, PRKCE, and SMARCA2 (Fig. 7a). We performed WB analysis to confirm dysregulation of key genes PRKCE and TPK1. Additional investigation and validation of OL genes and other metabolic genes was also conducted (Supplementary results and Fig. 8). Protein levels of PRKCE, and phospho-PRKCE were significantly decreased in the cingulate and caudate of HD brains and the cortex and striatum in the 12w R6/2 mice (Fig. 7b–e). Both species showed an increase in PRKCE RNA levels, opposite of the protein data. The ratio of p-PRKCE to PRKCE was not altered though, suggesting that reduction in active PRKCE is related to reduced protein levels (Fig. 7b–e).
Western, lipidomics, and cellular analyses validates HD differences in TPK1 and PRKCE.
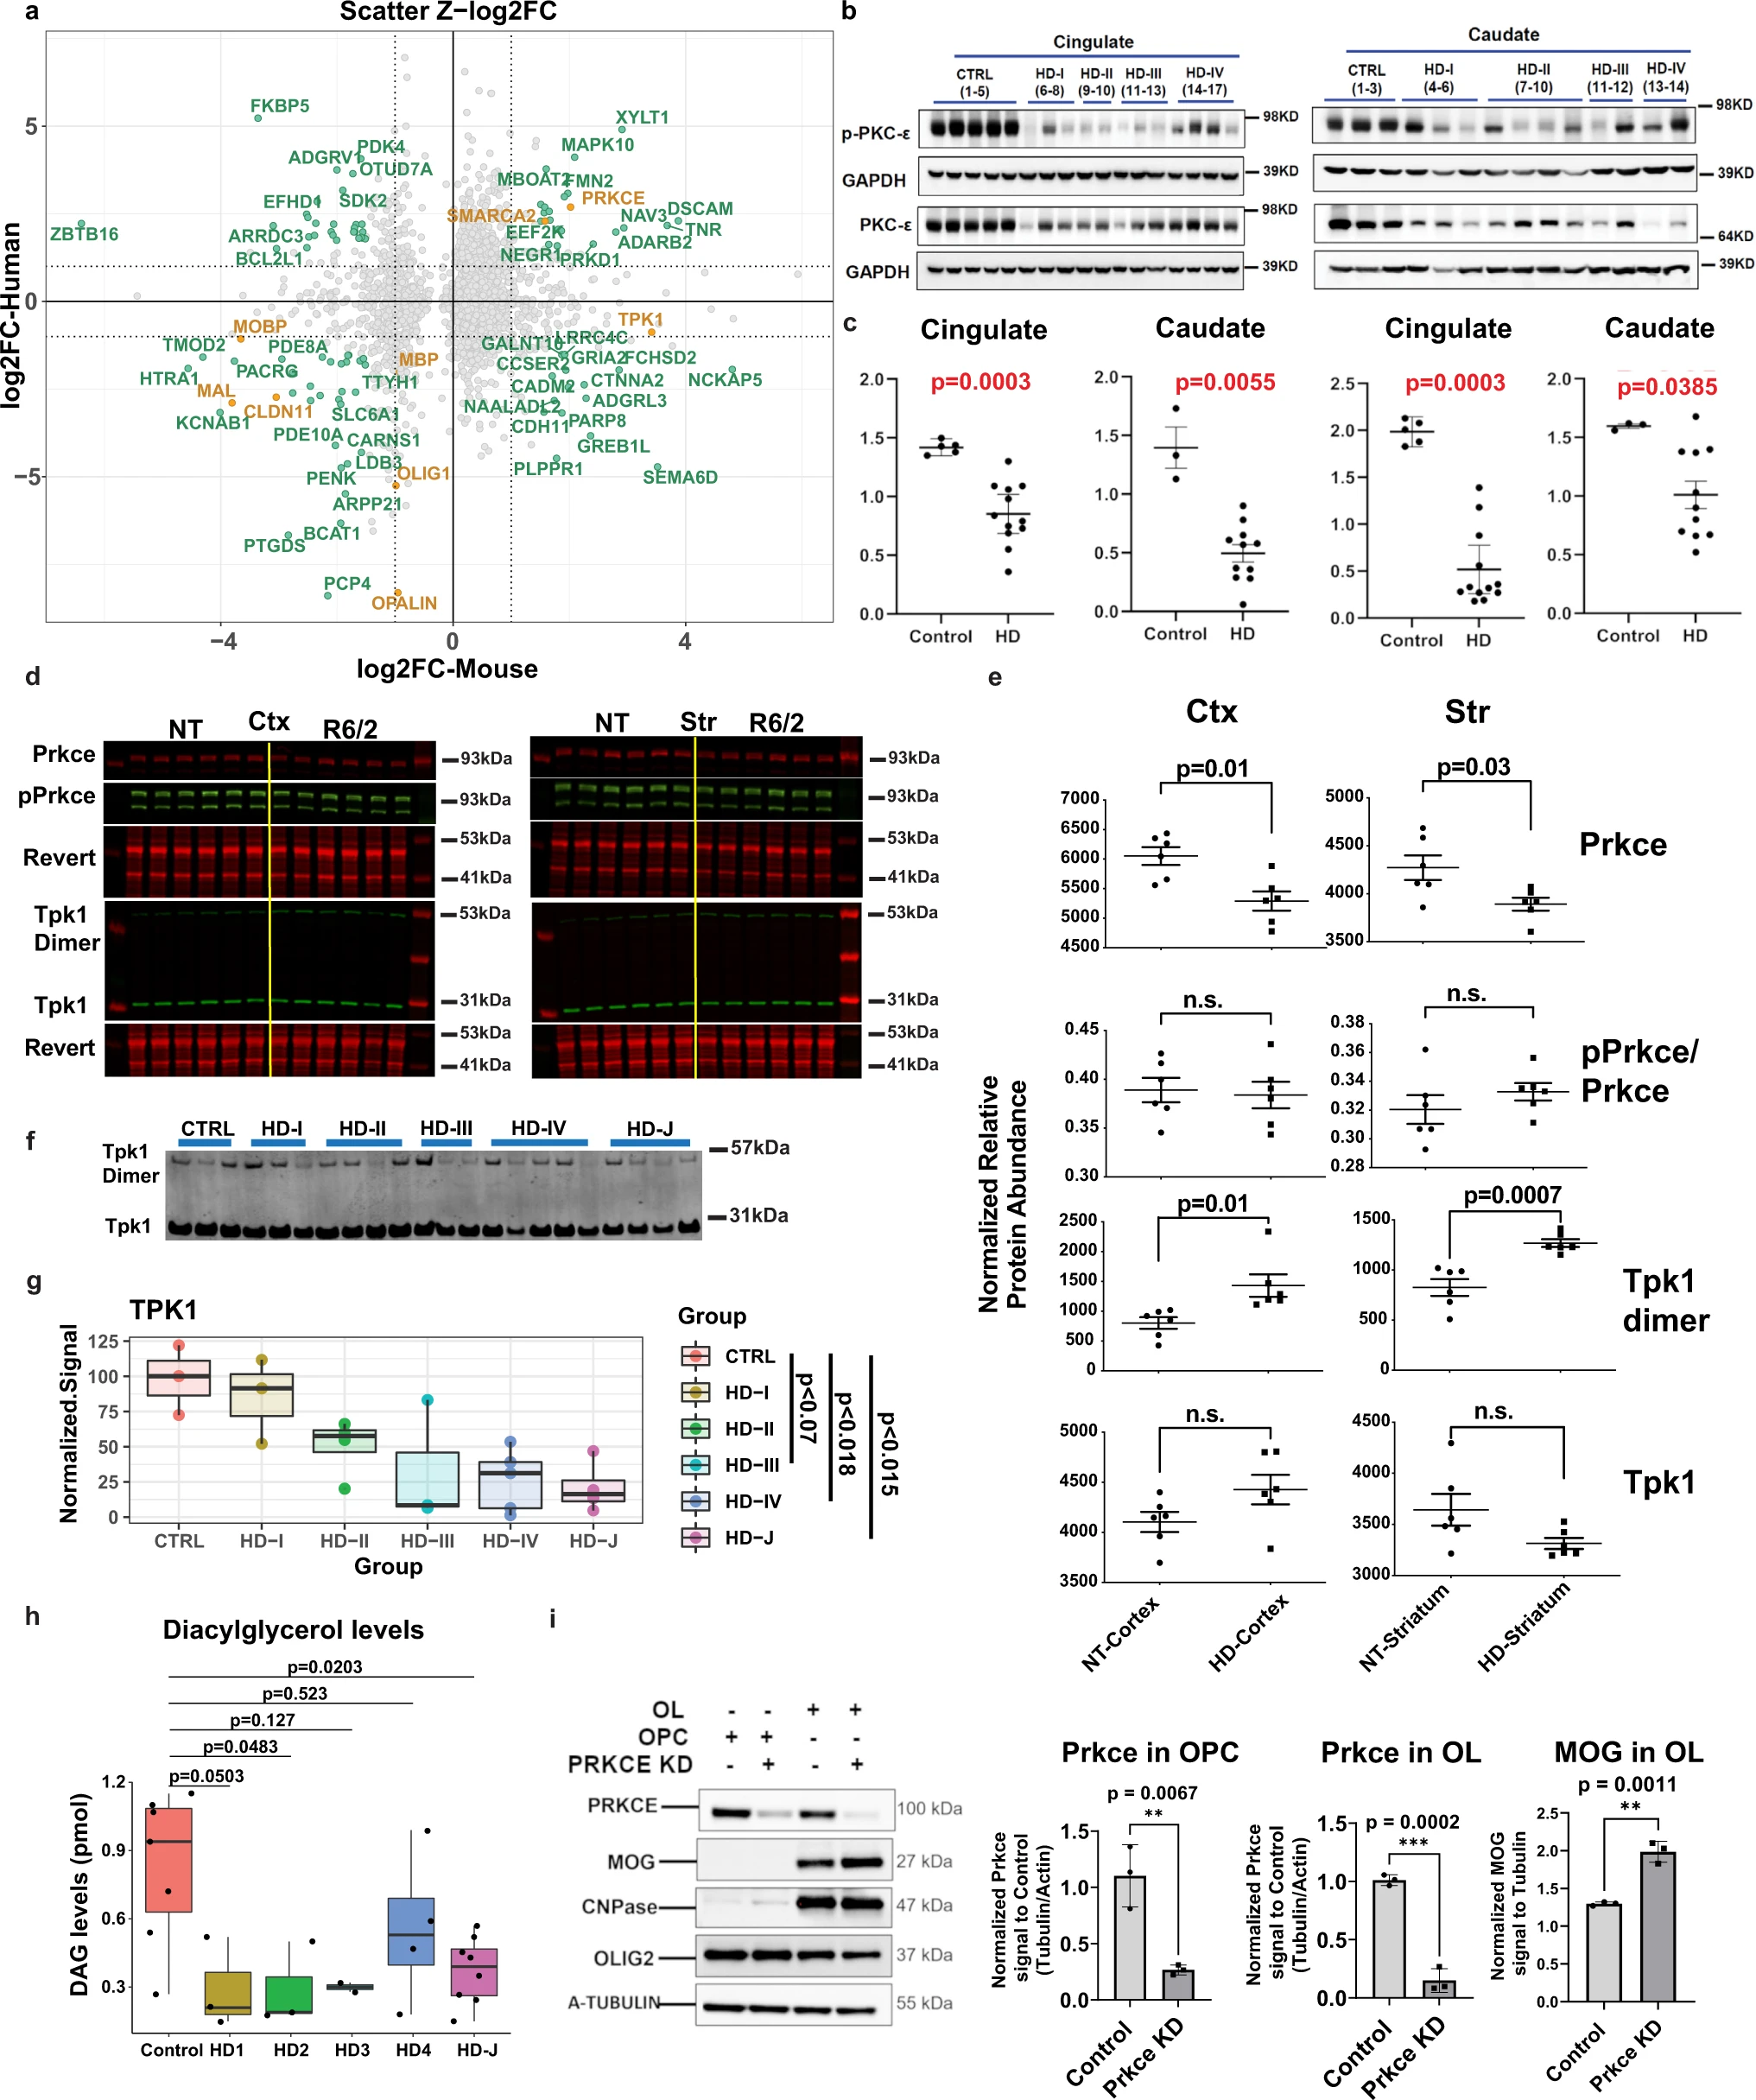
a Scatterplots of Z-score log2 fold change values comparing mouse and human data in 12w striatum versus human caudate OL DEGs. Genes with |Z-log2FC| values > 1 are highlighted in seafoam green and OL maturation genes are highlighted in orange, showing concordance between species for PRKCE and OL maturation genes, and discordance of TPK1 expression. b Western blot of PRKCE and phospho-PRKCE in HD and control patient cingulate cortex and caudate. c Quantification of western blot results. Two-tailed Mann Whitney test used for each statistical analysis. Exact p-values: Cingulate: PKCE-0.0003, p-PKCE-0.0003; Caudate: PKCE-0.0055, p-PKCE- 0.0385. n = 3 control and 11–12 HD caudate samples, and 5 control and 11–12 HD cingulate samples. Data shown as mean +/− SEM as error bars. d Licor images of Prkce, pPrkce, TPK1, and respective revert in R6/2 and NT striatum and cortex. e Quantification of licor results. One-way ANOVA used for statistical analysis. n = 6 NT and 6 R6/2, biologically independent samples. Data shown as mean +/− SEM as error bars. f Western blot of TPK1 in human caudate samples from juvenile HD, HD grades 1–4, and control patients. g Quantification of human TPK1. Statistical analysis was done using a one-way ANOVA and Tukey HSD posthoc, comparing control to each adult HD grades (adjusted p = 0.979, 0.221, 0.070, and 0.018) and control to juvenile HD (p = 0.015). Data shown as median (center line), first and third quartile (Inner quartile range, box), and min and max values as whiskers. h DAG levels quantified from HD and control patient brains showing significant decreased DAG levels in HD brains. One-way ANOVA and Tukey’s HSD posthoc used for statistical analysis, comparing control to each adult HD grades. n = 7 control, 3 HD1, 3 HD2, 2 HD3, 4 HD4, 8 HD-J, biologically independent samples. Data shown as median (center line), inner quartile range (box), and min and max values as whiskers. i Western blot of PRKCE, MOG, CNPase, OLIG2, and A-Tubulin in OPC and OLs +/− K/D of PRKCE. Two-tailed Mann Whitney test used for statistical analysis. n = 3 biologically independent samples per group. Data shown as mean +/− SEM as error bars. For western blot results, source data are provided as a Source Data file.
Since TPK1 was found to be dysregulated in both mouse (up) and human (down) data at the RNA level in OLs and OPCs, we assessed the protein levels of the monomer and active dimer form of TPK1. Figure 7f, g shows a decrease of TPK1 (monomer and dimer) in HD patient tissue with HD grades 3 & 4 (At adjusted p-value <0.1 for 3, and <0.05 for 4), and in juvenile HD (adjusted p < 0.05), consistent with RNA expression data, whereas TPK1 dimer is increased in the R6/2 striatum (Fig. 7d, e). The mouse and human data are discordant from each other which may indicate a loss of function of expression in humans and compensatory increase in the mice or other unknown mechanism. Nonetheless, the data confirms that TPK1 is dysregulated in both human HD and murine model of HD.
Given the potential contribution of DAG to OL development and as a substrate of PRKCE—a central hub of the OL causal network, we evaluated DAG levels using lipidomic profiling of control brain versus HD in the cingulate. A significant decrease in DAG levels was observed in juvenile HD brain as well as grade 2 HD brains relative to controls (Fig. 7h). These data support the hypothesis that glucose and lipid metabolism, and specifically DAG signaling, potentially through PRKCE, could be playing an important role in the OPC/OL maturation changes we see between HD and control patients. This is further supported by the reduction in TPK1 in HD brains due to the involvement of thiamine in the production of acetyl-CoA, which is then used during DAG formation. Given this finding along with the results demonstrating the reduction of PRKCE in human tissue, together with the causal network analysis placing PRKCE at the top of the OL/OPC network upstream to several maturation genes, we hypothesized that it played an important role in promoting OL differentiation. To test this hypothesis, we knocked down Prkce in primary murine OPC cultures, and differentiated these cells into OLs. The cultures expressed OLIG2, and OLs expressed CNPase. Compared with scrambled siRNA, siRNA specific to Prkce effectively knocked down the protein (Fig. 7i). The levels of MOG were significantly increased by Prkce knockdown, supporting that the downregulation of Prkce leads to increased OL differentiation. Thus, the loss of PRKCE—as seen in our western blot data—in both human and mouse HD OPCs/OLs—would lead to increased OPC commitment to differentiation and an increase in COP cells, seen in our snRNAseq data.
These results provide validation of our causal network approach to identify key regulatory genes, and suggests important roles for glucose, thiamine, and lipid metabolism, through DAG and PRKCE, in regulating OL maturation in HD.
High Dose thiamine and biotin rescues transcriptional dysregulation in neurons and altered OL and OPC developmental genes in a mouse model of HD
Given that both mouse and human data showed alterations in TPK1 and SLC19A2, and these may regulate PRKCE thorough DAG, we hypothesized that altered signaling due to TPP deficiencies may be contributing to gene expression and cell maturation differences. We, therefore, tested whether high doses of thiamine and biotin (T&B) treatment, similar to that used to treat HD-like phenocopy diseases such as biotin-responsive basal ganglia disease33, would rescue gene expression changes including OL maturation genes. Furthermore, due to the discordant RNA expression changes in our mouse and human data we speculate that the increase in TPK1 was compensatory in the HD mouse model. Considering TPK1 was only increased at 12w and not 8w, we suspect that these compensatory changes are responding to earlier metabolic changes and tested whether targeting thiamine metabolism at a relatively early timepoint prior to any documented changes in TPK1 expression61, would rescue the dys-maturation. For this study, R6/1 mice were used given symptoms are delayed by several weeks relative to R6/2 mice31, thus allowing a greater window to observe effects of a given treatment. R6/1 and NT mice (8w-old) were treated with vehicle or T&B for 7wks to a time point at which transcriptional changes are observed, before striatal tissue was collected and analyzed using snRNAseq (Fig. 8a). MSNs, inhibitory neurons, OPCs, OL, and Astros showed the most DEGs between R6/1 and NT vehicle-treated mice (Supplementary Data 10). Comparing R6/2 and R6/1 DEGs for each cell type, we found high correlation between HD models and a significant overlap in DEGs, including between OPC and OL maturation genes (Fig. 8b) supporting the use of R6/1 mice for the supplementation study. When we evaluated DEGs between R6/1T&B treated and vehicle-treated mice (treatment effect), for each cell type, there was a significant overlap of genes impacted by T&B treatment and genotype DEGs (Fig. 8b). Figure 8c shows a scatterplot of the overlapping DEGs between the T&B treatment effect (R6/1 + T&B vs R6/1 + vehicle) and the genotype DEGs (R6/1 vs NT) for each cell type, which shows significant discordance between the genotype DEGs and the treatment DEGs, indicating rescue of these transcriptional alterations. This translated into a decrease in the number of significant DEGs detected for each cell type ((R6/1 + T&B vs NT) compared to (R6/1 + Vehicle vs NT)), except for the Ex neurons which actually had an increase in DEGs (Fig. 8d). Interestingly, the cell types with the most genes rescued by T&B treatment (discordant values) were OL-lineage cells and Adarb2+ interneurons that represent inhibitory neuron subcluster 1 (Inhib1 (Fig. 8a)). Based on the reduction of DEGs detected, OL, MSNs, Interneurons, Astros, and OPC all had a large decrease in the number of DEGs detected (115, 176, 378, 129, and 82 DEGs, respectively). Within the OPCs and OLs there was significant rescue of maturation-related DEGs Clnd11 and Mal, and a further increase of Neat1, which was increased in caudate-parenchymal human HD OLs, and is upregulated during OL maturation. Several genes that correlated with CAG repeat length, e.g., Ptgds, Phgdh, and Tmtc2, were rescued by T&B treatment. GO enrichment analysis also revealed the molecular functions of the genotype DEGs that were rescued from T&B treatment (Fig. 8e). In Astrocytes there was a significant rescue of iron metabolism-related genes, Ex neurons showed rescue of neuroligin binding and calcium signaling, and the MSNs showed rescue of cyclic nucleotide phosphodiesterase activity, GABA receptor activity, calcium transport, creatine kinase activity, and electron transport chain genes. Similar to MSNs, the inhibitory neurons showed rescue of calcium-related genes, cyclic phosphodiesterase activity, and creatine kinase activity, but also showed unique terms such as glutamate receptor activity, LDL binding, neurotrophic TRK receptor, and fructose binding. Lastly, the OPCs and OLs showed rescue of glutamate receptor activity, RNA binding, creatine kinase activity, calcium-related genes, and GTP binding.
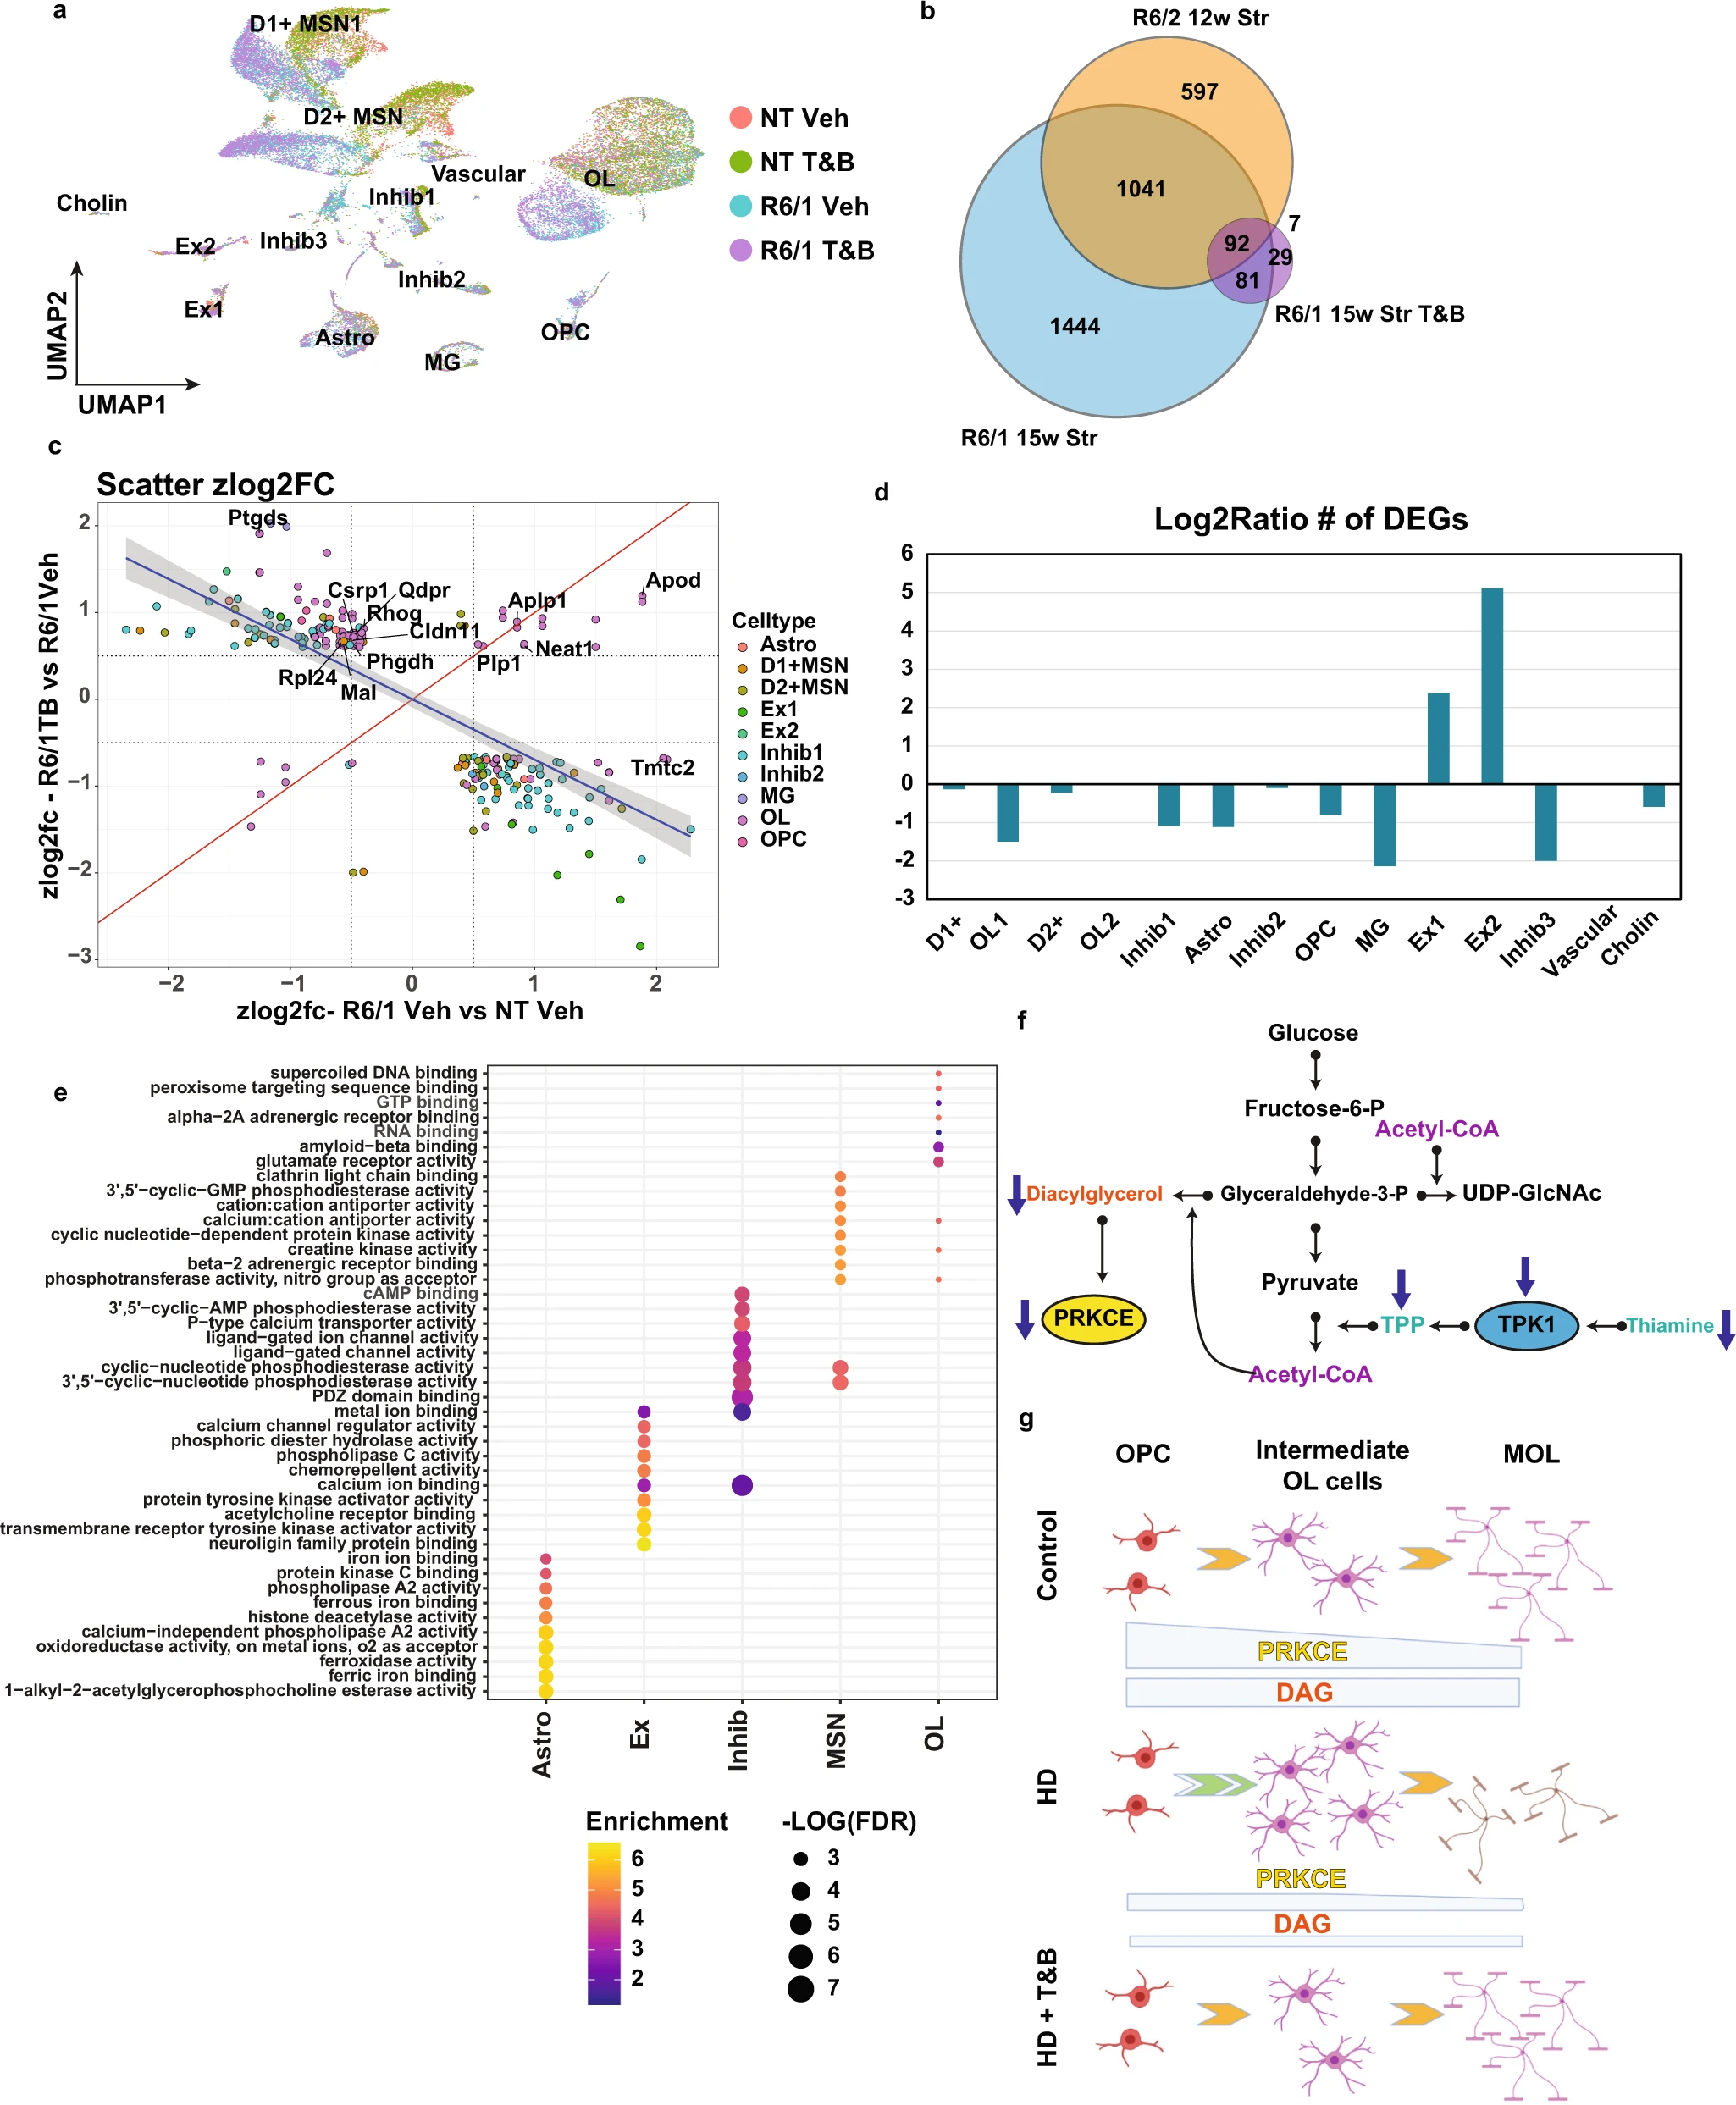
Thiamine and biotin study in R6/1 mice shows rescue of OL maturation DEGs and other cell type DEGs.
a UMAP showing the R6/1 and NT mouse data colored by genotype and treatment. b Venn diagram comparing genotype DEGs in 15w R6/1 mice and 12wStr of R6/2 mice against each other and treatment effect DEGs from R6/1T&B treated versus vehicle. c Scatterplot showing Z-score log2FC of all genes overlapping between genotype and treatment effect DEGs. Colored by cell type origin. OL and Inhib1 neurons show the most rescued DEGs. Quadrants 1 and 3 represent rescue of expression and 2 and 4 represent exacerbation. d Barplot showing the log2ratio of the number of significant DEGs comparing R61 vehicle versus NT vehicle to R6/1T&B versus NT vehicle. e Top 10 GO terms of overlapping DEGs per cell type (R61 vehicle versus NT vehicle to R6/1T&B versus NT vehicle). f Illustration of metabolic pathways impacted in HD. g Illustration showing how PRKCE and DAG levels regulate OPC commitment to differentiation and MOL maturation in control and HD, and how T&B treatment rescues maturation impairments. Created with BioRender.com.
These results (a) support the hypothesis that common metabolic changes across cell types in HD contribute to driving cell type-specific transcriptional changes and that (b) specifically thiamine metabolism deficits may be contributing to OL maturation deficits.
Discussion
The studies above describe a systematic and in-depth analysis of single cell transcriptomics of HD mouse models and human patient brains leveraging CNM to implicate key drivers of gene expression pathology. Using snRNAseq, we identified dysregulated genes across multiple cell types and cell type-specific changes that may drive the functional changes seen in each cell type. In addition to specific changes in neurons, such as D1 and D2 MSNs, a large number of changes were seen in the OL lineage that related to development and maturation processes. We defined a progressive dys-maturation phenotype that spans multiple brain regions in both human and mouse HD. CNM identified potential key genes and molecules with putative causal roles in cell type-specific alterations, several of which were connected to metabolic functions, cell maturation, and OL/OPC-identity genes. This includes PRKCE, a signaling protein regulated by DAG, which causally interacts with SMARCA2 and OLIG2, both important in OL maturation. Functional studies validated PRKCE’s role in promoting OL maturation. ATACseq data provided further validation demonstrating decreased accessibility for genes regulated by known OL developmental TFs (SOX9 and 10, OLIG1 and 2, and ASCL1)62, further implicating abnormalities in OL differentiation in HD. These data provided a framework to build targeted therapeutics, as illustrated by treatment with T&B that restored many of the maturation and transcriptional deficits and provides further validation of our approach.
Recent single nuclei studies identified common and cell type-specific transcriptional alterations in R6/2 and Q175 HD mouse models that were recapitulated in postmortem HD human caudate and putamen14,63, showing cell-type specific alterations in HD. In MSNs, mitochondrial dysfunction underlay a detrimental innate immune response14. Striatal OLs showed decreased expression of several markers, however, the correlation between mouse and human OL signatures was low in this case. Here, we show that OLs are increased in the human cingulate and caudate, and mouse and human OL show similar transcriptional dysregulation and reduced maturation. HD OLs are transcriptionally immature across multiple human and mouse brain regions. The fact that this phenotype spans the severely affected caudate, moderately involved cingulate, and the relatively preserved nucleus accumbens suggests that the deficits are independent of disease severity or anatomic region. Nonetheless, our data shows that impaired OL maturation is progressive with HD grade, and that in juvenile-onset HD, the maturation deficits largely involve OPCs. This was supported by ATACseq results demonstrating reduced binding of OL developmental TFs.
A caveat of our ATACseq analysis is that we FACS-sorted nuclei using NeuN. While this enriches for neurons in the sorted fraction, and glia in the flowthrough fraction, the analysis is limited by the sensitivity and specificity of the antibody we used. It is also known that not all neurons express NeuN64. Thus, our NeuN- fraction may still contain NeuN negative neurons. Furthermore, the NeuN- fraction may contain other non-glial cells such as endothelial cells. These caveats would be circumvented by the use of single cell ATACseq, a future direction for this study. That being said, our NeuN- fraction showed high read densities over the Olig2gene, which indicates that we indeed represented OL-lineage cells in the dataset.
The OL lineage pathology may reflect both a maturational deficiency and an inability to turn over myelin components. We suggest that OL defects start during the development of OLs from OPCs, which is consistent with previous studies22. In our human data, this finding was most pronounced in juvenile-onset HD, where maturational deficits appear to almost entirely involve OPCs, based on the pseudotime analysis. We speculate this may arise from the longer CAG repeat lengths in juvenile-onset HD, and the fact that HTT is expressed more highly in OPCs compared to OLs65. Other studies suggest that MYRF plays a role in OL maturational defects, Huang et al. showed that mHTT binds to MYRF and downregulates myelin genes17. MYRF is positively regulated by CHD7, which is regulated by OLIG249—a master regulator of OL identity and a gene our results implicate in HD pathology. Finally, if the accumulation of mHTT downregulates the transcription of myelin genes, it may inhibit the ability of already myelinating OLs to produce myelin components during their normal turnover, thus leading to a progressive loss of myelin.
Metabolic disturbances in HD are hypothesized to lead directly to cellular distress, but less is known about their contributions towards epigenetic regulation, transcriptional deficits, and impact on cell maturation and identity. Both mouse and human snRNAseq data show dysregulation of key genes related to glucose and lipid metabolism that include genes that are within or downstream of several key metabolic pathways, including glycolysis, DAG, and hexosamine and protein glycosylation. Additionally, we show that DAG lipids, which activate PRKCE, were decreased in HD brains. Interestingly, protein kinase C signaling has been shown to be important to OPC differentiation, and myelination66,67,68,69. We found PRKCE levels to be decreased in HD, and that downregulating PRKCE in OPCs in vitro leads to increased differentiation of OLs. Further determination of the mechanism underlying these findings is the subject of future studies. Moreover, appropriate glucose metabolism is critical for the proper development and function of OLs, as OPCs transition to myelinating OLs70,71,72,73. Finally, thiamine metabolism is linked to OL differentiation based on evidence from deficient pyruvate dehydrogenase function in humans, which is known to cause structural white matter abnormalities74, and experimental evidence from pyruvate-dehydrogenase deficient mice, which show a reduction of O4-positive OL/OPCs75.
TPK1 is a highly dysregulated gene and the most common DEG across cell types in the R6/2 12w striatal data. TPK1 regulates the conversion of thiamine to thiamine-pyrophosphate (TPP), a cofactor required for the conversion of pyruvate to acetyl-CoA, by alpha-ketoglutarate dehydrogenase in the TCA cycle and by ketolase in the pentose phosphate pathway, the latter being active in OL cultures and important for myelinating OLs76. Acetyl-CoA links metabolic processes to many epigenetic regulators of transcriptional control as it is used for histone acetylation, is required for the TCA cycle and for feeding metabolites into DNA and histone methylation, for generating both DAG and UDP-GlcNAc, and for PRKCE signaling and protein glycosylation by OGT (Fig. 8f). Interestingly, mutations in TPK1 are linked to Thiamine Metabolism Dysfunction Syndrome 5, which pheno-copies HD, and mutations in thiamine transporters such as SLC19A3 lead to biotin responsive basal ganglia disease77 which is treated with high T&B supplementation. Driven by our findings and similarities to other human disorders, we evaluated T&B treatment as a therapeutic strategy to reverse HD pathology in R6/1 mice. We hypothesized that TPK1 shows a compensatory increase in HD mice at later ages, responding to earlier metabolic changes, and tested this hypothesis by treating relatively pre-symptomatic R6/1 HD mice. Several transcriptional pathologies in HD were rescued by high dose T&B, suggesting promise as a potential treatment strategy. Excitingly, during the course of our study, a separate study was published showing a decrease in SLC19A3 and TPP in HD patients and in both R6/1 and zQ175 mice78. High dose T&B treatment produced both increased thiamine levels in the brain and CSF and behavioral rescue in R6/1 mice as early as 13 weeks. Our snRNAseq data revealed that R6/1 mice show maturation deficits and loss of cell identity genes similar to the R6/2 model and that treatment with T&B in the R6/1 mice, prior to TPK1 or SLC19A3 RNA changes, not only rescued a significant portion of dysregulated genes, including neuronal, but also specifically rescued expression of a specific subtype of inhibitory neurons and OPC and OL maturation genes. Furthermore, there was a reduction in the total number of significant DEGs in all cell types, except for in Ex neurons which may reflect compensatory changes due to the discordant levels in the genotype and treatment effects, but this requires further study outside the scope of this work. These data provide validation of the two studies and additional mechanistic insight that rescue by T&B likely acts in part through rescue of transcriptional deficits in many cell types and not just MSNs, whose survival was rescued in the other study, including a specific subpopulation of inhibitory neurons expressing Adarb2, and of OPC/OLs. Our data suggests that OL maturation impairments may be driven, in part, by thiamine metabolism and changes in the binding of TFs that regulate OL maturation, including SOX9 and 10 and OLIG1 and OLIG2. Furthermore, HD OPCs seem to have increased commitment into COP and immature OL which could be driven by decreased DAG and PRKCE, which is rescued by T&B treatment (Fig. 8g).
Lastly, these data further supports T&B as a viable potential treatment for HD, now undergoing a clinical trial in Spain (https://clinicaltrials.gov/ct2/show/NCT04478734), and supports the utility of using single cell approaches and CNM to guide therapeutic target identification and evaluation.