
High-throughput screening discovers antifibrotic properties of haloperidol by hindering myofibroblast activation

By Michael Rehman, Simone Vodret, Luca Braga, Corrado Guarnaccia, Fulvio Celsi, Giulia Rossetti, Valentina Martinelli, Tiziana Battini, Carlin Long, Kristina Vukusic, Tea Kocijan, Chiara Collesi, Nadja Ring, Natasa Skoko, Mauro Giacca, Giannino Del Sal, Marco Confalonieri, Marcello Raspa, Alessandro Marcello, Michael P. Myers, Sergio Crovella, Paolo Carloni, and Serena Zacchigna
Excerpt from the article published in JCI Insight, Volume 4, Issue 8 on April 18, 2019 e123987. DOI https://doi.org/10.1172/jci.insight.123987.
Editor’s Highlights
- A central role in Fibrotic disorders is certainly played by the differentiation of fibroblasts into myofibroblasts.
- A key event in the fibrotic process is the expression of contractile proteins, including α-smooth muscle actin (αSMA) by fibroblasts, which become myofibroblasts.
- Fibroblasts from various tissues are differentially prone to differentiate into myofibroblasts, both spontaneously and upon transforming growth factor-β (TGF-β) stimulation.
- Sigma receptor 1 (Sigmar1), modulates intracellular calcium with moderate induction of endoplasmic reticulum (ER) stress response, resulting in decreased expression of Neurogenic locus notch homolog protein 1 (Notch1) and its targets, including αSMA.
- The evidence that this pathway is also active in human fibroblasts could set the stage for the validation of Sigmar1 as a novel therapeutic target in inhibiting fibrosis.
- Haloperidol, a sigma receptor 1 antagonist, binding to Sigmar1 induces the release of calcium from the ER into the cytosol, thereby promoting ER stress, which could, in turn, upregulate Sigmar1 levels.
- A clear reduction in both the tumor area and the number of tumor foci was observed, associated with a decreased number of intratumoral myofibroblasts.
- Importantly, the drug was also effective in 3 different mouse models of lung, cardiac, and tumor-associated fibrosis.
Abstract
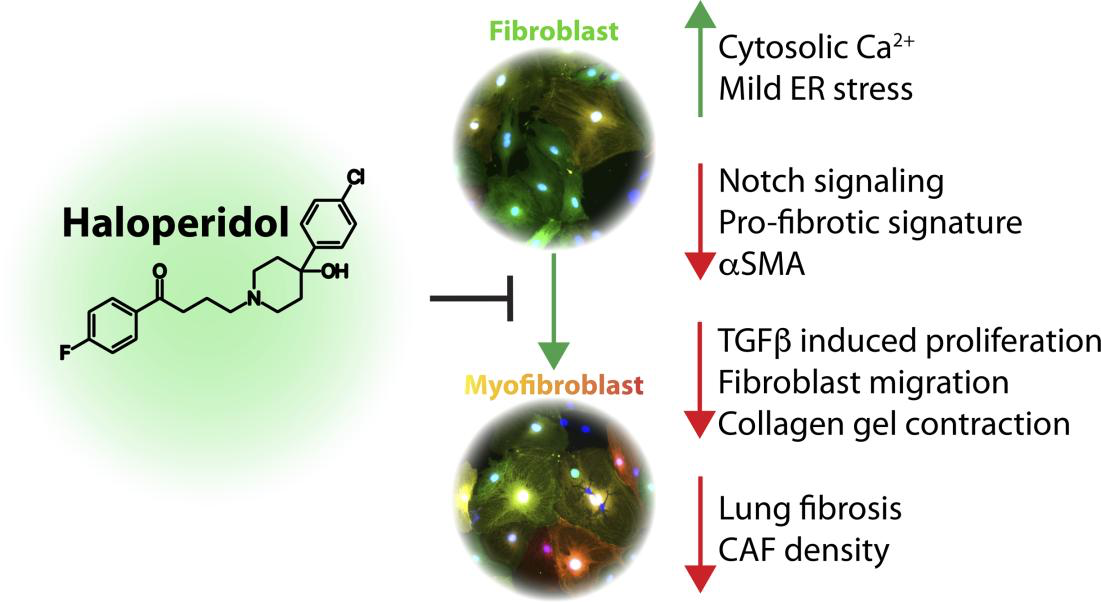
Fibrosis is a hallmark in the pathogenesis of various diseases, with very limited therapeutic solutions. A key event in the fibrotic process is the expression of contractile proteins, including α-smooth muscle actin (αSMA) by fibroblasts, which become myofibroblasts. Here, we report the results of a high-throughput screening of a library of approved drugs that led to the discovery of haloperidol, a common antipsychotic drug, as a potent inhibitor of myofibroblast activation. We show that haloperidol exerts its antifibrotic effect on primary murine and human fibroblasts by binding to sigma receptor 1, independent from the canonical transforming growth factor-β signaling pathway. Its mechanism of action involves the modulation of intracellular calcium, with moderate induction of endoplasmic reticulum stress response, which in turn abrogates Notch1 signaling and the consequent expression of its targets, including αSMA. Importantly, haloperidol also reduced the fibrotic burden in 3 different animal models of lung, cardiac, and tumor-associated fibrosis, thus supporting the repurposing of this drug for the treatment of fibrotic conditions.
Graphical Abstract
Introduction
Fibrotic disorders, including cardiac fibrosis, idiopathic pulmonary fibrosis (IPF), chronic kidney fibrosis, liver cirrhosis, and systemic sclerosis, account for over 45% of deaths, with an increasing trend due to the overall aging of the human population worldwide (1). In addition, cancer-associated fibroblasts (CAFs) are emerging as key players in the growth and progression of a variety of tumors (2). Therefore, the development of safe and effective innovative therapies able to either prevent or reverse the progression of fibrosis is a relevant and unmet clinical need.
Even in organs that can undergo self-repair after injury, severe or chronic damage results in the formation of a fibrotic scar, which often occurs at the expense of regeneration. While the exact cellular and molecular mechanisms that distinguish physiological and self-limited wound healing from pathological nonresolving fibrosis are not clearly defined, a central role is certainly played by the differentiation of fibroblasts into myofibroblasts. The persistent activation of myofibroblasts stands as a key event shifting the reparative program towards fibrosis in several organs (3).
Progress has been made over the last years in the understanding of the signals and mechanisms responsible for myofibroblast activation. Matrix stiffness and mechanical stress in damaged tissues initiate a positive feedback loop between myofibroblasts and their surrounding environment that perpetuates the fibrotic response (4). Stiffness-activated fibroblasts start expressing α-smooth muscle actin (αSMA), which confers contractile activity to these cells, leading to extensive extracellular matrix (ECM) remodeling and further increases in matrix stiffness. Any tissue damage results in cell death that releases a variety of factors, which in turn induce the migration and activation of immune cells, including neutrophils, lymphocytes, and macrophages. All these cells express cytokines that exert strong profibrotic effects. In particular, transforming growth factor-β (TGF-β) stimulates the migration of fibroblasts and their activation into myofibroblasts (5, 6).
Various molecules have so far been proposed and tested as antifibrotic agents. However, there is still no accepted effective treatment able to cure fibrotic diseases (7). Based on the assumption that fibrosis is the result of a chronic, unsolved inflammation, the most exploited therapy so far has been the use of corticosteroids (8–12). However, it is now clear that therapy with antiinflammatory drugs does not provide objective benefit (13–15). Moreover, these drugs are associated with a myriad of adverse effects that eventually worsen patients’ quality of life.
Only recently, 2 drugs have been approved for the treatment of IPF, pirfenidone and nintedanib. Nintedanib was initially identified as a very potent antiangiogenic drug and later shown to inhibit multiple receptor tyrosine kinases (16). Pirfenidone was discovered in 1976 but did not receive approval until after 2011 by both the European Medicines Agency (EMA) and the Food and Drug Administration (FDA). Still, its exact mechanism of action remains unknown to date. Notably, the mechanism of action of both drugs probably entails major antiinflammatory properties (17, 18).
Very few approaches so far have aimed at interfering with myofibroblast activation to inhibit fibrosis. The observation that these cells rely on the production of antiapoptotic proteins, ensuring their survival, has paved the way to the development of small molecules, named Bcl-2 homology domain 3 (BH3) mimetics, targeting the antiapoptotic BCL-2 proteins. These drugs have been shown to induce myofibroblast apoptosis, thereby preventing and even reverting organ fibrosis in various experimental models (19–21). However, their translation to the clinical setting is far from becoming a reality, especially considering the pleiotropic activity of BCL-2 proteins in cell survival, with obvious side effects (3). Various other therapeutic strategies to inhibit myofibroblast function have been developed and tested in preclinical models, including kinase inhibitors (targeting RhoA kinase, extracellular signal–regulated kinases [ERKs], c-Jun N-terminal kinases [JNKs], platelet-derived growth factor receptor β [PDGFRβ], etc.), signaling pathway inhibitors (targeting TGF-β, Hedgehog, Notch, Wnt, endothelin-1, etc.), siRNAs, and microRNAs (22). Most of these proposed approaches have been developed based on in vitro experiments, while their therapeutic value in vivo and, more importantly, in patients, will require long preclinical and clinical experimentation.
The large gap between drug discovery and the effective implementation of new drug therapies in clinical settings warrants novel studies that take advantage of drugs that are already in development, on the market, or shelved because of lack of efficacy. Although drug repurposing typically occurs by accident, new technologies now enable the systematic evaluation of any drug on specific disease mechanisms.
Genetic screening has been used over the last several years to discover relevant pathways involved in myofibroblast activation (23–25). Here, we report the results of a high-content (HC), fluorescence-microscopy-based high-throughput screening (HTS), that led to the discovery of haloperidol, a common antipsychotic drug, as a potent inhibitor of myofibroblast activation. We showed that its mechanism of action involves binding to sigma receptor 1 (Sigmar1), modulation of intracellular calcium with moderate induction of endoplasmic reticulum (ER) stress response, eventually resulting in decreased expression of Notch1 and its targets, including αSMA. Importantly, the drug was also effective in 3 different mouse models of lung, cardiac, and tumor-associated fibrosis.
Results
Fibroblasts from different tissues are differentially prone to undergo myofibroblast differentiation. We compared the basal expression of αSMA, a typical marker for myofibroblast differentiation, in primary fibroblasts isolated from murine skin, lung, and heart. The purity of the fibroblast cultures is shown in Supplemental Figure 1; supplemental material available online with this article; https://doi.org/10.1172/jci.insight.123987DS1 The day after isolation and plating, αSMA mean cellular intensity was similar in all 3 cultures, while heart fibroblasts showed a lower number of αSMA+ cells than skin and lung fibroblasts (Supplemental Figure 2, A–C). We exposed cells to TGF-β for 3 days and observed a marked differentiation to myofibroblasts, as shown by the 80% increase in the number of αSMA+ cells in all conditions (Supplemental Figure 2, D and E). Mean αSMA intensity was also significantly increased in all cell types, with cardiac fibroblasts showing the best response, resulting in a 2-fold increase in αSMA expression (Supplemental Figure 2, D and F).
Besides responding to TGF-β, primary fibroblasts differentiate to myofibroblasts spontaneously in culture (26, 27), although at a slower rate. We took advantage of αSMA-RFP/COLL-EGFP transgenic mice, which simultaneously express red fluorescent protein (RFP) under the control of the αSMA promoter and enhanced green fluorescent protein (EGFP) under the control of the collagen α1(I) promoter (28). Fibroblasts from skin, lung, and heart of αSMA-RFP/COLL-EGFP mice were kept in culture for 9 days and both green and red fluorescence were monitored as surrogate markers for myofibroblast differentiation. Skin fibroblasts exhibited the highest response, showing a 6-fold increase in the αSMA expression already evident on day 5 and reaching a plateau over the following days, while lung fibroblasts underwent a more modest differentiation, reaching a 3-fold increase in αSMA expression at day 9 (Supplemental Figure 3, A–D). Cardiac fibroblasts exhibited an intermediate response, showing a progressive increase in αSMA expression, which peaked at day 9 and reached an almost 5-fold increase (Supplemental Figure 3, E and F).
Collectively, these results indicate that fibroblasts from various tissues are differentially prone to differentiate into myofibroblasts, both spontaneously and upon TGF-β stimulation. Because of their intermediate phenotype, we chose cardiac fibroblasts for our further HC-HTS studies aimed at identifying both positive and negative modulators of αSMA expression.
Modulators ofαSMA expression in myofibroblasts identified by HC-HTS. We performed HC-HTS in cardiac fibroblasts, using a library of 640 drugs approved by the FDA, categorized into 5 groups: cardiovascular agents, neuropsychiatric agents, antibiotics, antiinflammatory agents, and others (Figure 1A). Fibroblasts from adult αSMA-RFP/COLL-EGFP mice were seeded into 384-well plates (1200 cells/well), and 24 hours later each compound was spotted on top of the cells at the final concentration of 10 μM. After an additional 48 hours, the cells were fixed and nuclei stained with Hoechst 33342 (on average 375 cells were analyzed per experimental condition). Results of the screening for the 598 chemical compounds that did not decrease cell viability are reported in Figure 1B and Supplemental Table 1. The levels of αSMA expression were assessed by automated measurement of mean cell intensity in the red channel. Two independent replicates of the screening were performed (Pearson’s r = 0.474) and the Z score was calculated from the average of both replicates (Figure 1B). This screening identified 5 compounds that significantly decreased (Z score ≤ –1.96; P ≤ 0.05) and 12 compounds that significantly increased (Z score ≥ 1.96; P ≤ 0.05) αSMA expression. Representative images of the most effective compounds modulating αSMA expression are reported in Figure 1C.
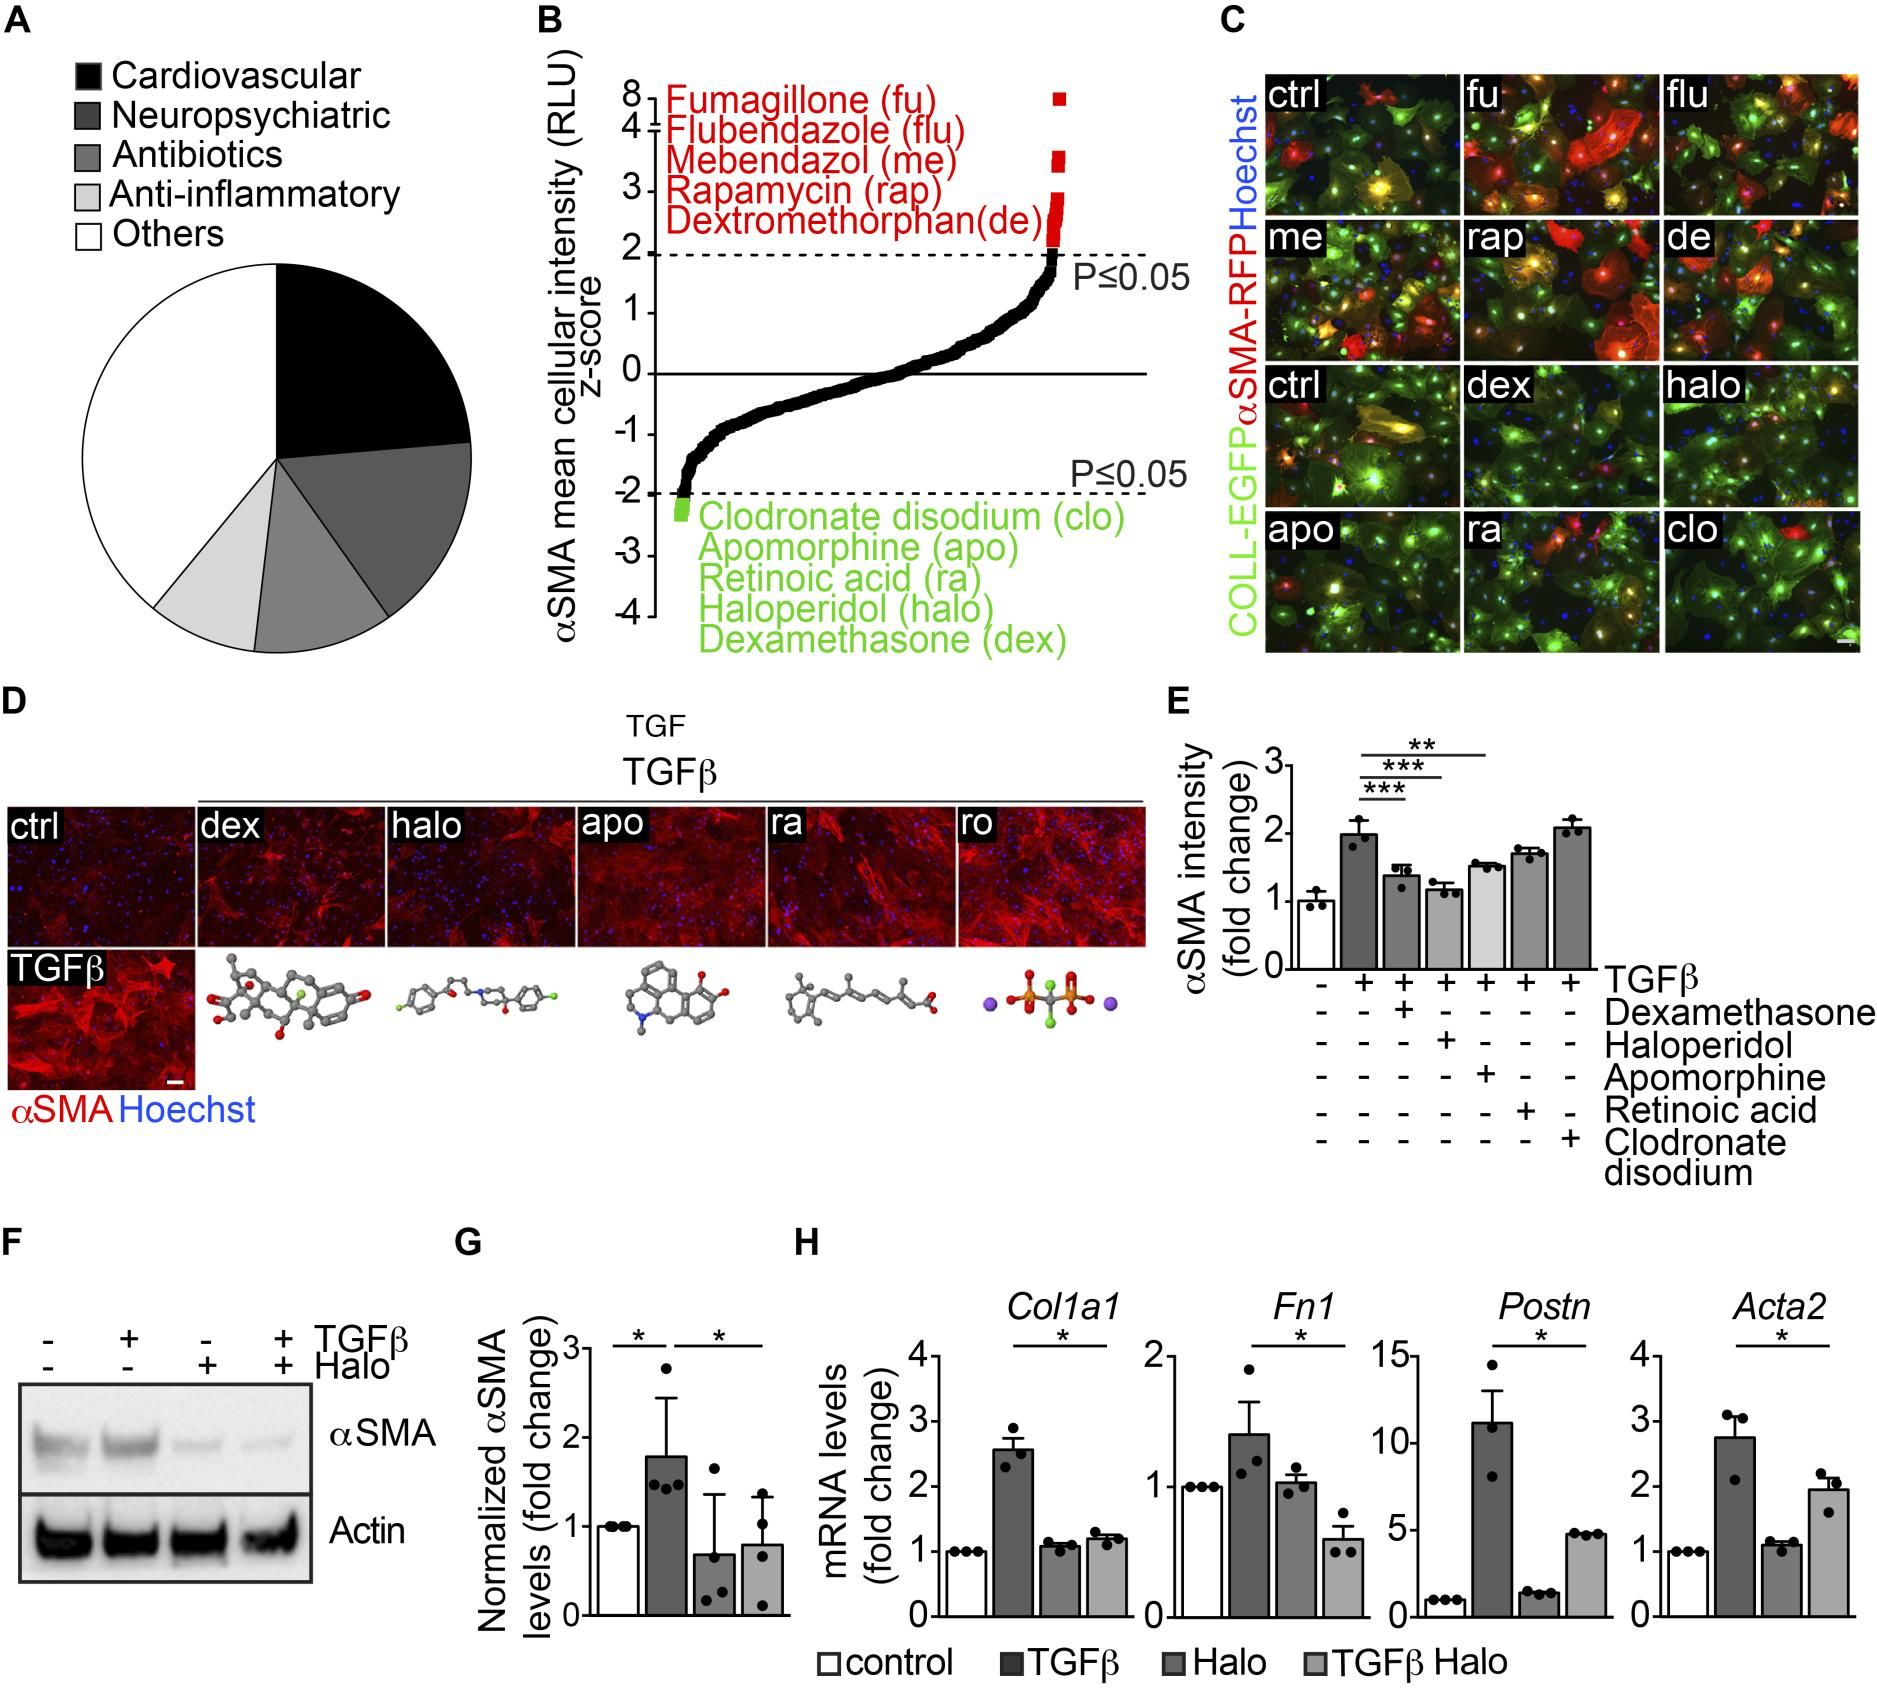
High-throughput screening identifies several modulators of αSMA expression in myofibroblasts.
(A) Pie chart showing the main categories of the 640 FDA-approved drugs included in the library. (B) Results of the high-throughput screening shown as the Zscore of the αSMA mean cellular intensity in αSMA-RFP/CoLL-EGFP fibroblasts, treated with each drug at 48 hours of culture. Top hits upregulating αSMA expression are indicated in red, whereas those downregulating αSMA expression are indicated in green. (C) Representative images of αSMA-RFP/COLL-EGFP fibroblasts exposed to the indicated drugs (abbreviations are explained in panel B). Green fluorescence indicates collagen expression (COLL-EGFP), whereas red fluorescence indicates αSMA expression (αSMA-RFP). Nuclei are stained blue with Hoechst. (D) Cardiac fibroblasts treated with TGF-β alone and in combination with various drugs, stained red with anti-αSMA antibodies. Nuclei are stained blue with Hoechst. The chemical structure of each drug is shown under the corresponding cell picture. Atom color assignment: gray, carbon; red, oxygen; green, halogen; blue, nitrogen; orange, phosphorus; purple, sodium. (E) Quantification of the αSMA mean fluorescence intensity upon treatment with TGF-β alone and in combination with the indicated drugs (n = 3/gp). (F) Western blot showing the expression of αSMA in primary cardiac fibroblasts treated with TGF-β, haloperidol (3 μM), or their combination. Actin is shown as loading control. (G) Quantification of αSMA levels in primary cardiac fibroblasts treated with TGF-β, haloperidol (3 μM), and their combination (n = 4/gp). (H) Expression levels of Col1a1, Fn1, Postn, and Acta2 upon treatment with TGF-β, haloperidol, and their combination (n = 3/gp). Values in E, G, and H are mean ± SEM. *P < 0.05, **P < 0.01, ***P < 0.001 by unpaired t test with Welch’s correction. Scale bars in C and D: 50 μm.
Next, we individually validated the 5 hits that inhibited αSMA expression (dexamethasone, haloperidol, apomorphine, retinoic acid, and clodronate disodium) on cardiac fibroblasts from CD1 mice by staining for αSMA with specific antibodies (Figure 1D). As expected, TGF-β upregulated αSMA expression (>2-fold increase), whereas all the tested drugs reduced TGF-β–induced αSMA levels, with the most potent effect exerted by dexamethasone and haloperidol (Figure 1, D and E). Dexamethasone is one of the most common corticosteroid drugs, which are currently being considered to reduce the inflammatory burden in various fibrotic diseases (29–31), thereby confirming the successful setup of the screen. However, as mentioned above, the clinical use of these drugs is fraught with major side effects, including osteoporosis, hypertension, diabetes, and weight gain. Therefore, we focused our interest on the second-most-potent drug, haloperidol (4-[4-(4-chlorophenyl)-4-hydroxy-1-piperidyl]-1-[4-fluorophenyl]-butan-1-on).
Fibroblasts from different tissues respond to haloperidol in a similar manner. To determine the lowest effective concentration of haloperidol able to downregulate αSMA levels, we measured cell viability in a dose-dependency test on cardiac fibroblasts. Supplemental Figure 4A shows the dose-response curve for viability, with a half maximal inhibitory concentration (IC50) value of 2.93 μg/ml, corresponding to a 7.8 μM concentration. Next, we tested 4 different haloperidol doses, selected in the nontoxic range (<7.8 μM), for their ability to reduce αSMA expression upon TGF-β treatment. As shown in Supplemental Figure 4, B and C, there was an inverse relationship between the dose of haloperidol and the intensity of αSMA expression, which reached its minimum level at 3 μM. No further decrease in αSMA expression was seen at 6 μM. Therefore, we selected the 3-μM dose for the subsequent experiments, in line with previous studies showing an effect of haloperidol on fibroblast proliferation (32). This dose resulted in a marked inhibition of TGF-β–induced overexpression of αSMA, as detected by Western blotting (Figure 1, F and G) and quantitative PCR (Acta2), as well as of other markers associated with myofibroblast activation, including collagen 1A1 (Col1a1), fibronectin 1 (Fn1), and periostin (Postn) (Figure 1H). We then checked whether haloperidol exerted a similar activity in fibroblasts derived from skin and lung and found that in both cases TGF-β treatment resulted in the upregulation of αSMA, which was significantly reduced by treatment with haloperidol (Supplemental Figure 4, D–G).
Consistent with previous studies (33), we observed that TGF-β exerted a mitogenic activity on primary cardiac fibroblasts, as evidenced by their increased cell number and percentage of Ki-67+ cells (Figure 2, A–C). Haloperidol effectively inhibited these effects, reverting both parameters back to basal levels (Figure 2, A–C). Next, we investigated the effect of haloperidol on fibroblast migratory ability using a scratch-wound assay. We found that TGF-β accelerated, whereas haloperidol impaired, wound closure (Figure 2, D and E). Finally, we performed a collagen gel contraction assay to measure the force generated by myofibroblasts, resulting in the contraction of the collagen matrix. As expected, TGF-β clearly promoted gel contraction, while the cotreatment with haloperidol markedly inhibited this effect (Figure 2, F and G). Collectively, these data indicate that haloperidol inhibits multiple TGF-β–induced features typical of activated myofibroblasts, reverting them back to a quiescent phenotype.
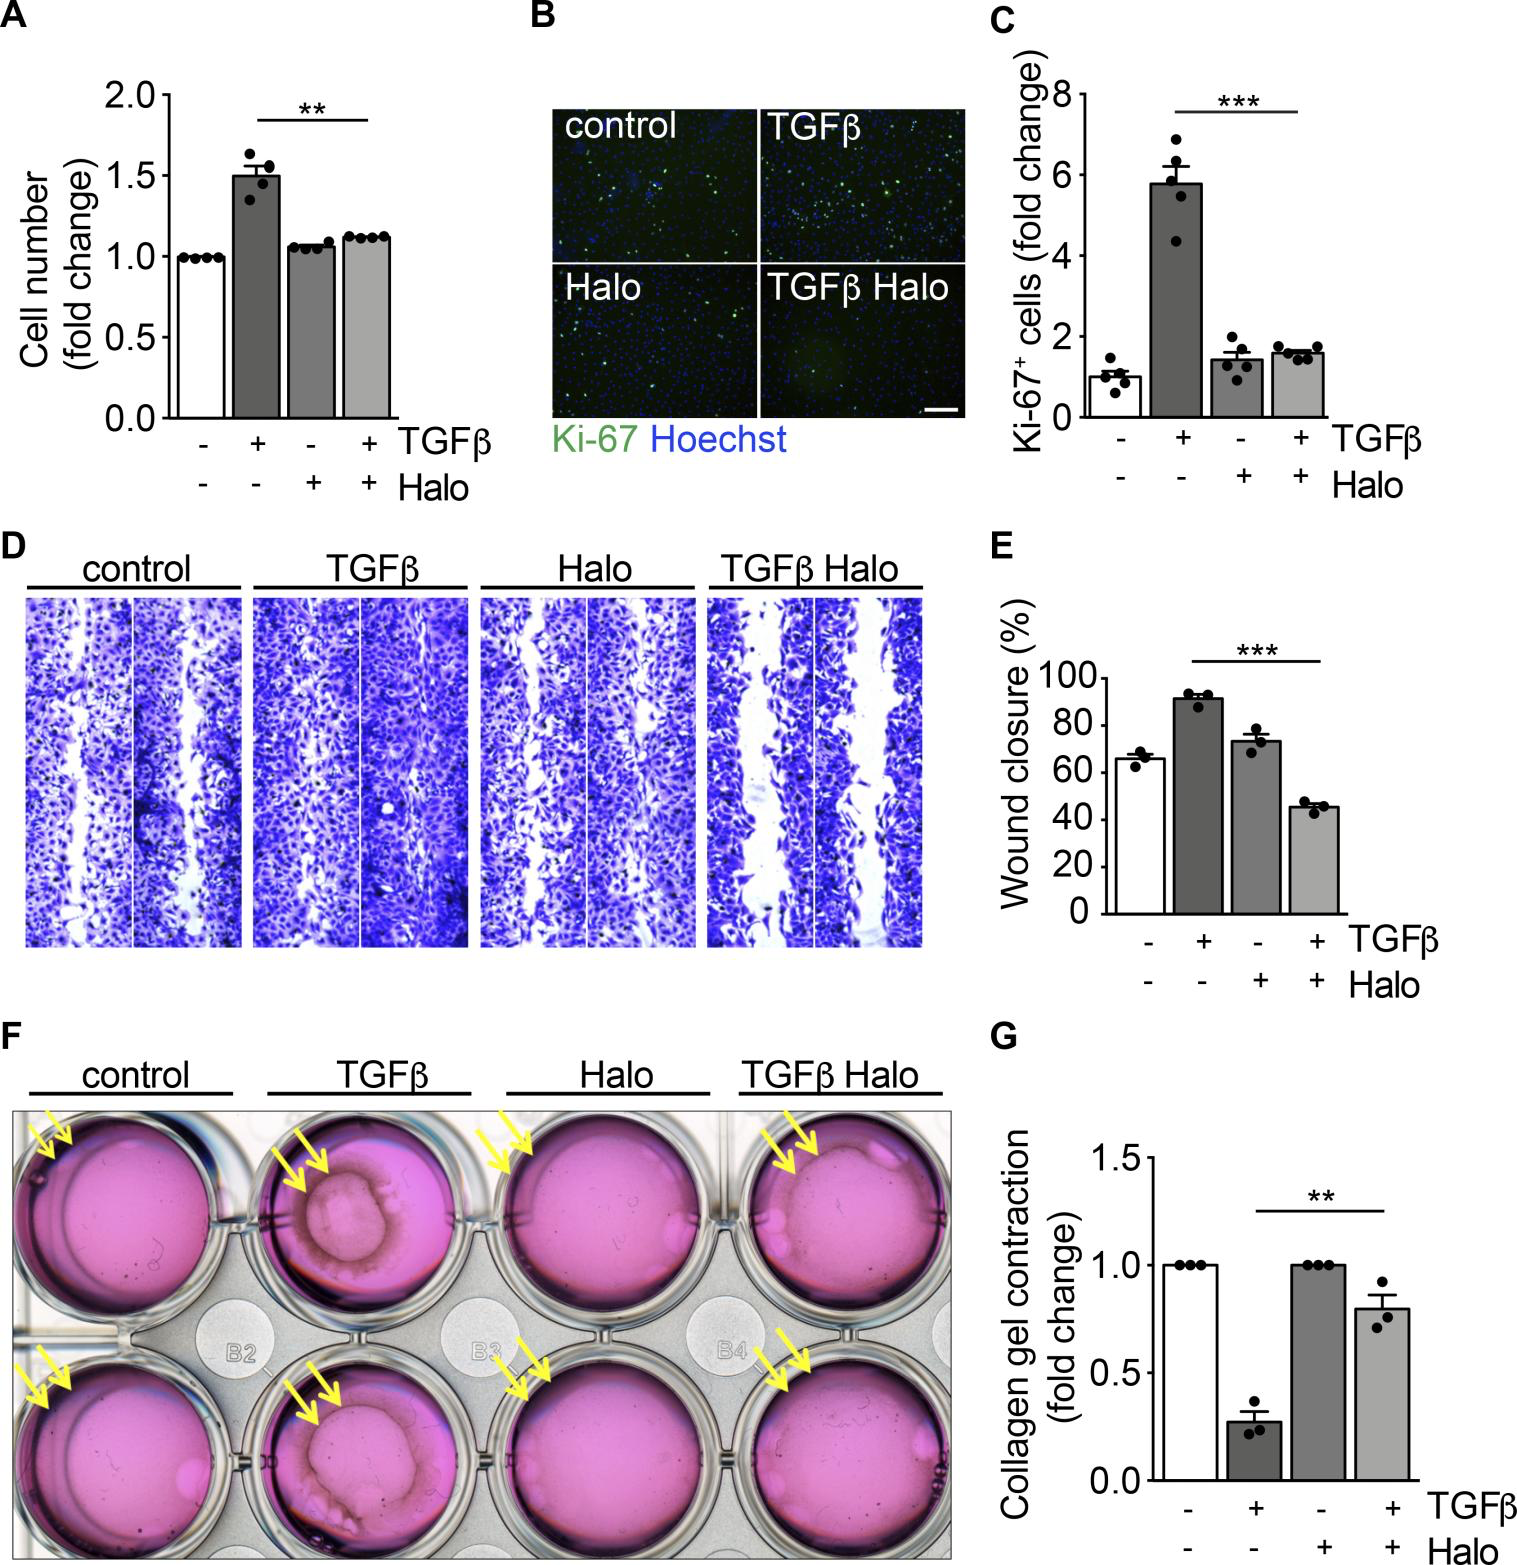
Haloperidol inhibits myofibroblast proliferation, migration, and contraction.
(A) Quantification of cardiac fibroblast growth upon treatment with TGF-β, haloperidol, and their combination for 72 hours (n = 4/gp). (B) Representative images of Ki-67 immunofluorescence in primary cardiac fibroblasts treated with TGF-β, haloperidol, and their combination for 72 hours. Nuclei are stained blue with Hoechst. Scale bar: 50 μm. (C) Quantification of Ki-67+ cells in cardiac fibroblasts treated with TGF-β, haloperidol, or their combination for 72 hours (n = 5/gp). (D) Representative images of scratch-wound assay using primary cardiac fibroblasts treated with TGF-β, haloperidol, and their combination and stained with crystal violet. (E) Quantification of wound closure by primary cardiac fibroblasts treated with TGF-β, haloperidol, or their combination at 24 hours (n = 3/gp). (F) Representative images of collagen gel contraction by embedded cardiac fibroblasts treated with TGF-β, haloperidol, and their combination. (G) Quantification of gel contraction by primary cardiac fibroblasts treated with TGF-β, haloperidol, or their combination at 24 hours (n = 3/gp). Values in A, C, E, and G are mean ± SEM. **P < 0.01, ***P < 0.001 by unpaired t test with Welch’s correction.
Sigmar1 is the mediator of haloperidol activity in fibroblasts. Haloperidol is effectively used in clinics as a potent antipsychotic drug, blocking the dopamine D2 receptor (DRD2) in the central nervous system (34, 35). Therefore, we checked the expression of DRD2 in primary fibroblasts from murine skin, lung, and heart and compared it to that in the SH-SY5Y neuronal cell line. None of these fibroblast types expressed the receptor, whereas it was abundantly expressed by the neuronal cells, as expected (Figure 3A). Interestingly, haloperidol also binds and antagonizes the activity of Sigmar1, which is reported to be expressed by a variety of cell types (36). Consistently, we found it abundantly expressed by skin, lung, and heart fibroblasts at both mRNA and protein levels (Figure 3, A and B). Interestingly, haloperidol was able to upregulate its own receptor, Sigmar1, in cardiac, skin, kidney, and lung fibroblasts (Figure 3C and Supplemental Figure 5).
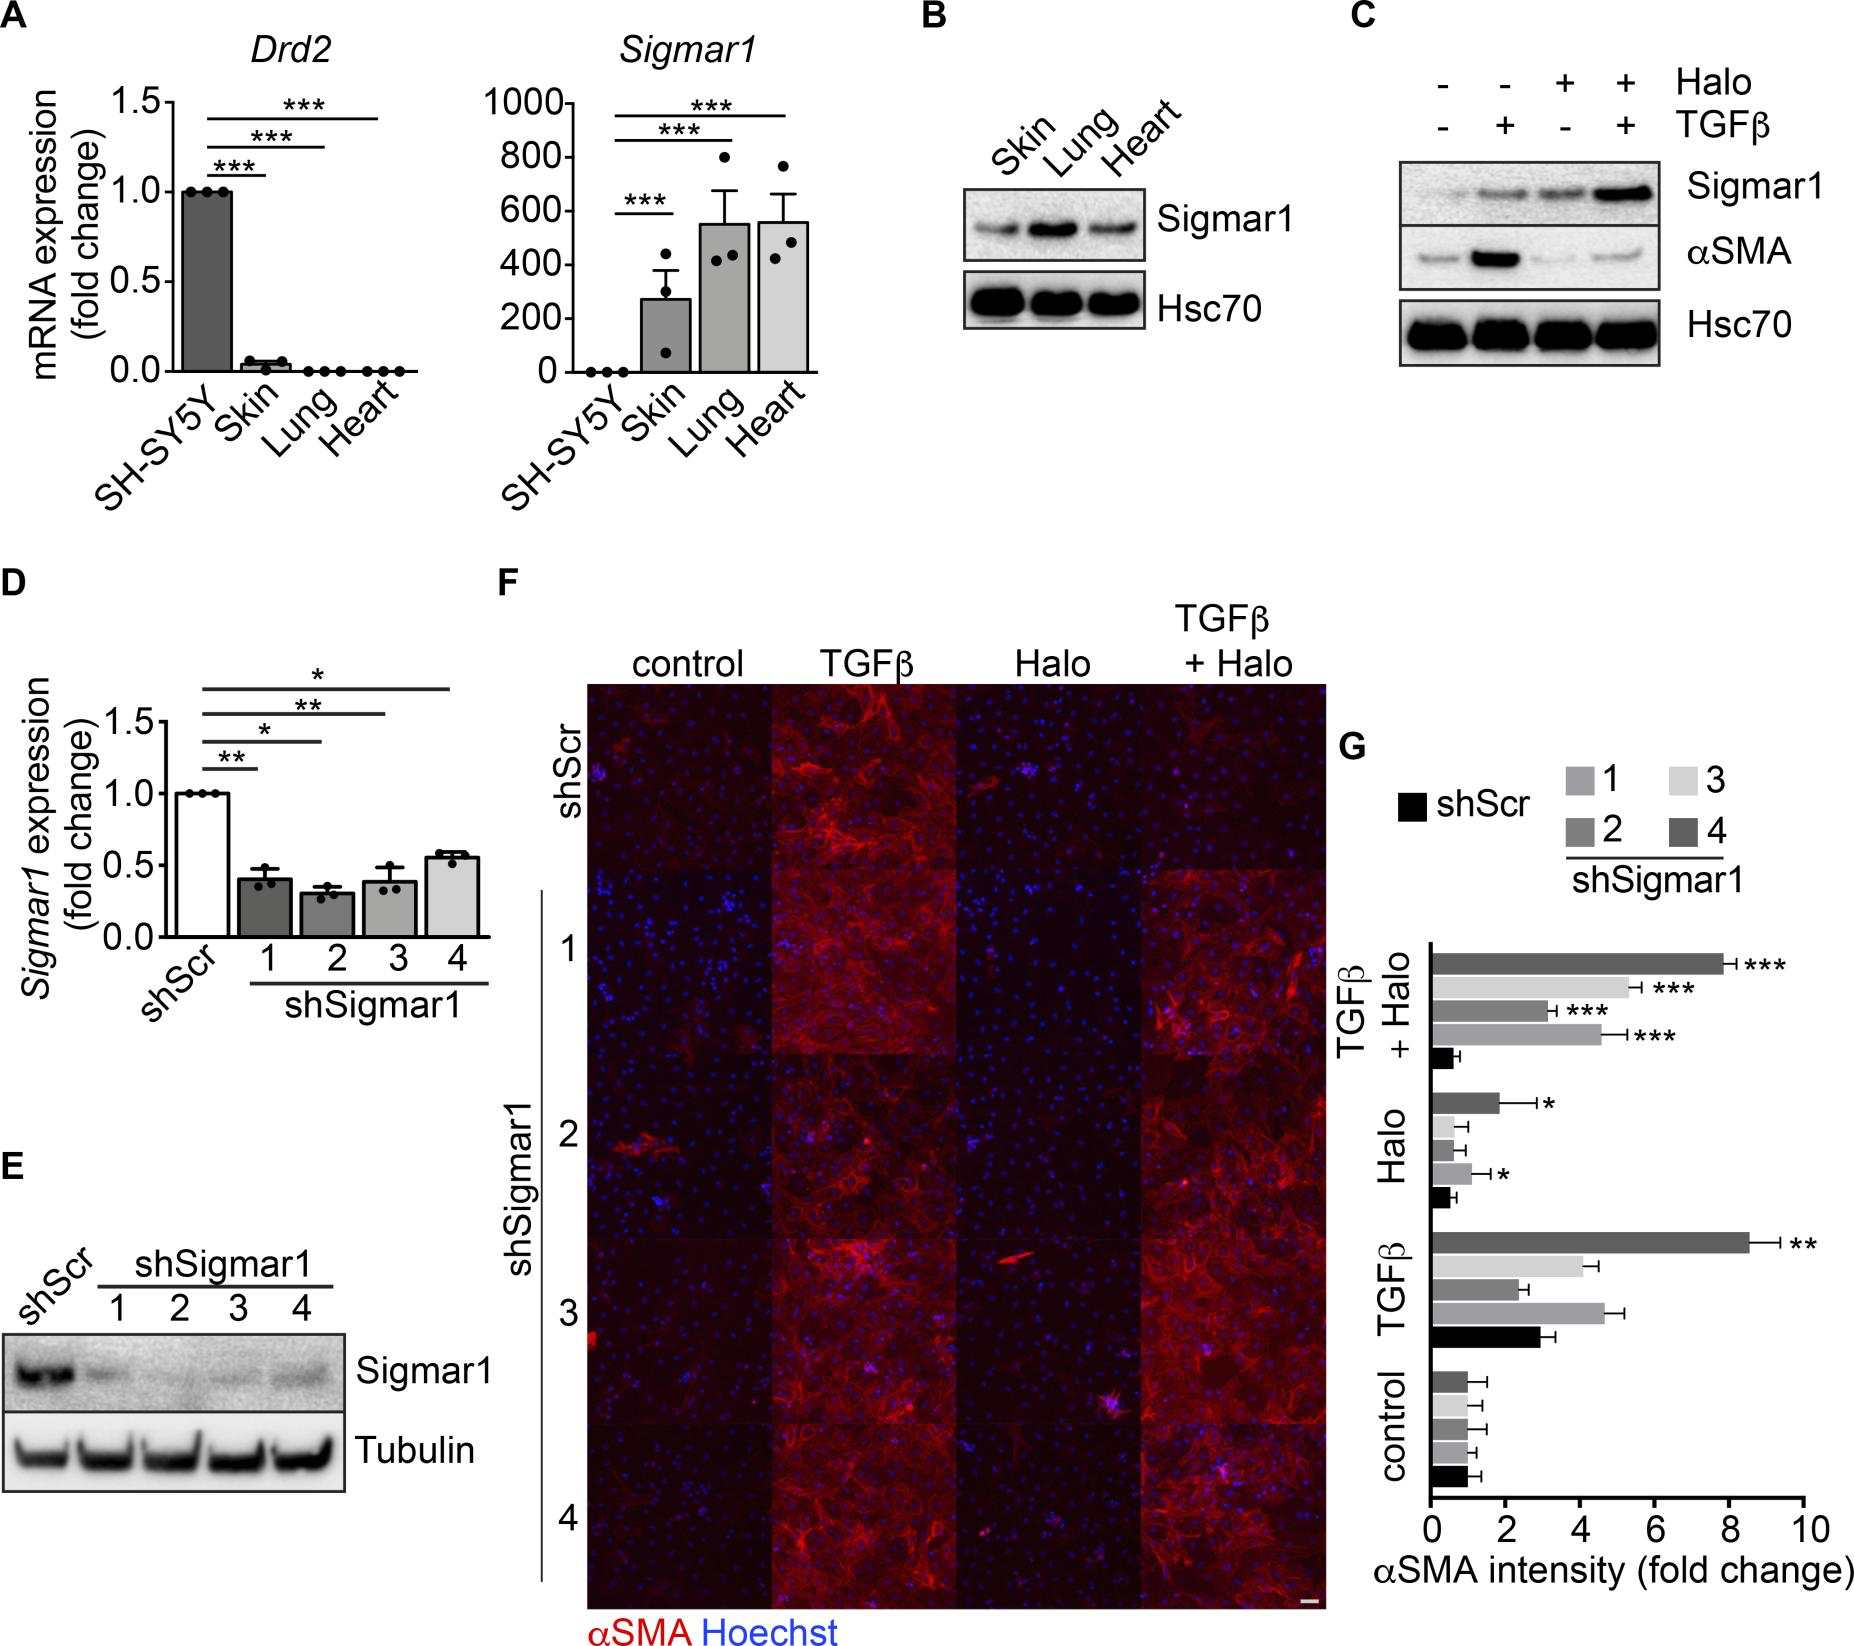
Sigmar1 mediates haloperidol activity in fibroblasts.
(A) Relative mRNA expression of dopamine receptor D2 (Drd2) and sigma receptor 1 (Sigmar1) in SH-SY5Y neuronal cells, skin, lung, and heart fibroblasts (n = 3/gp). (B) Western blot for Sigmar1 in skin, lung and cardiac fibroblasts. Hsc70 is shown as loading control run in parallel with Sigmar1. (C) Western blot showing the expression of αSMA and Sigmar1 in cardiac fibroblasts upon treatment with TGF-β, haloperidol, or their combination. Hsc70 is shown as loading control run in parallel. (D) Quantitative real-time PCR showing the level of Sigmar1 expression upon delivery of 4 specific shRNAs (shSigmar1–4) in primary adult cardiac fibroblasts (n = 3/gp). A scrambled sequence of shSigmar1-1 was used as a control. (E) Western blot showing the expression level of Sigmar1 upon delivery of 4 specific shRNAs (shSigmar1–4) in primary adult cardiac fibroblasts, using the scrambled sequence of shSigmar1-1 as a control. Tubulin is used as loading control. (F) Representative images of αSMA staining (red) in cardiac fibroblasts upon Sigmar1 silencing using the 4 shRNAs and treatment with TGF-β, haloperidol, or their combination. Nuclei are stained blue with Hoechst. Scale bar: 100 μm. (G) Quantification of αSMA mean intensity in cardiac fibroblasts upon Sigmar1 silencing using the 4 shRNAs and treatment with TGF-β, haloperidol, or their combination (n = 3/gp). Values in A, D, and G are mean ± SEM. *P < 0.05, **P < 0.01, ***P < 0.001 (relative to control in J) by unpaired t test with Welch’s correction.
The crystal structure of Sigmar1 was recently reported in combination with its ligands, N-(1-benzylpiperidin-4-yl)-4-iodobenzamide (PD 144418), 3-(4-methylphenyl)-5-(1-propyl-3,6-dihydro-2H-pyridin-5-yl)-1,2-oxazole, and N-(1-benzylpiperidin-4-yl)-4-iodobenzamide (4-IBP) (37). Both structures (5HK1 and 5HK2) revealed a trimeric architecture for Sigmar1, in which ligands bound to the same hydrophobic cavity. Therefore, we hypothesized that haloperidol may also bind to this region. To test this hypothesis, we performed a screening of the receptor surface to identify druggable binding sites in the deposited structures. In both cases, the first 3 high-ranked binding sites corresponded to the 3 hydrophobic cavities in each monomer, confirming our hypothesis (see Supplemental Table 2). Despite the similar binding mode of the ligands (Supplemental Figure 6A) and the equivalent geometry of the binding sites in each monomer, we could identify significant differences in binding residues, size, and druggability of each site (Supplemental Figure 6B). Three different configurations of haloperidol were considered at pH 7.0 ± 2, labeled as A, B, and C (Supplemental Figure 6C). These were docked on each of the 6 identified binding cavities (Supplemental Figure 6D). In each binding site the highest- and the lowest-ranked haloperidol conformations, according to both Glide Score and Emodel score (38, 39), are A and C, respectively (Supplemental Table 3). In its highest-ranked binding pose, haloperidol forms interactions with almost all the residues of the binding cavity (Supplemental Figure 6E and Supplemental Table 4), in agreement with those reported by Yano et al. (40).
To demonstrate that Sigmar1 is the receptor mediating the inhibitory effect of haloperidol on αSMA expression, we silenced its expression using 4 different short hairpin RNAs (shRNAs), using a scrambled sequence of the first shSigmar1 as a control. All shRNAs effectively reduced the levels of Sigmar1 expression in cardiac fibroblasts at both the mRNA and protein level (Figure 3, D and E) as well as in the NIH3T3 fibroblast cell line (Supplemental Figure 7A). As expected, the control scramble shRNA did not affect the activity of haloperidol. In contrast, silencing of Sigmar1 potently inhibited the ability of haloperidol to reduce the expression of αSMA upon treatment with TGF-β, indicating that Sigmar1 is required by haloperidol to inhibit myofibroblast activation (Figure 3, F and G, and Supplemental Figure 7, B and C).
Modulation ofαSMA expression by haloperidol involves an increase in intracellular calcium, mild ER stress, and eventual downregulation of the Notch pathway. TGF-β signaling is the main driver of fibrosis in most, if not all, organs, via activation of both canonical (Smad-dependent) and noncanonical pathways. To determine whether the effect of haloperidol impinges on either of these pathways, we first performed a CAGA-Luc reporter assay, in which luciferase expression is induced upon binding of Smad2/3 to the CAGA box. As shown in Figure 4A, TGF-β resulted in an almost 30-fold increase in reporter activity, which was not reduced by haloperidol. This was a first indication that haloperidol acts independently of the TGF-β canonical pathway. In addition, we tested the subcellular localization of SMAD2/3, which translocates to the nucleus upon TGF-β stimulation. As shown in Figure 4, B and C, haloperidol did not affect this translocation, again ruling out an effect of this drug on the TGF-β canonical pathway. Finally, we tested the phosphorylation of SMAD2 upon haloperidol treatment and again found that haloperidol did not significantly change the levels of TGF-β–induced p-SMAD2 in either cardiac fibroblasts or NIH3T3 cells (Figure 4D). Collectively, these data imply that haloperidol does not act through the canonical TGF-β pathway.
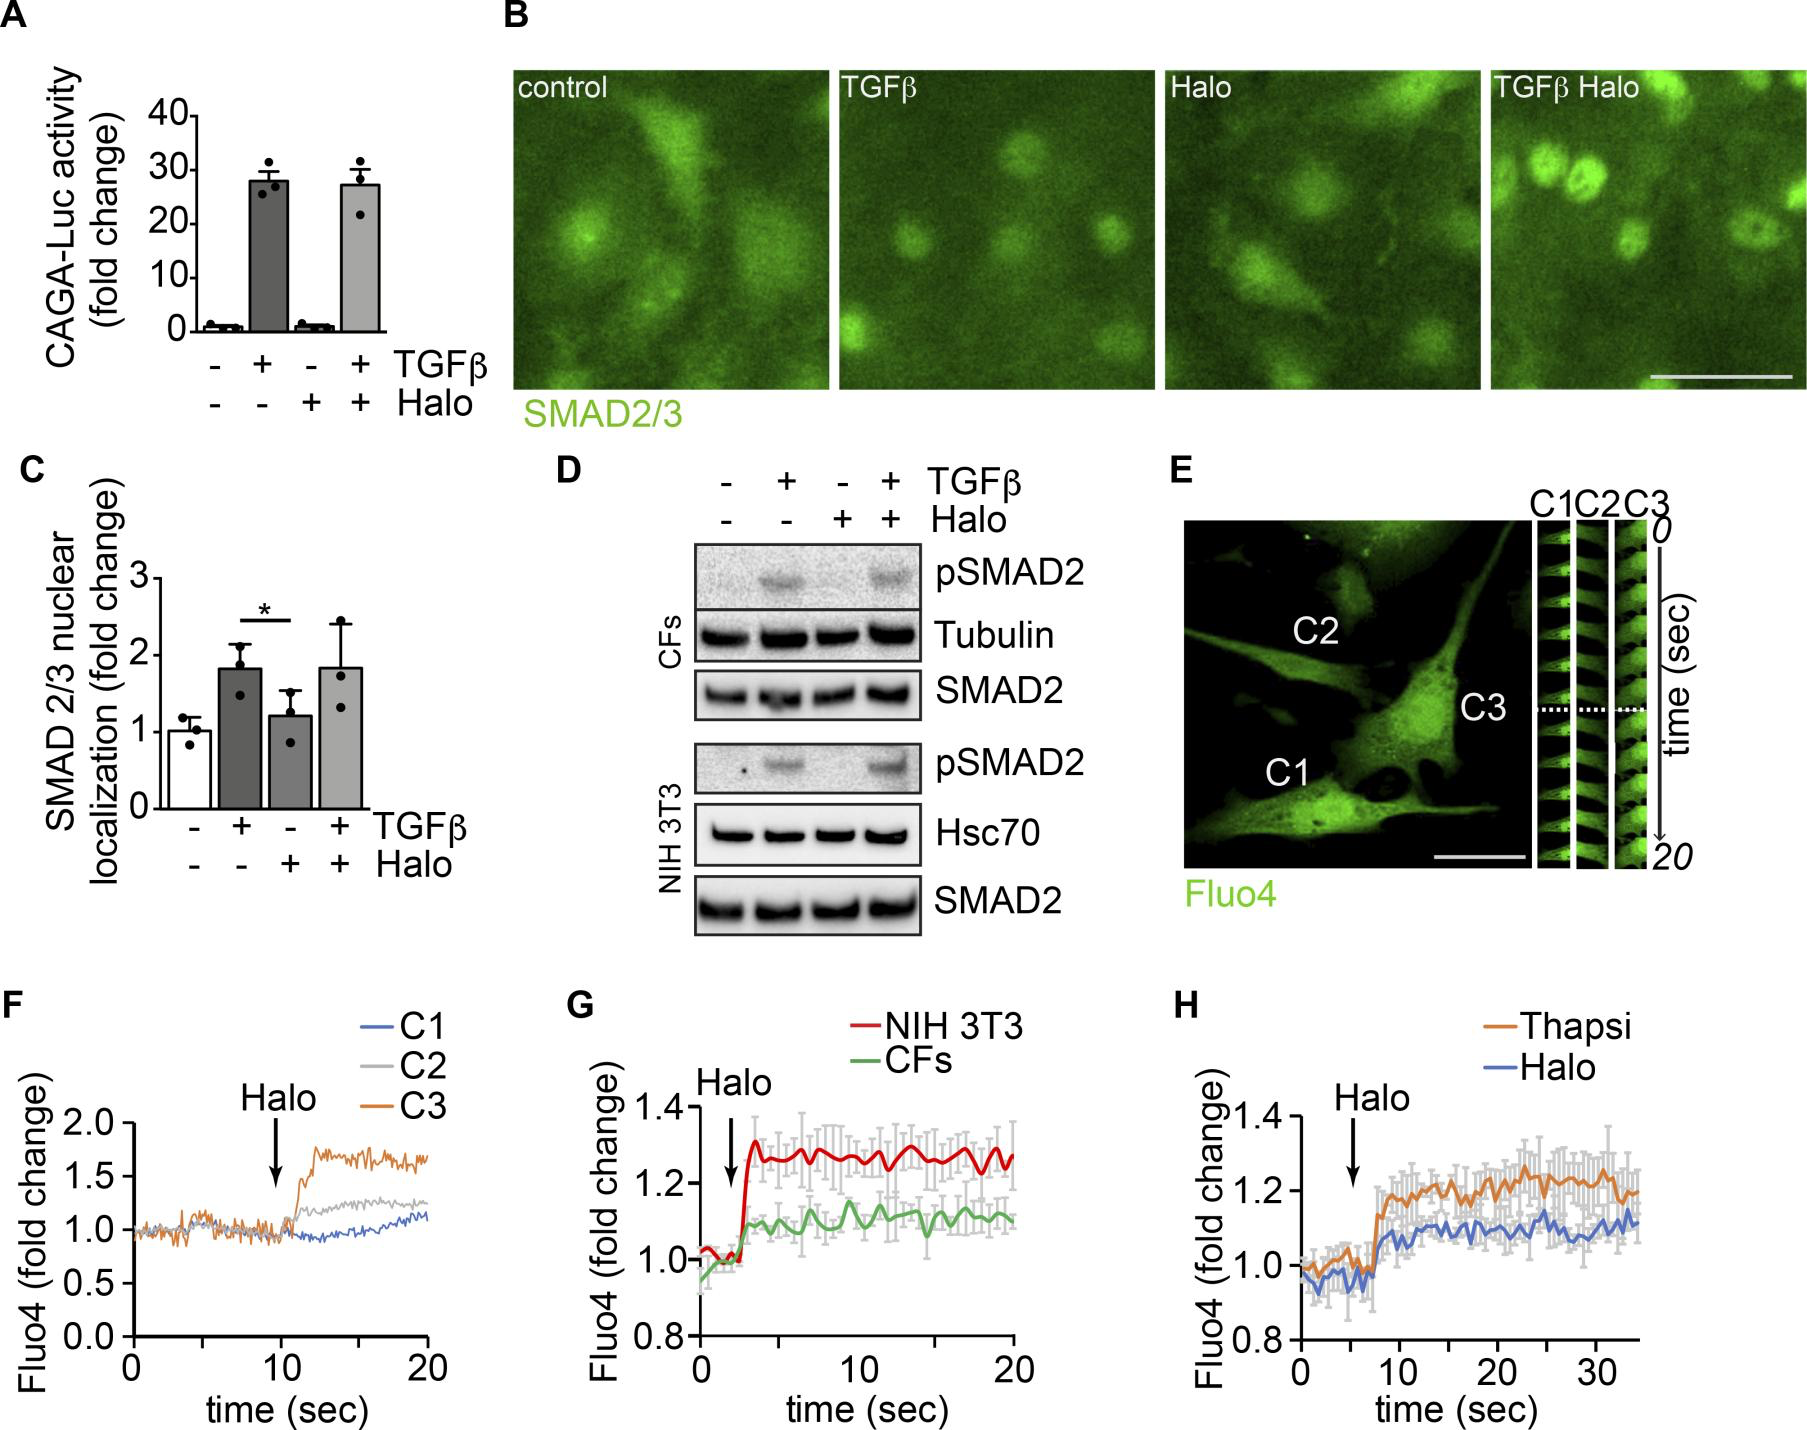
Modulation of αSMA expression by haloperidol involves an increase in intracellular calcium.
(A) Luciferase activity of TGF-β–responsive CAGA-Luc reporter upon treatment with TGF-β, haloperidol, or their combination for 48 hours (n = 3/gp). (B) Representative images of SMAD 2/3 immunofluorescence in primary cardiac fibroblasts treated with TGF-β, haloperidol, or their combination. (C) Quantification of the nuclear/cytosolic localization of SMAD2/3 in cardiac fibroblasts treated with TGF-β, haloperidol, or their combination (n = 3/gp). (D) Western blot showing the expression level of the phosphorylated form of SMAD2 and loading controls (tubulin and Hsc70) upon treatment with TGF-β, haloperidol, or their combination in primary cardiac fibroblasts (CFs) and NIH3T3 cells. Total amount of SMAD2 is shown from a blot run in parallel. (E) Representative images of cardiac fibroblasts loaded with the calcium sensitive dye Fluo4. Time-lapse images of specific regions of interest (ROIs) in 3 different cells (C1, C2, and C3) are shown on the right. The dashed line indicates the time of haloperidol treatment. (F) Quantification of mean fluorescence intensity in each ROI (C1 in blue, C2 in gray, and C3 in orange) upon addition of haloperidol at the time indicated by the arrow. (G) Quantification of Fluo4 fluorescence intensity in NIH3T3 cells (red line) and primary cardiac fibroblasts (CFs, green line) over time. Addition of haloperidol is indicated by the arrow. (H) Quantification of whole-cell Fluo4 fluorescence intensity in primary cardiac fibroblasts treated with either haloperidol (blue line) or thapsigargin (orange line), at the time indicated by the arrow. Scale bars in B and E: 50 μm. Values in A and C are mean ± SEM. *P < 0.05 by unpaired t test.
Because previous reports showed that haloperidol regulates intracellular calcium levels via Sigmar1 in neuronal and epithelial cells (41, 42), we assessed whether haloperidol also induced any variation in cytosolic calcium in fibroblasts. Live imaging of Fluo4-labeled single cells indicated that haloperidol rapidly increased the intracellular levels of calcium (Figure 4, E and F, and Supplemental Video 1). Similar results were obtained when Fluo4 fluorescence was measured in a plate-based assay both in cardiac fibroblasts and NIH3T3 cells (Figure 4G). The role of Sigmar1 in mediating this change in intracellular calcium levels was confirmed by performing the Fluo4 fluorescence assay in cardiac fibroblasts stably expressing the 4 shRNAs targeting Sigmar1. As shown in Supplemental Figure 8, Sigmar1 silencing reduced the increase in intracellular calcium observed upon haloperidol treatment. The curve showing intracellular calcium levels upon haloperidol administration imitated the one obtained by the treatment of the same cells with thapsigargin, an inhibitor of the calcium pump SERCA and inducer of ER stress (43, 44), as shown in Figure 4H.
Thus, we tested whether haloperidol, like thapsigargin, was able to induce ER stress in primary fibroblasts. First, we observed that haloperidol upregulated the ER chaperone calreticulin, a marker of ER stress (45), although to a lesser extent than either thapsigargin or tunicamycin (Figure 5, A and B). Next, we determined the expression levels of additional ER stress–related genes, again using thapsigargin and tunicamycin as positive controls. Haloperidol upregulated the expression of Atf3, Atf4, Fkbp11, and Ppp1r15a/Gadd34 at the mRNA level (Supplemental Figure 9A). Ddit3/Chop mRNA was not upregulated at the initial dose tested (3 μM), but it increased at a higher concentration (6 μM, Supplemental Figure 9B). A similar ER stress response was induced by haloperidol in primary lung fibroblasts (Supplemental Figure 9C). We also checked the protein levels of PKR-like ER kinase (Perk) and found a substantial increase upon treatment with haloperidol (Figure 5C), in line with previous reports showing the same response in other cell types (46). To confirm the activation of the ER stress pathway, we assessed the levels of phosphorylated forms of both PERK and the eukaryotic translation initiation factor 2A (eIF2α) early after haloperidol administration. As shown in Figure 5, D and E, haloperidol increased the phosphorylation of both ER stress mediators. Finally, we demonstrated that PERK is necessary for haloperidol activity by its silencing using a specific siRNA pool, able to significantly decrease PERK protein levels. Haloperidol failed to downregulate αSMA in PERK-silenced fibroblasts (Figure 5, F and G). Overall, these data indicate that haloperidol induces a mild ER stress response in fibroblasts and that PERK is necessary for this effect.
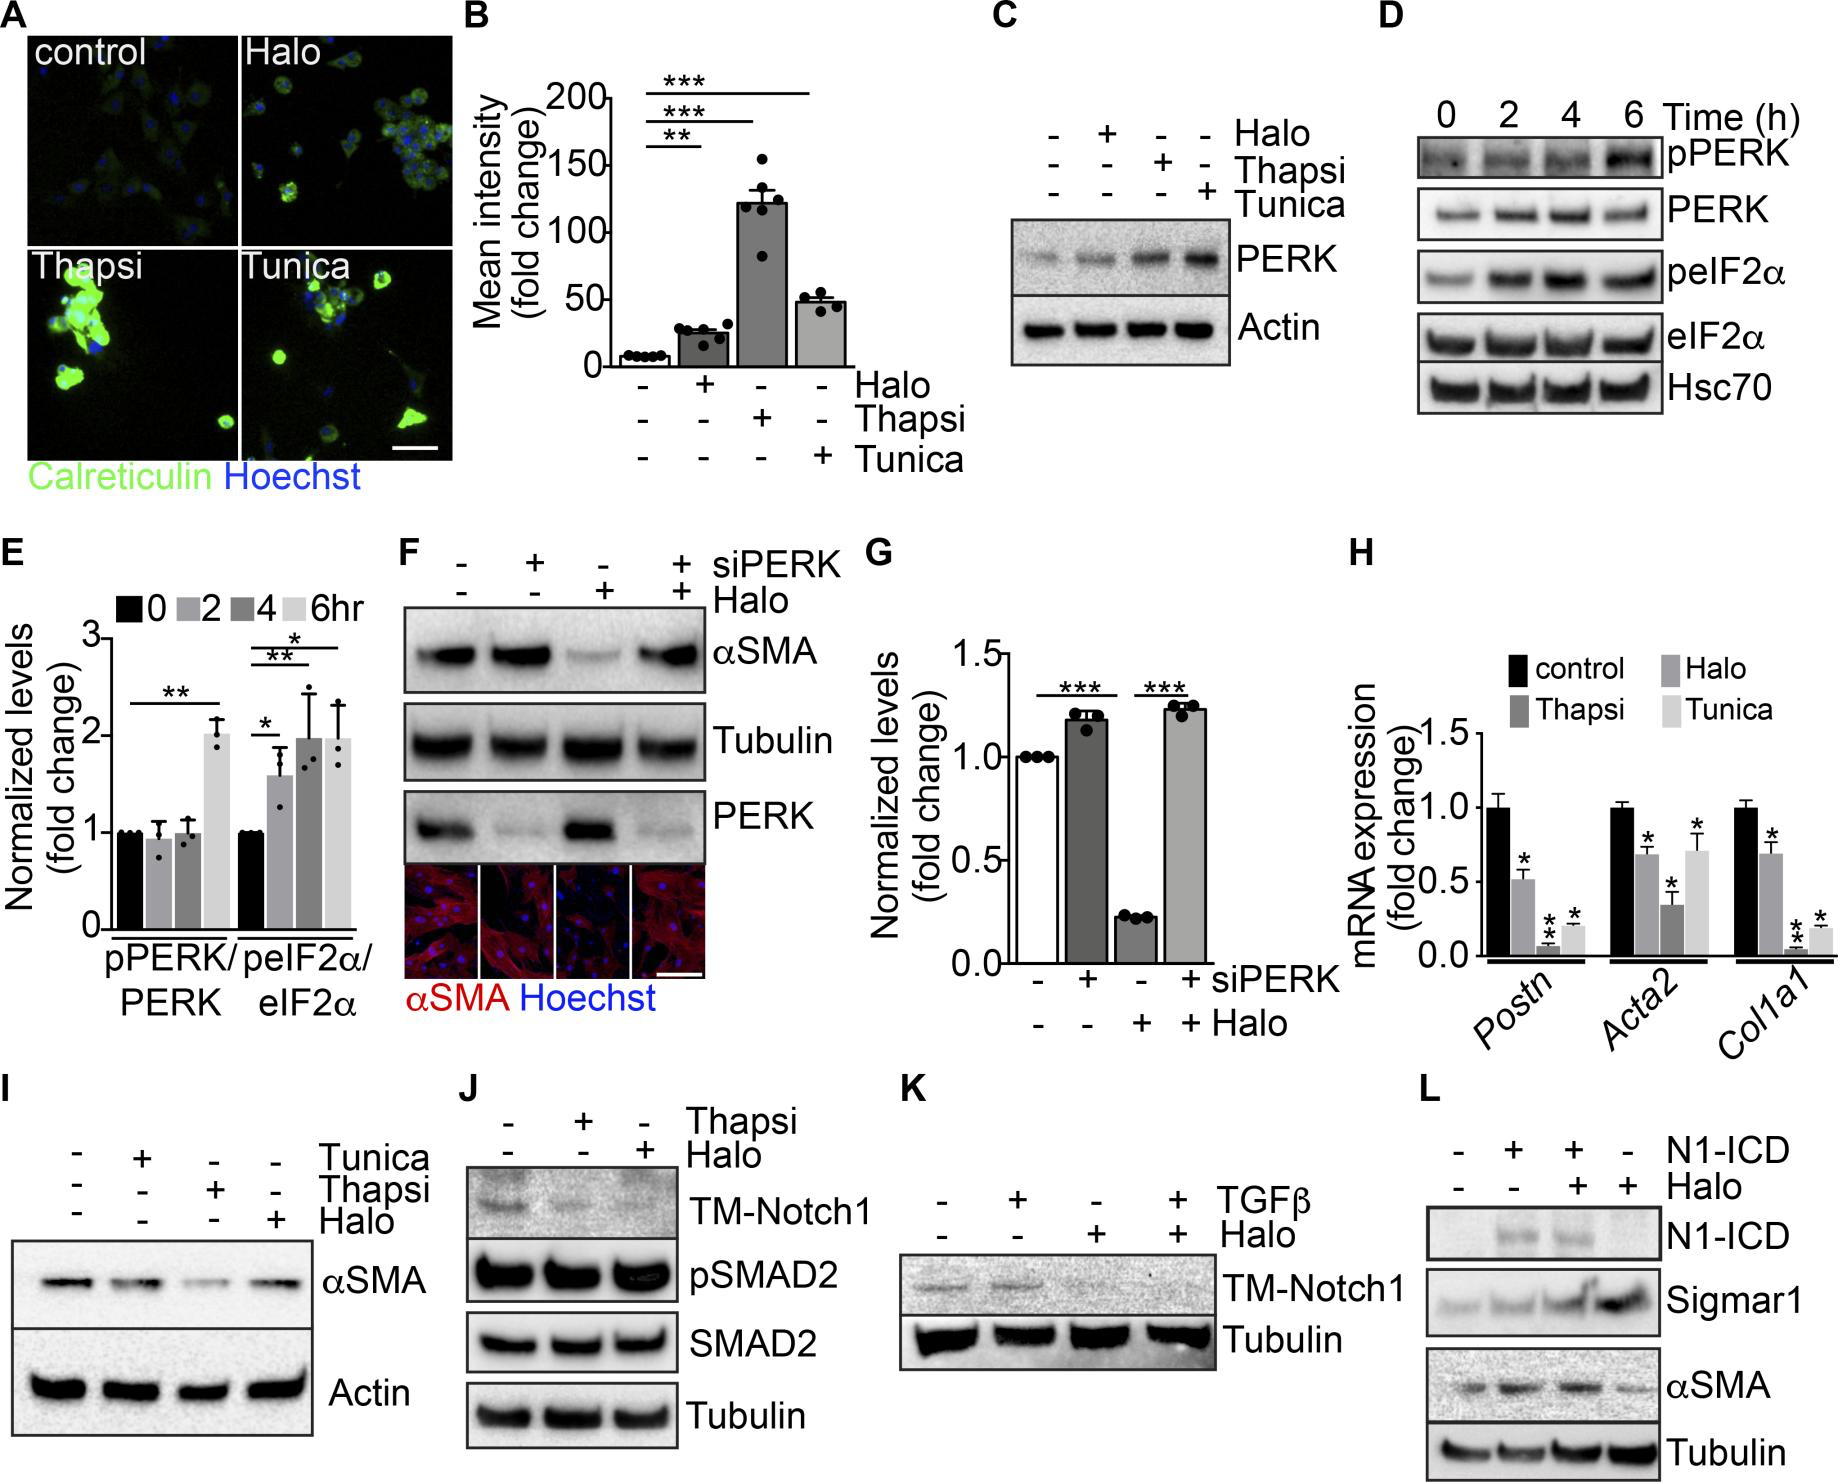
Modulation of ER stress and Notch pathway by haloperidol.
(A) Representative images of cardiac fibroblasts stained for calreticulin (green) and treated with haloperidol (Halo), thapsigargin (Thapsi) and tunicamycin (Tunica). Nuclei are stained blue with Hoechst. (B) Quantification of cytosolic calreticulin (n = 5/gp). (C) Western blot for PERK in cardiac fibroblasts treated with haloperidol, thapsigargin, or tunicamycin for 48 hours. Loading control: actin. (D) Western blot for PERK, eIF2α, and their phosphorylated forms (p-PERK and p-eIF2α) in cardiac fibroblasts at the indicated time points after treatment with haloperidol. Hsc70: additional loading control. The 3 blots were run in parallel. (E) Quantification of p-PERK/PERK and p-eIF2α/eIF2α ratios in cardiac fibroblasts at the indicated time points after treatment with haloperidol (n = 3/gp). (F) Western blot for αSMA and PERK in cardiac fibroblasts treated with haloperidol, siPERK, or their combination. Loading control: tubulin. The 3 blots were run in parallel. Lower panels show representative immunofluorescence for αSMA (red). Nuclei are stained blue with Hoechst. (G) Quantification of αSMA levels in cardiac fibroblasts treated with siPERK, haloperidol, or their combination (n = 3/gp). (H) Levels of mRNA expression of Postn, Acta2, and Col1a1after treatment with haloperidol, thapsigargin, or tunicamycin (n = 3/gp). (I) Western blot for αSMA upon treatment of cardiac fibroblasts with haloperidol, thapsigargin, or tunicamycin. Loading control: actin. (J) Western blot for the transmembrane form of Notch1 (TM-Notch1), SMAD2 and its phosphorylated form (p-SMAD2) in cardiac fibroblasts treated with either haloperidol or thapsigargin. Loading control: tubulin. The 3 blots were run in parallel. (K) Western blot for TM-Notch1 upon treatment of cardiac fibroblasts with TGF-β, haloperidol, or their combination. Loading control: tubulin. (L) Western blot for the intracellular form of Notch1 (Notch1-ICD), αSMA, and Sigmar1 upon transfection of a constitutively active form of Notch1 (N1ICD) either alone or in combination with haloperidol. Loading control: tubulin. The 3 blots were run in parallel. Scale bars in A and H: 50 μm. Values in B, E, G, and H are mean ± SEM. *P < 0.05, **P < 0.01, ***P < 0.001 by unpaired t test.
Is this relevant to the observed effect of haloperidol in reducing myofibroblast activation and fibrosis? Interestingly, the 2 potent inducers of ER stress, thapsigargin and tunicamycin, were even more potent than haloperidol in reducing the expression of 3 major markers of myofibroblast activation, Postn, Acta2, and Col1a1, in primary cardiac and lung fibroblasts (Figure 5, H and I, and Supplemental Figure 9C). These results are in line with publicly available microarray data sets, in which mouse embryonic fibroblasts derived from different strains were treated with tunicamycin for either 4 or 8 hours. As shown in Supplemental Figure 9, D and E, all data sets invariably showed increased expression of the ER stress–induced genes Atf3, Atf4, and Fkbp11, and a tendency toward downregulation of the profibrotic genes Postn, Acta2, and Col1a1.
The ER stress response is known to lead to the accumulation of unfolded proteins within the ER (47). As thapsigargin has been recently shown to interfere with the folding and expression of Notch1 in cancer cells (48–51) and Notch1 in turn seems to positively regulate the synthesis of αSMA in multiple cell types (52–54), we checked whether the same holds true in primary cardiac fibroblasts. We found that both haloperidol and thapsigargin potently reduced the levels of transmembrane Notch1 (TM-Notch1), without interfering with the canonical TGF-β pathway, as indicated by the unchanged levels of Smad2 phosphorylation (Figure 5J). The inhibitory effect of haloperidol on TM-Notch1 expression was still evident when haloperidol was administered in combination with TGF-β (Figure 5K). The Notch target genes Hes1, Hey1, Ccnd1, and Notch1 itself were also downregulated by haloperidol, although to a variable extent, in both cardiac and lung primary fibroblasts (Supplemental Figure 10A). Consistently, treatment of cardiac fibroblasts with the Notch inhibitor DAPT resulted in a dose-dependent reduction in the expression of αSMA, similar to what we obtained by treating the same cells with the TGF-β inhibitor SB43152 (Supplemental Figure 10B). To understand whether Notch1 processing was affected by haloperidol, we investigated its intracellular localization and found that upon treatment with haloperidol Notch 1 was retained within the ER compartment, as shown by its colocalization with the ER marker calreticulin (Supplemental Figure 11, A–E).
To further demonstrate that the effect of haloperidol on αSMA expression was mediated by the downregulation of Notch signaling, we overexpressed the constitutively active intracellular domain of Notch1 (Notch1-ICD) in NIH3T3 fibroblasts and found that it upregulated the expression of αSMA. Moreover, its overexpression in combination with haloperidol almost totally inhibited the effect of the drug, restoring the levels of αSMA and reducing the levels of Sigmar1 (Figure 5L).
Haloperidol inhibitsαSMA expression by myofibroblasts in vivo. We then investigated whether the effect of haloperidol in inhibiting myofibroblast conversion of fibroblasts was also exerted in 3 different in vivo models of fibrosis, namely cardiac fibrosis induced by left anterior descending coronary artery (LAD) ligation, bleomycin-induced lung fibrosis, and cancer-associated fibrosis in a model of orthotopic lung cancer.
First, we ligated the LAD to generate an acute myocardial infarction (MI) in both CD1 and COLL-EGFP mice, which allows reliable visualization of fibroblasts by fluorescence microscopy. As expected, LAD ligation resulted in a large fibrotic scar, populated by EGFP+ fibroblasts (Figure 6, A and B). Treatment with haloperidol for 10 days starting at the time of MI resulted in a significant reduction in scar size (Figure 6, B and C) as well as in the number of αSMA+myofibroblasts (Figure 6, D and E), without any change in the density of fibroblasts within the scar region (Figure 6F). However, when we monitored heart function over a period of 8 weeks after MI, we found that all the major echocardiography parameters, including ejection fraction (EF), fractional shortening (FS), end-diastolic left ventricular volume (EDLV), and end-systolic left ventricular volume (ESLV) were not significantly changed by haloperidol treatment (Figure 6, G–J). In accordance, the early effect on scar size was not evident at 8 weeks, which was possibly related to the previously described cardiotoxic effect of haloperidol (55) (Supplemental Figure 12, A and B).
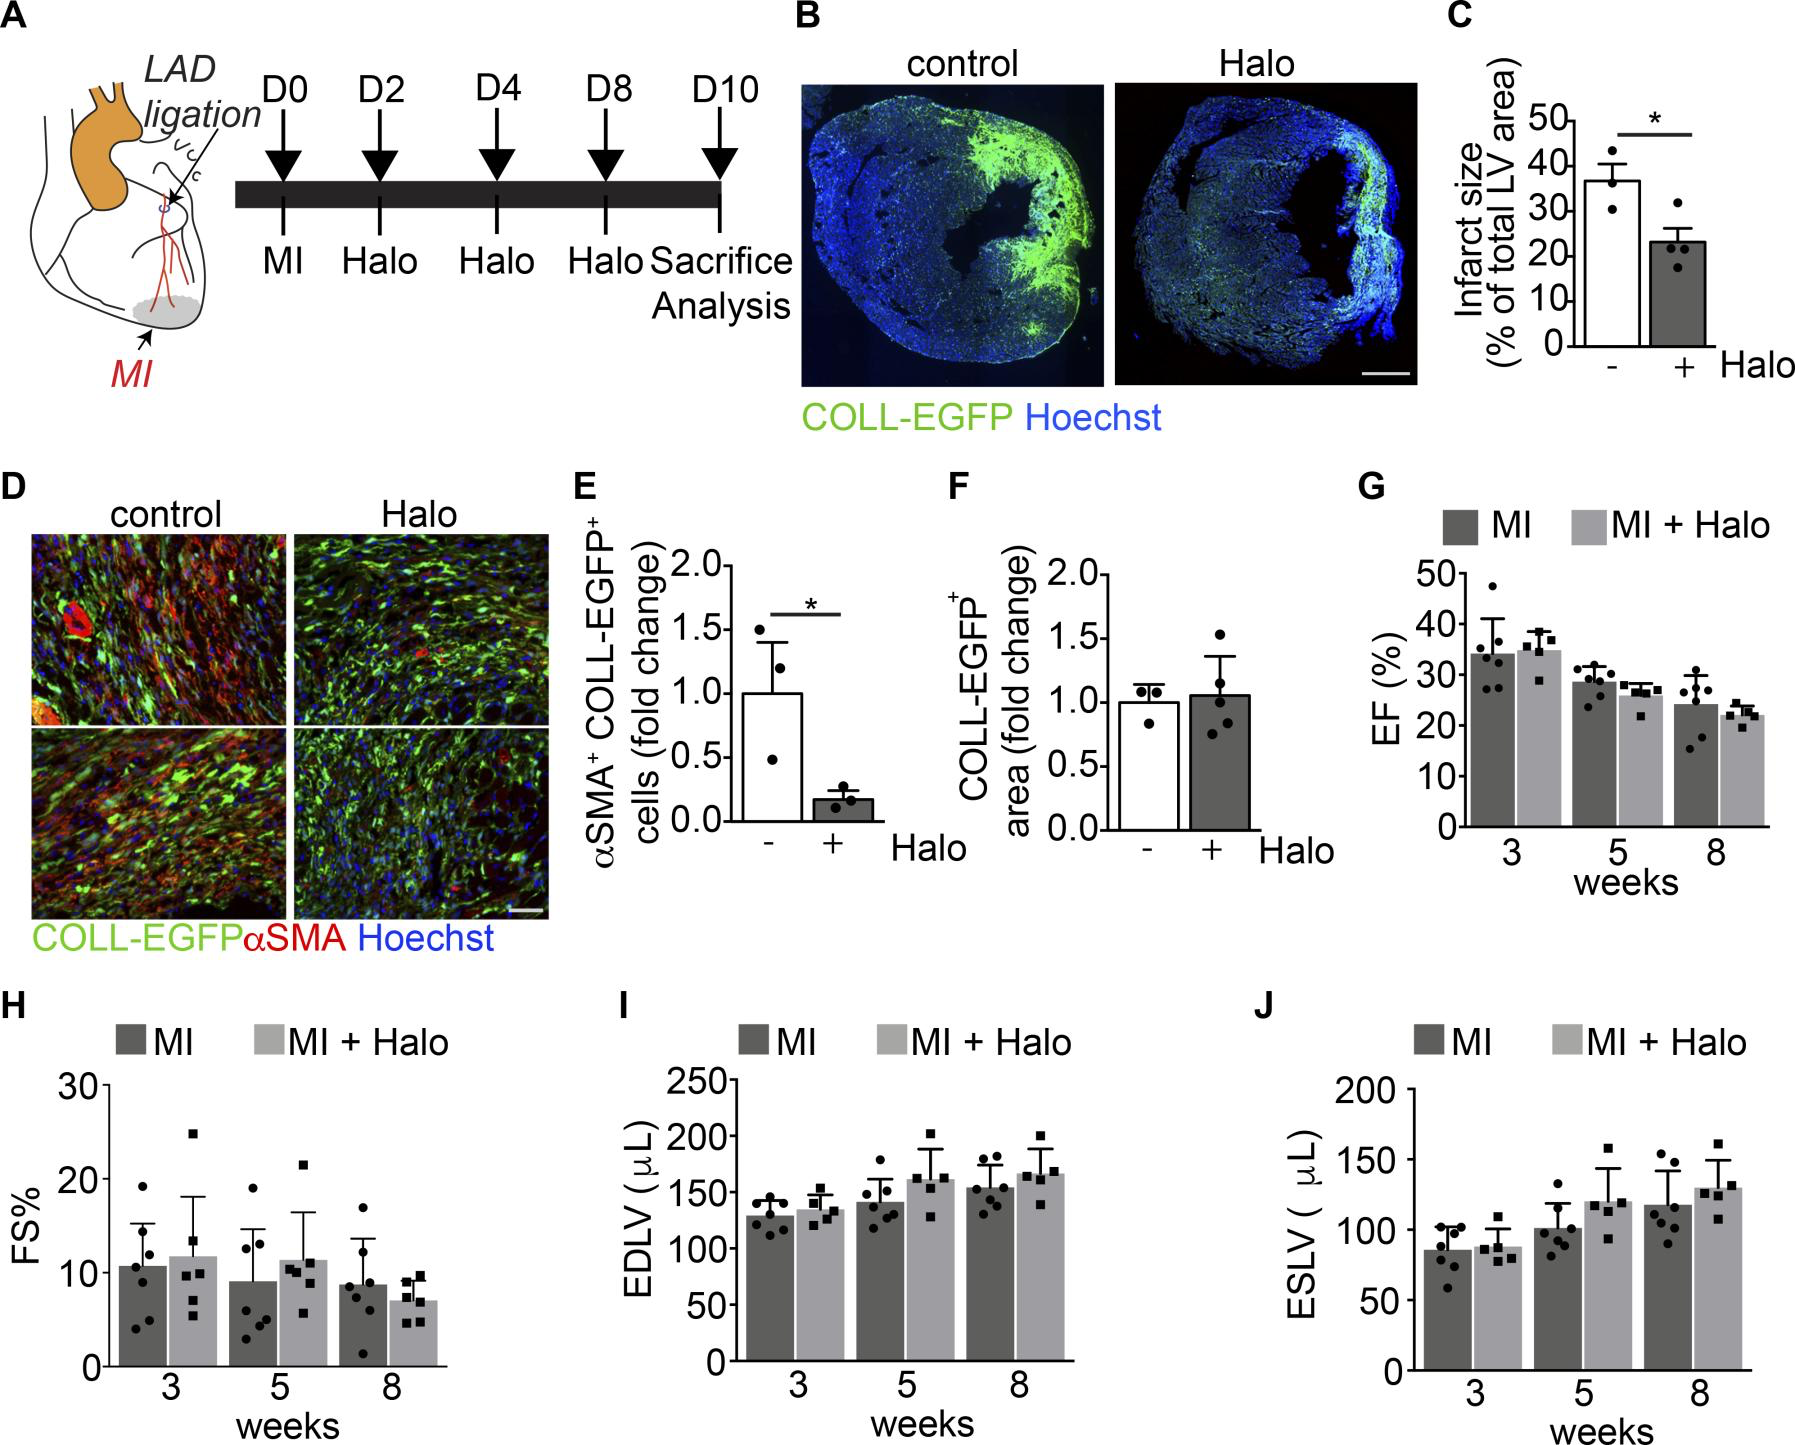
Haloperidol inhibits αSMA expression by cardiac myofibroblasts in vivo.
(A) Schematic of the cardiac fibrosis following myocardial infarction (MI) induced by the ligation of the left descendent anterior coronary artery (LAD). The aorta is indicated in orange, the LAD in red, and the MI in gray. (B) Representative images of the heart sections of COLL-EGFP mice at 10 days after MI, treated with either PBS (control) or haloperidol (Halo). Collagen expression is shown in green (COLL-EGFP) and nuclei are stained blue with Hoechst. (C) Quantification of infarct size in mice treated with either PBS or haloperidol on day 10 after MI (n > 3/gp). (D) Representative images of heart sections of COLL-EGFP mice, following MI and treatment with either PBS or haloperidol, stained red with anti-αSMA antibodies. Nuclei are stained blue with Hoechst. (E) Quantification of the number of αSMA+COLL-EGFP+ fibroblasts in infarcted hearts treated with either PBS or haloperidol (n > 3/gp). (F) Quantification of the COLL-EGFP+ area in infarcted hearts treated with either PBS or haloperidol (n > 3/gp). (G) Quantification of the ejection fraction (EF) in infarcted mice treated with either PBS or haloperidol at 3, 5, and 8 weeks after MI (n > 5/gp). (H) Quantification of the fractional shortening (FS) in mice subjected to MI and treated with either PBS (black bars) or haloperidol (gray bars) at 3, 5, and 8 weeks after MI (n > 5/gp). (I) Quantification of the end-diastolic left ventricular volume (EDLV) in mice subjected to MI and treated with either PBS (black bars) or haloperidol (gray bars) at 3, 5, and 8 weeks after MI (n > 5/gp). (J) Quantification of the end-systolic left ventricular volume (ESLV) in mice subjected to MI and treated with either PBS (black bars) or haloperidol (gray bars) at 3, 5, and 8 weeks after MI (n > 5/gp). Scale bars: 1 mm (B) and 100 μm (D). Values in C and E–J are mean ± SEM. *P < 0.05 by unpaired t test.
Next, we tested the effect of haloperidol in a model of pulmonary fibrosis (Figure 7A). As shown in Figure 7, B–D, the intratracheal administration of bleomycin into COLL-EGFP mice resulted in the formation of several COLL-EGFP+ fibrotic foci, which were significantly reduced in both number and intensity of collagen expression upon treatment by haloperidol for 10 days. In addition, αSMA positivity in extravascular regions was markedly reduced by haloperidol in the same lung sections (Figure 7, E–G). We performed LC-MS/MS analysis to confirm the availability of haloperidol in tissues using an established protocol (56, 57) and found that it distributed preferentially to the lung compared with the heart, independent of the treatment with bleomycin, reaching a concentration that was one-tenth of that measured in cultured fibroblasts (Supplemental Figure 13).
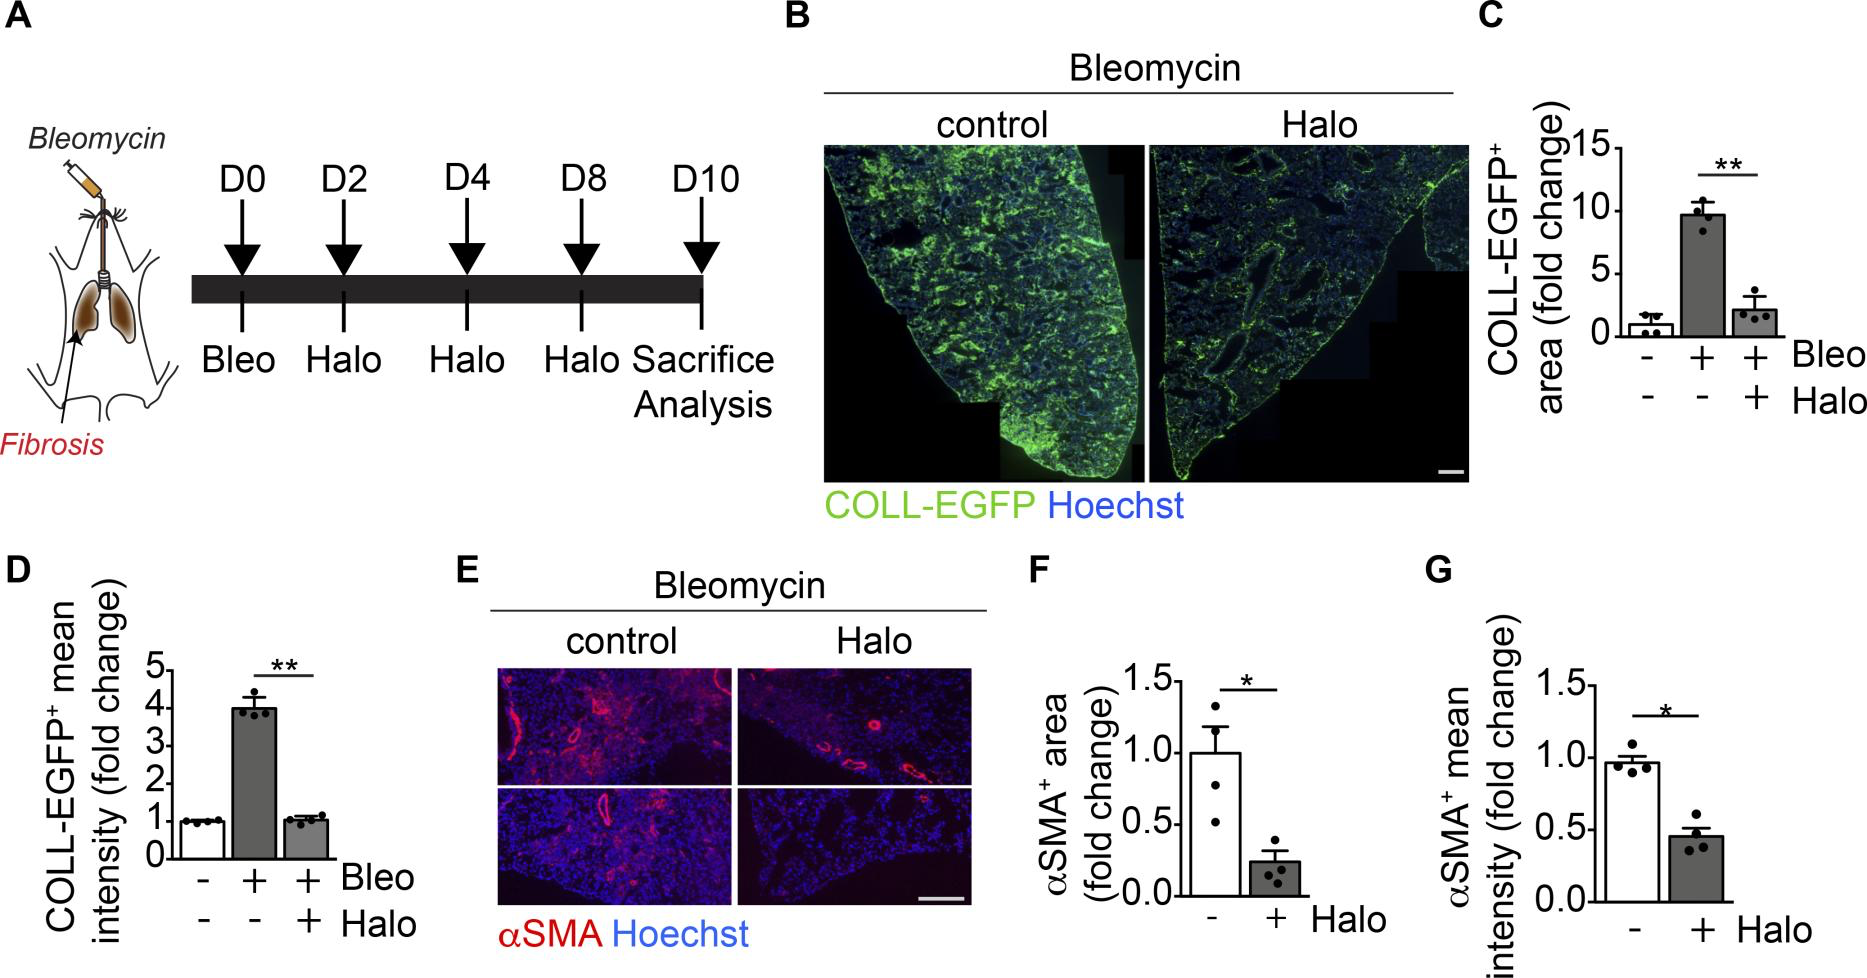
Haloperidol inhibits αSMA expression by lung myofibroblasts in vivo.
(A) Schematic of lung fibrosis induced by intratracheal injection of bleomycin (orange). (B) Representative images of lung sections of COLL-EGFP mice exposed to bleomycin and treated with either PBS (control) or haloperidol. Nuclei are stained blue with Hoechst. (C) Quantification of the COLL-EGFP+area in lungs exposed to bleomycin upon treatment with either PBS or haloperidol (n = 4/gp). (D) Quantification of the mean cell intensity of COLL-EGFP+ in lung fibroblasts exposed to bleomycin upon treatment with either PBS or haloperidol (n = 4/gp). (E) Representative images of lung sections from mice exposed to bleomycin upon treatment with either PBS (control) or haloperidol, stained red with anti-αSMA antibodies. Nuclei are stained blue with Hoechst. (F) Quantification of αSMA+ area in lungs of mice exposed to bleomycin upon treatment with either PBS or haloperidol (n = 4/gp). (G) Quantification of the mean cell intensity of αSMA+ in lung fibroblasts exposed to bleomycin upon treatment with either PBS or haloperidol (n= 4/gp). Scale bars: 1 mm (B) and 50 μm (E). Values in C, D, F, and G are mean ± SEM.*P < 0.05, **P < 0.01 by unpaired t test.
We also compared the effect of haloperidol to that exerted by the 2 antifibrotic drugs approved for use in IPF patients, nintedanib and pirfenidone. As shown in Supplemental Figure 14, A–C, all 3 drugs significantly inhibited αSMA expression in extravascular regions compared with lungs injected with bleomycin only. While pirfenidone was the most potent drug in reducing myofibroblast activation in this model, no significant differences were observed between haloperidol and nintedanib. Moreover, we compared the capacity of the 3 drugs to reduce αSMA expression in isolated lung fibroblasts at both mRNA and protein levels and observed that haloperidol was the most effective one in both cases (Supplemental Figure 14, D–F).
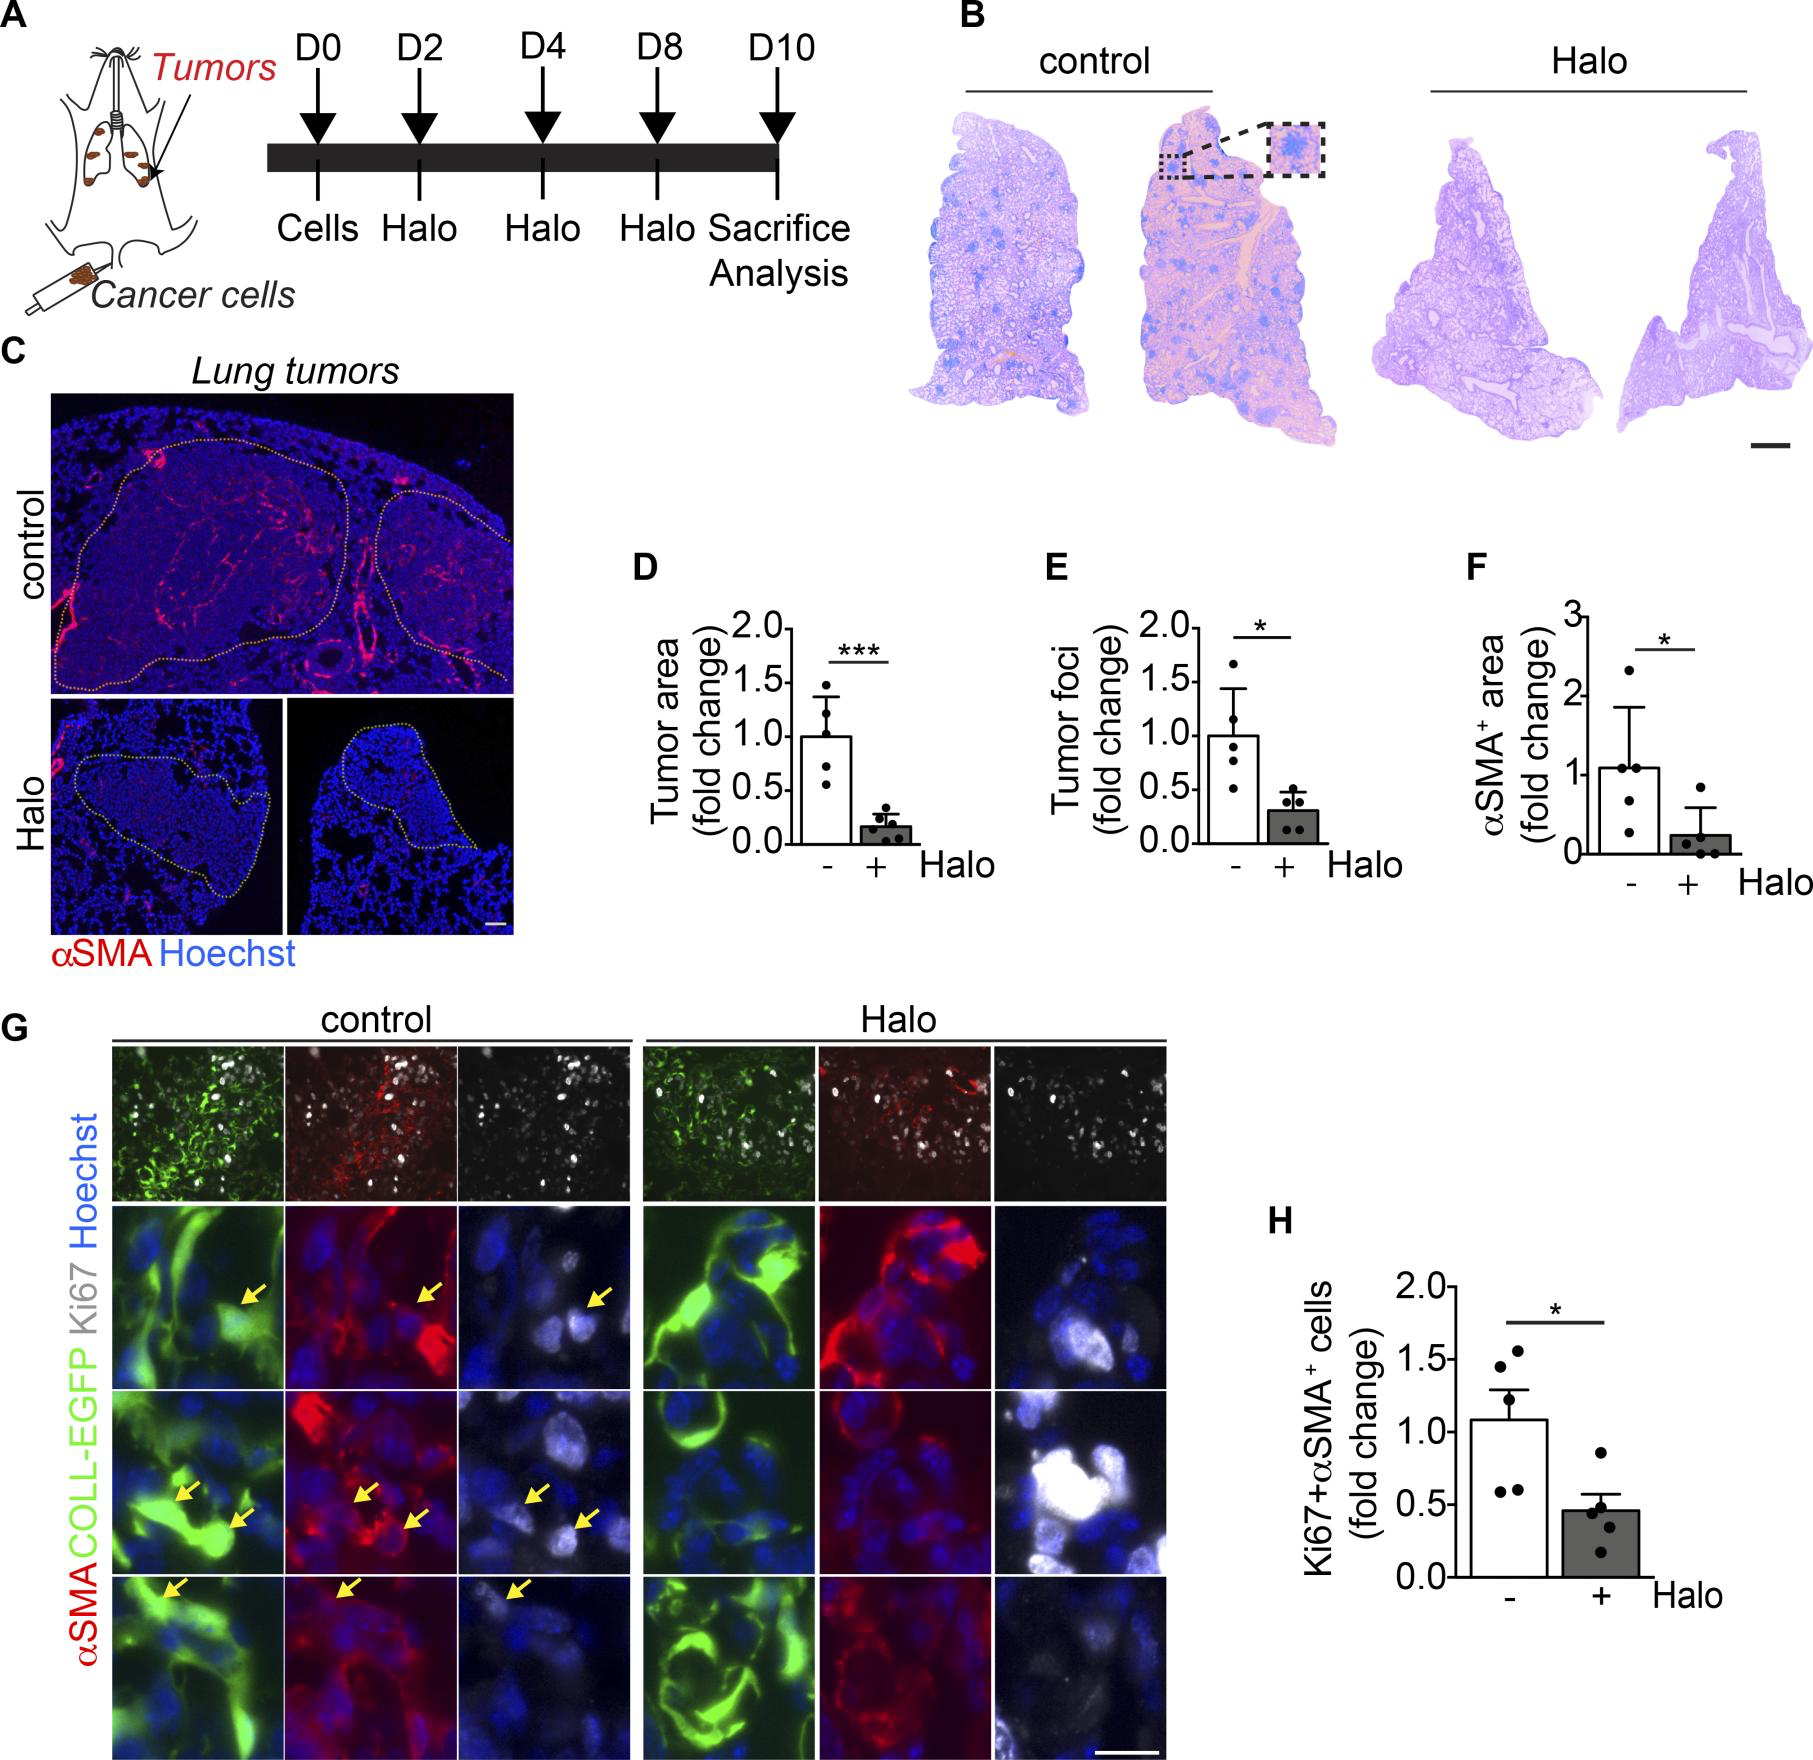
Haloperidol inhibits αSMA expression by cancer-associated myofibroblasts in vivo.
(A) Schematic of orthotopic lung tumors associated with cancer-associated fibroblasts (cancer cells are indicated in brown). (B) Hematoxylin and eosin staining of representative sections of lungs of mice injected with LG cancer cells into the tail vein, upon treatment with either PBS (control) or haloperidol. (C) αSMA staining (red) of sections of tumor-bearing lungs in mice treated with either PBS (control) or haloperidol. Nuclei are stained blue with Hoechst. (D) Quantification of the tumor area in lungs of mice treated with either PBS or haloperidol (n = 5/gp). (E) Quantification of the number of tumor foci in lungs of mice treated with either PBS or haloperidol (n = 5/gp). (F) Quantification of αSMA+ area in tumor-bearing lungs of mice upon treatment with either PBS or haloperidol (n = 5/gp). (G) Representative images of Ki-67 (white) and αSMA (red) staining in sections of lung in COLL-EGFP mice (fibroblasts in green) treated with PBS (control) or haloperidol. Arrows indicate Ki-67+COLL-EGFP+αSMA+cells. (H) Quantification of the Ki-67+αSMA+ myofibroblasts in lung cancer sections of COLL-EGFP mice treated with either PBS or haloperidol (n = 5/gp). Scale bars: 1 mm (B) and 50 μm (C and G). Values in D–Fand H are mean ± SEM.*P < 0.05, ***P < 0.001 by unpaired t test.
Collectively, these results indicate that haloperidol effectively inhibits activation of myofibroblasts, likely reverting them back to a quiescent phenotype in 3 different models of fibrosis in vivo.
Haloperidol inhibits human myofibroblast activation. As a step toward a possible use of haloperidol as a novel antifibrotic agent in humans, we investigated its effect on primary fibroblasts derived from human skin. First, we confirmed that haloperidol reduced the levels of αSMA in both basal conditions and upon treatment with TGF-β (Figure 9, A and B). Second, we performed live imaging experiments and again found that haloperidol increased Fluo4 fluorescence, indicating increased levels of intracellular calcium (Figure 9, C and D, and Supplemental Video 2). Finally, we observed that the downregulation of αSMA expression, either in the absence or in the presence of TGF-β, was invariably associated with reduced levels of TM-Notch1 (Figure 9E).
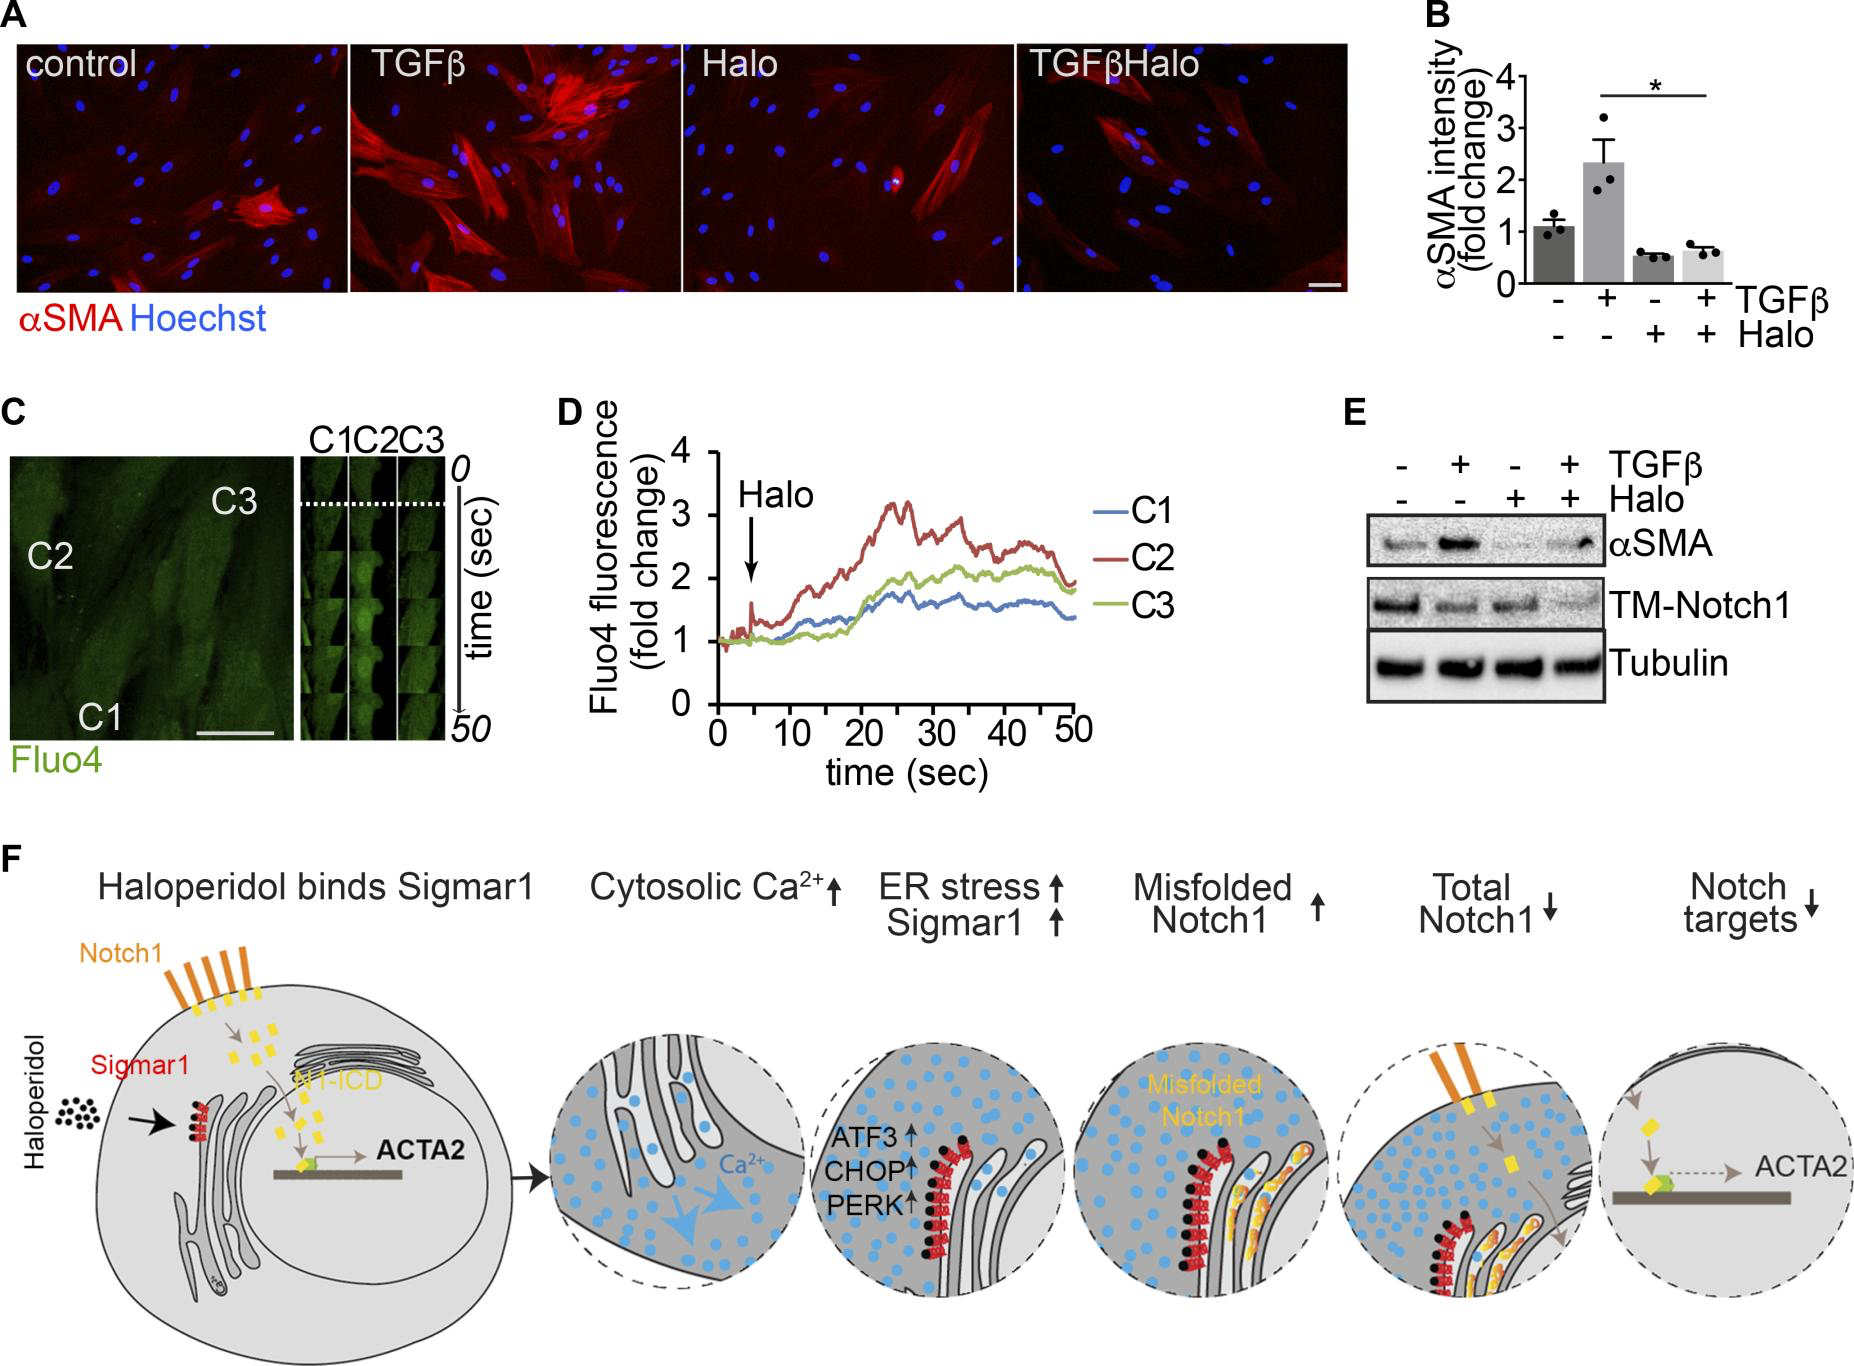
Haloperidol inhibits human myofibroblast activation.
(A) Adult human dermal fibroblasts treated with TGF-β, haloperidol, or their combination and stained with anti-αSMA antibodies (red). Nuclei are stained blue with Hoechst. (B) Quantification of the αSMA mean fluorescence intensity upon treatment with TGF-β, haloperidol, or their combination (n = 3/gp). Values are mean ± SEM. *P < 0.05 by unpaired t test. (C) Representative images of human fibroblasts loaded with the calcium-sensitive dye Fluo4 and treated with haloperidol at the time indicated by the dashed line. Time-lapse images of specific regions of interest (ROIs) in 3 different cells (C1, C2, and C3) are shown on the right. (D) Quantification of mean fluorescence intensity in each ROI (C1 in blue, C2 in red, and C3 in green) upon addition of haloperidol at the time indicated by the arrow. (E) Western blot showing the expression of TM-Notch1 and αSMA after treatment with TGF-β, haloperidol, or their combination. Tubulin is used as loading control. Blot for αSMA was run in parallel. (F) Schematic of a proposed model for the mechanism of action of haloperidol in regulating the expression of αSMA in fibroblasts. Scale bars in A and C: 50 μm.
Collectively, these results imply that haloperidol effectively inhibits the activation of fibroblasts derived from various organs and species, through a mechanism that involves binding to Sigmar1, an increase in the intracellular calcium levels, mild ER stress, and inhibition of the Notch pathway, as schematically depicted in Figure 9F.
Discussion
Using an innovative approach based on the availability of transgenic animals expressing RFP under the control of the αSMA promoter, we have performed HTS and identified several drugs affecting the differentiation of primary fibroblasts into myofibroblasts. Among the top 10 hits were dexamethasone and prednisone, two corticosteroids that have been previously shown to reduce fibrosis and are used to treat patients with IPF (14), but are fraught with major side effects, including bone loss, diabetes, and hypertension (58). The second hit was haloperidol, a potent antipsychotic drug, which has been successfully used to treat psychosis, agitated states, and delirium for over half of a century. A few studies have revealed antiinflammatory properties of haloperidol (59), resulting in reduced lung fibrosis, without any further mechanistic explanation of this in vivo effect (60). Here, we show that haloperidol inhibits the activation of myofibroblasts in different organs, by binding to Sigmar1. This in turn activates an intracellular signaling cascade, which leads to an increase in the cytoplasmic calcium levels, the activation of mild ER stress response, reduced Notch1 signaling, and eventually reduced expression of profibrotic genes.
In the heart, this antifibrotic mechanism resulted in a transient reduction of infarct size at 10 days, consistent with a previous report showing reduced incidence of MI at autopsy in psychiatric patients treated with haloperidol (61). However, this beneficial effect was lost at later time points, which was possibly related to the toxic effect of haloperidol on ATP production and contractility in cardiomyocytes (55), as also documented by the occurrence of heart arrhythmias, prolongation of QT interval, and torsade de pointes in patients treated with haloperidol (62, 63).
In the lung, we observed a potent effect of haloperidol in reducing myofibroblast activation in a model of bleomycin-induced fibrosis. Although pirfenidone was slightly more effective than haloperidol in the protocol tested for prevention, they both show the same therapeutic activity when administered once the fibrotic process was already in place. In addition, when we assessed αSMA expression in lung fibroblasts, haloperidol was consistently the most effective drug.
We also demonstrated the efficacy of haloperidol in an orthotopic lung cancer model. Haloperidol is commonly used in cancer patients for the control of nausea, vomiting, and agitation (64, 65). In our model, we observed a clear reduction in both the tumor area and the number of tumor foci, associated with a decreased number of intratumoral myofibroblasts. Haloperidol was previously shown to inhibit tumor growth, possibly by binding to Sigmar1 expressed by various types of cancer cells (41, 66), and repurposing of haloperidol as an anticancer drug has been proposed for the treatment of glioblastoma (67). As we did not detect any inhibitory effect of haloperidol on the proliferation of LG cells (data not shown), we believe that in our model the main mechanism by which it has reduced tumor growth in vivo was through the inhibition of myofibroblast activation. Thus, haloperidol could be used as a pleiotropic drug, modulating the growth of cancers expressing Sigmar1.
The biology of Sigmar1 is very complex and to a large extent still poorly defined. It is a single 25-kDa polypeptide and a chaperone protein immersed in lipid rafts of the ER, where it interacts with mitochondria and the mitochondria-associated ER membrane domain (MAM). Upon activation, Sigmar1 modulates the function of multiple receptors and ion channels, contributing to cellular calcium homeostasis (68). Our docking model shows that haloperidol in its highest-ranked binding pose interacts with all residues in the binding pocket of Sigmar1, including Phe133, Glu172, Leu105, Met93, Leu95, Ile178, Val84, His154, and Val152, in line with previous studies pointing to Glu172 as an essential residue for Sigmar1-haloperidol binding (69, 70). Interestingly, we found that haloperidol potently upregulates Sigmar1 at the protein level, with no significant changes in its transcription (transcriptional data not shown). This has been previously observed in hepatocellular carcinoma and neuronal cells (42, 71), but to our knowledge not reported in fibroblasts so far. Our data suggest that the binding of haloperidol to Sigmar1 might induce the release of calcium from the ER into the cytosol, thereby promoting ER stress, which could in turn upregulate Sigmar1 levels. Consistent with this hypothesis, Sigmar1 upregulation was reported upon cell treatment with other ER stress inducers, such as glucose, heat shock, and thapsigargin (72). Also, previous genetic screenings identified either the noncanonical TGF-β pathway or calcium as a major regulator of myofibroblast activation (23–25). For instance, TRPC6-mediated calcium signaling induced myofibroblast differentiation, although this channel essentially controls calcium influx from the extracellular space and not its release from the ER, as in our model (24).
Is the ER stress also mediating the observed downregulation of Notch1 levels in response to haloperidol? Although the definitive answer to this question still needs to be provided, our data support the emerging view that ER stress might indeed control the Notch pathway, which is implicated in multiple processes during both development and disease (73). We observed that fibroblast treatment with haloperidol resulted in the upregulation of various ER stress markers, including Atf3, Fkbp11, and Gadd34, similarly to the potent ER stress inducers thapsigargin and tunicamycin. ER stress is known to potentially interfere with the expression of proteins, which depend on calcium for their proper folding (74, 75). Specifically, the Notch1 receptor contains 36 EGF and 3 Lin12/Notch repeats, which all require calcium ions to properly fold (76–78). Indeed, thapsigargin, by altering calcium concentration within the ER, was shown to interfere with Notch1 maturation, resulting in the overall inhibition in Notch1 expression and signaling in leukemia cells (48). We also found that haloperidol and thapsigargin similarly downregulated the levels of the Notch1 transmembrane form in both murine and human primary fibroblasts. This is in line with previous work in flies, showing that misfolded Notch1 in Ero1 mutant cells is retained and not properly exported from the ER to the cell membrane (79). Importantly, the overexpression of the constitutively active Notch1-ICD, lacking EGF and Lin12/Notch repeats, inhibited the effect of haloperidol and restored αSMA in fibroblasts. These data are also in line with multiple lines of evidence, supporting an antifibrotic role of the Notch pathway (80, 81). Notch pathway components were found upregulated in models of cardiac, lung, skin, and liver fibrosis and chemical inhibition of the pathway invariably reduced the fibrotic signature, improving the outcome of the disease (82–85).
Similarly, the role of ER stress in fibrotic diseases has been extensively investigated, with conflicting results (86, 87). ER stress markers, such as Atf4, Chop, and Atf6, appear upregulated in patients with IPF (88, 89). In addition, ER stress induced by the accumulation of misfolded protein, such as in the case of transgenic mice expressing a mutant form of the surfactant protein A2 (SFTPA2) in alveolar epithelial cells, also results in lung fibrosis. Although these data tend to indicate that ER stress is detrimental and enhance a profibrotic response, other evidence, including ours, supports opposite conclusions. For instance, induction of ER stress by either thapsigargin or tunicamycin resulted in reduced Col1a1 expression by mouse embryonic fibroblasts (88, 90, 91). Whether these discrepancies might be attributed to a different role of the ER stress in different cell types (i.e., ER stress might promote a fibrotic response in alveolar cells and reduce it in fibroblasts) or the extent of the ER stress response might result in different outcome (i.e., a mild ER stress might be protective, whereas a strong ER stress might be detrimental) still remains an open question.
Overall, our data indicate that haloperidol might be considered a novel drug able to interfere with myofibroblast activation, supporting its repurposing for the treatment of various diseases involving a profibrotic response. In addition, we provide mechanistic insights linking Sigmar1, calcium homeostasis, ER stress, and the Notch1-mediated transcription of αSMA in primary fibroblasts derived from different organs. The evidence that this pathway is also active in human fibroblasts could set the stage for the validation of novel therapeutic targets in inhibiting fibrosis.