
Fluent molecular mixing of Tau isoforms in Alzheimer’s disease neurofibrillary tangles
By Aurelio J. Dregni, Pu Duan, Hong Xu, Lakshmi Changolkar, Nadia El Mammeri, Virginia M.-Y. Lee, and Mei Hong
Excerpt from the article published in Nature Communications 13, 2967 (2022). https://doi.org/10.1038/s41467-022-30585-0
Editor’s Highlights
- Alzheimer’s disease (AD) is defined by intracellular neurofibrillary tangles formed by the microtubule-associated protein tau and extracellular plaques formed by the β-amyloid peptide.
- Extensive biochemical data have established that misfolded tau proteins in AD and other tauopathies spread by recruiting soluble tau protein into the aggregate, and distinct isoforms might be expected to interfere with the propagation of the amyloid structure.
- In the human brain, the microtubule-associated protein tau exists in six isoforms, which are mainly distinguished by the presence or absence of the second microtubule-binding repeat, R2.
- Tau isoforms that contain four microtubule-binding repeats (R1, R2, R3, and R4) are called four-repeat (4R) tau, whereas those that contain three microtubule-binding repeats (R1, R3, and R4) are called three-repeat (3R) tau.
- The AD tau tangles contain a mixture of 4R and 3R tau isoforms, whereas other tauopathies such as corticobasal degeneration and Pick’s disease are characterized by either aggregated 4R tau or aggregated 3R tau.
- In AD tau filaments recruit 4R and 3R tau monomers with a ratio of 60:40, and with a small preference for homotypic contacts.
- The AD tau fold may have evolved over its slow replication phase to adapt to the environment of the AD brain.
- The fluent molecular mixing of both 4R and 3R tau isoforms and the preservation of the β-sheet conformation regardless of the isoform could potentially be an adaptive trait to optimize prion growth and propagation.
- The significant amplification of the morphology and toxicity of AD tau filaments shown here opens new avenues for future characterization of the molecular structure of tau in different tauopathies using a wide range of biophysical methods.
- The most relevant tauopathies are: Behavioral variant of frontotemporal dementia (bvFTD), non-fluent agrammatic variant of primary progressive aphasia (nfavPPA), semantic variant of primary-progressive aphasia (svPPA), and amnestic syndrome of hippocampal type (AS), Richardson syndrome (RS), corticobasal syndrome (CBS), primary gait freezing (PGF), cerebellar syndrome (C), primary lateral sclerosis (PLS), progressive supranuclear palsy (PSP), corticobasal degeneration (CBD) and familial FTD with parkinsonism linked to MAPT (FTDP-17).
Abstract
Alzheimer’s disease (AD) is defined by intracellular neurofibrillary tangles formed by the microtubule-associated protein tau and extracellular plaques formed by the β-amyloid peptide. AD tau tangles contain a mixture of tau isoforms with either four (4R) or three (3R) microtubule-binding repeats. Here we use solid-state NMR to determine how 4R and 3R tau isoforms mix at the molecular level in AD tau aggregates. By seeding differentially isotopically labeled 4R and 3R tau monomers with AD brain-derived tau, we measured intermolecular contacts of the two isoforms. The NMR data indicate that 4R and 3R tau are well mixed in the AD-tau seeded fibrils, with a 60:40 incorporation ratio of 4R to 3R tau and a small homotypic preference. The AD-tau templated 4R tau, 3R tau, and mixed 4R and 3R tau fibrils exhibit no structural differences in the rigid β-sheet core or the mobile domains. Therefore, 4R and 3R tau are fluently recruited into the pathological fold of AD tau aggregates, which may explain the predominance of AD among neurodegenerative disorders.
Introduction
In the human brain, the microtubule-associated protein tau exists in six isoforms, which are mainly distinguished by the presence or absence of the second microtubule-binding repeat, R2 (ref. 1). Tau isoforms that contain four microtubule-binding repeats (R1, R2, R3, and R4) are called four-repeat (4R) tau, whereas those that contain three microtubule-binding repeats (R1, R3, and R4) are called three-repeat (3R) tau. In a number of neurodegenerative diseases, these intrinsically disordered tau proteins become hyperphosphorylated and form intraneuronal aggregates. Alzheimer’s disease (AD) is defined by these tau neurofibrillary tangles as well as the extracellular plaques formed by the β-amyloid peptide2,3. Interestingly, the AD tau tangles contain a mixture of 4R and 3R tau isoforms, whereas other tauopathies such as corticobasal degeneration and Pick’s disease are characterized by either aggregated 4R tau or aggregated 3R tau. Recent cryo-electron microscopy (cryoEM) studies4,5,6 revealed that there is a single well-defined molecular conformation for the β-sheet core of AD tau filaments, but did not determine how 4R tau and 3R tau are mixed in the aggregate. The rigid core of the AD tau filaments spans the R3, R4, and part of the R′ repeats, which are present in both 4R and 3R tau isoforms. Another mixed-tau disease, chronic traumatic encephalopathy, also exhibits a single rigid core structure for its tau filaments7, with no discernible differentiation between 4R and 3R tau in the fibril. Understanding how different tau isoforms are mixed in these filaments is important, because extensive biochemical data have established that misfolded tau proteins in AD and other tauopathies spread by recruiting soluble tau protein into the aggregate, and distinct isoforms might be expected to interfere with the propagation of the amyloid structure8,9,10,11,12,13,14,15,16,17. To determine how 4R and 3R tau isoforms are mixed in the neurofibrillary tangles in AD brains, here we use solid-state nuclear magnetic resonance (NMR) spectroscopy to investigate AD-tau seeded 15N-labeled and 13C-labeled tau proteins. We show that the 4R and 3R tau isoforms are fluently mixed in AD tau filaments, with no detectable structural differences among pure 4R tau fibrils, pure 3R tau fibrils, and mixed 4R and 3R tau fibrils.
Results
To determine the mode of mixing of 4R and 3R tau in AD tau aggregates, we seeded 15N or 13C-labeled recombinant tau monomers with 10% AD brain-derived sarkosyl-insoluble tau (AD tau) (Fig. 1a) and characterized the resulting fibrils using solid-state NMR. AD tau was pooled from ten neuropathologically confirmed diagnosis of AD (Supplementary Tables 1 and 2). The use of multiple AD brains ensures that the molecular structural results we obtain reflect the average properties of AD brain tau filaments instead of the property of one AD patient. We chose brains with short postmortem intervals and high tau-burdens at late stages of the disease18,19. AD tau seeds were sequentially extracted from these brains. To these AD tau extracts we added ninefold excess of either a 1:1 mixture of 0N4R and 0N3R tau monomers or one of the two monomers. After 7 days of incubation under shaking, about half of the added monomers became insoluble (Fig. 1b and Supplementary Fig. 1), indicating a fivefold increase in insoluble mass18,19. Unseeded recombinant tau remained largely soluble. Transmission electron microscopy (TEM) images reveal that the monomer-added samples formed much longer filaments (200–300 nm) than the original AD tau seeds (40–70 nm) (Fig. 2 and Supplementary Fig. 2a). Most of these filaments have a twisted morphology whereby an ~10 nm width alternates with an ~25 nm width. A small number of relatively straight fibrils with ~16-nm width is also observed (Supplementary Table 3). These two morphologies are similar to the paired helical filaments (PHF) and straight filaments (SF) in AD tau20, but differ from the long, straight and 14–23 nm wide fibrils assembled using heparin21,22,23 (Fig. 2c and Supplementary Fig. 2b). The AD-tau templated fibrils can seed mouse tau in wild-type primary neurons into morphologically identical aggregates, as detected by immunofluorescence using a mouse-tau specific antibody (Fig. 1c). Recent studies showed that these AD-tau-seeded mouse tau aggregates are localized to dendrites and axons19,24. Quantification of the fluorescence intensities shows that the amount of aggregated mouse tau increased in the presence of templated fibrils compared to the 10% AD-tau control (Fig. 1d). Therefore, the templated recombinant tau fibrils are pathologically similar to AD tau; moreover, the templated fibrils have higher overall pathogenicity compared the original 10% AD tau seeds. A similar increase in pathogenicity were observed whether 4R tau alone, 3R tau alone, or a mixture of both isoforms were added to the AD tau seeds25. Together, these data indicate that the ultrastructural morphology and pathological activities of AD tau are faithfully propagated by recombinant tau, regardless of whether 4R tau, 3R tau or both isoforms were added.
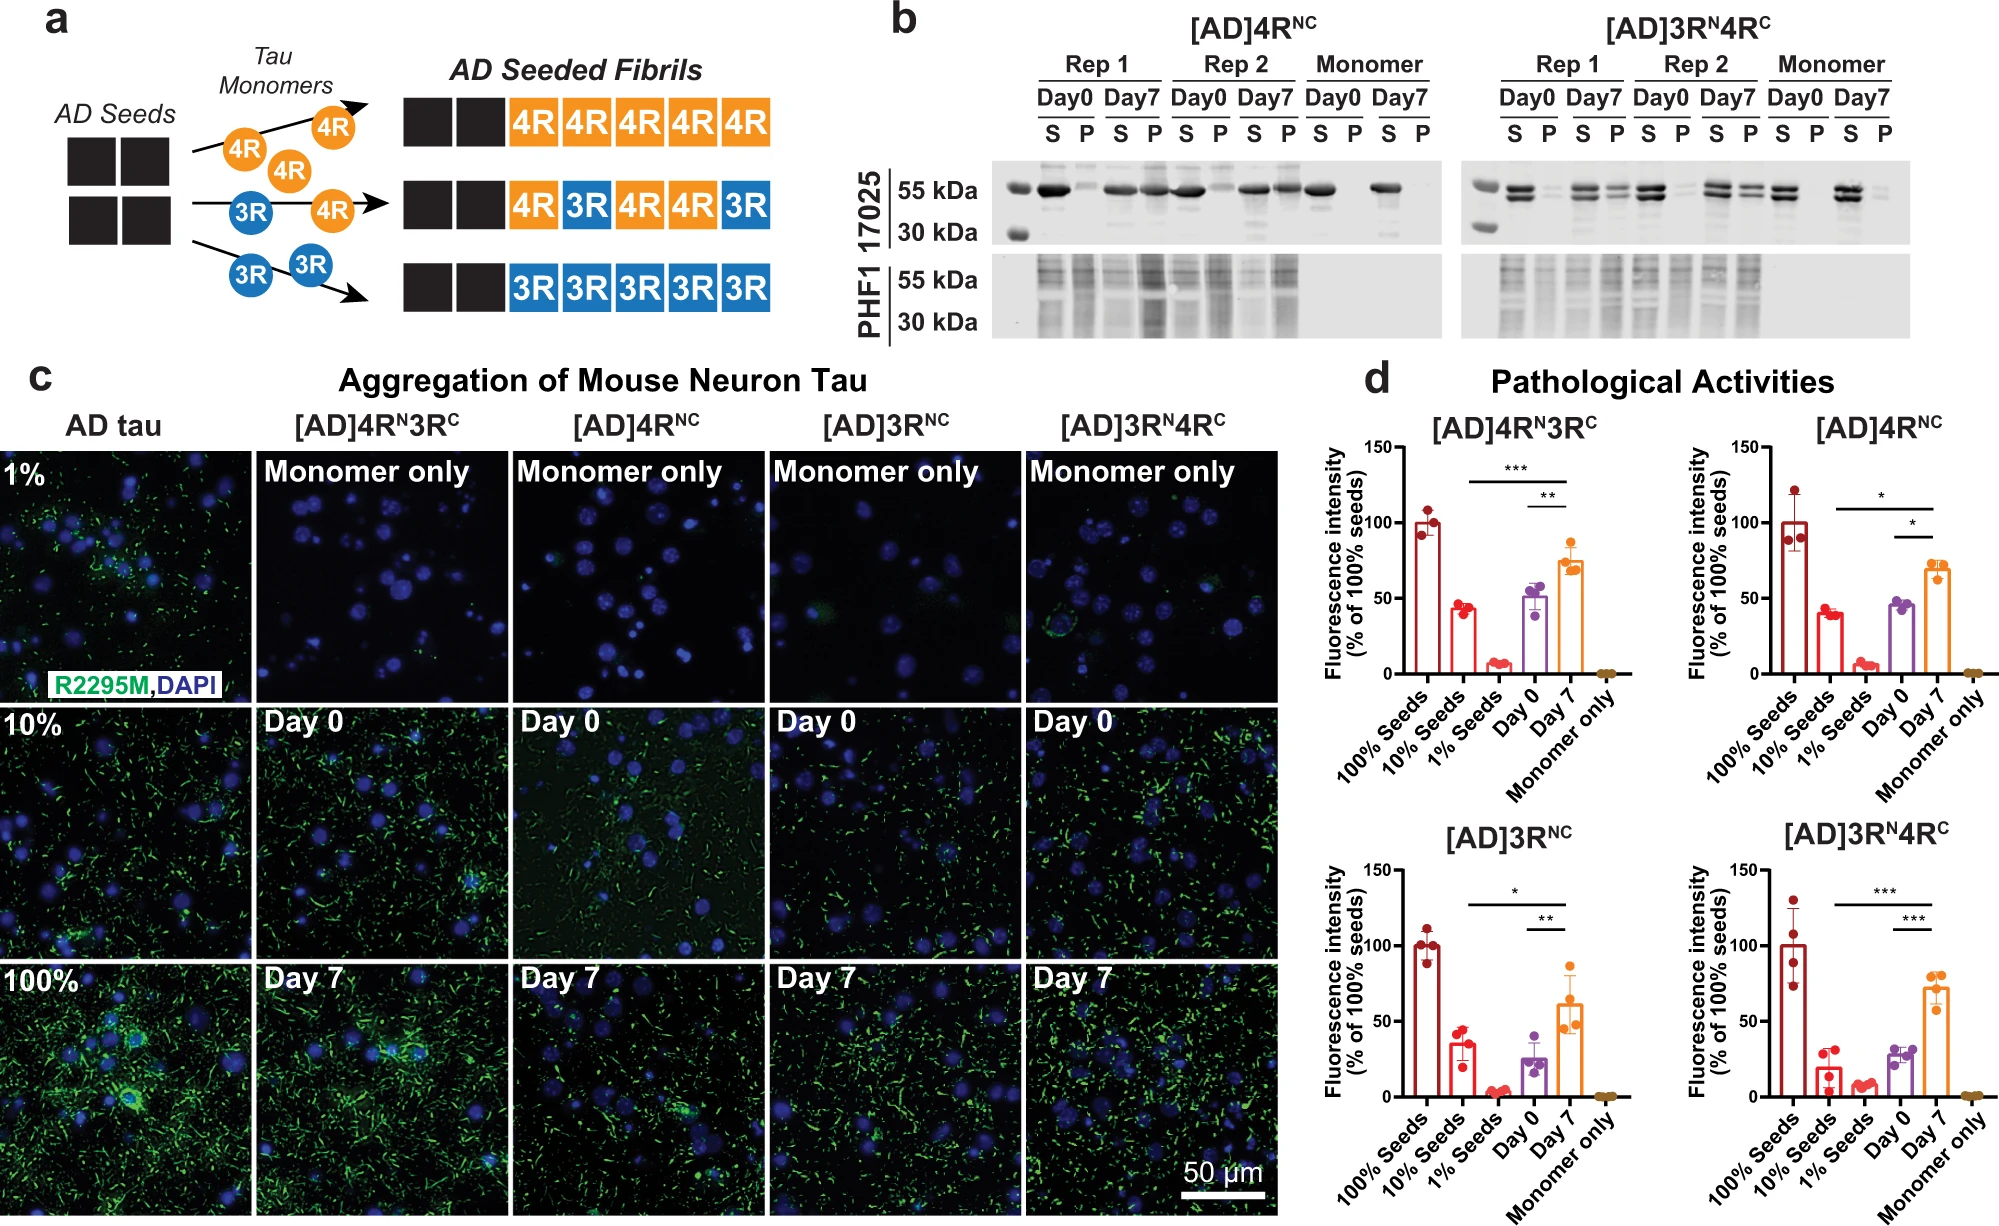
Isotopically labeled recombinant tau seeded with AD tau filaments conserves the AD pathogenic activity in wild-type neurons.
a Schematic of seeding recombinant 0N4R and 0N3R tau with AD tau extracts. b Sedimentation assay shows that recombinant tau monomers are incorporated into insoluble mass after 7 days of shaking with 10% AD tau seeds. Samples were fractionated into supernatant (S) and pellet (P) by ultracentrifugation. Tau species were revealed by the 17,025 antitotal tau antibody and PHF1 anti-phospho-tau antibody. Aliquots of replicate (Rep) samples 1 and 2 were collected for biochemical characterization at day 0 and day 7 (the end) of the fibrillization reaction. Reactions without AD tau seeds (monomer-only) were used as control to assess the extent of self-fibrillization. Full blots can be found in Supplementary Fig. 1. c Immunocytochemistry shows AD-tau-seeded recombinant tau fibrils recapitulate the pathogenicity of AD tau in primary neurons. Wild-type primary hippocampal neurons were transduced with AD tau or seeded tau fibrils. Aggregated tau pathology was revealed by R2295M anti-mouse tau antibody (green) and DAPI (blue) that stains cell nuclei. Seeded samples are AD-tau-seeded fibrils containing a 1:1 mixture of 15N-labeled 4R tau and 13C-labeled 3R tau, 4R-only tau, 3R-only tau, and a 1:1 mixture of 15N-labeled 3R tau and 13C-labeled 4R tau. d Quantification of fluorescence in c shows that the seeded fibrils at day 7 have increased pathogenicity compared to day 0. As expected, day 0 samples (10% AD tau seeds with monomers) showed similar pathogenicity levels to the 10% tau seeds without monomers. All values were normalized to the 100% AD tau seeds. Statistical analysis was performed using one-way ANOVA. Multiple comparison between groups was conducted using Tukey post hoc test. On the graph, *P < 0.05, **P < 0.01, ***P < 0.001 in the multiple comparison tests. Error bars are presented as standard deviation (SD). Each data point stands for one biological repeat: [AD]4RN3RC n=3, [AD]4RNC n=3, [AD]3RNC n=4, [AD]3RN4RC n=4.
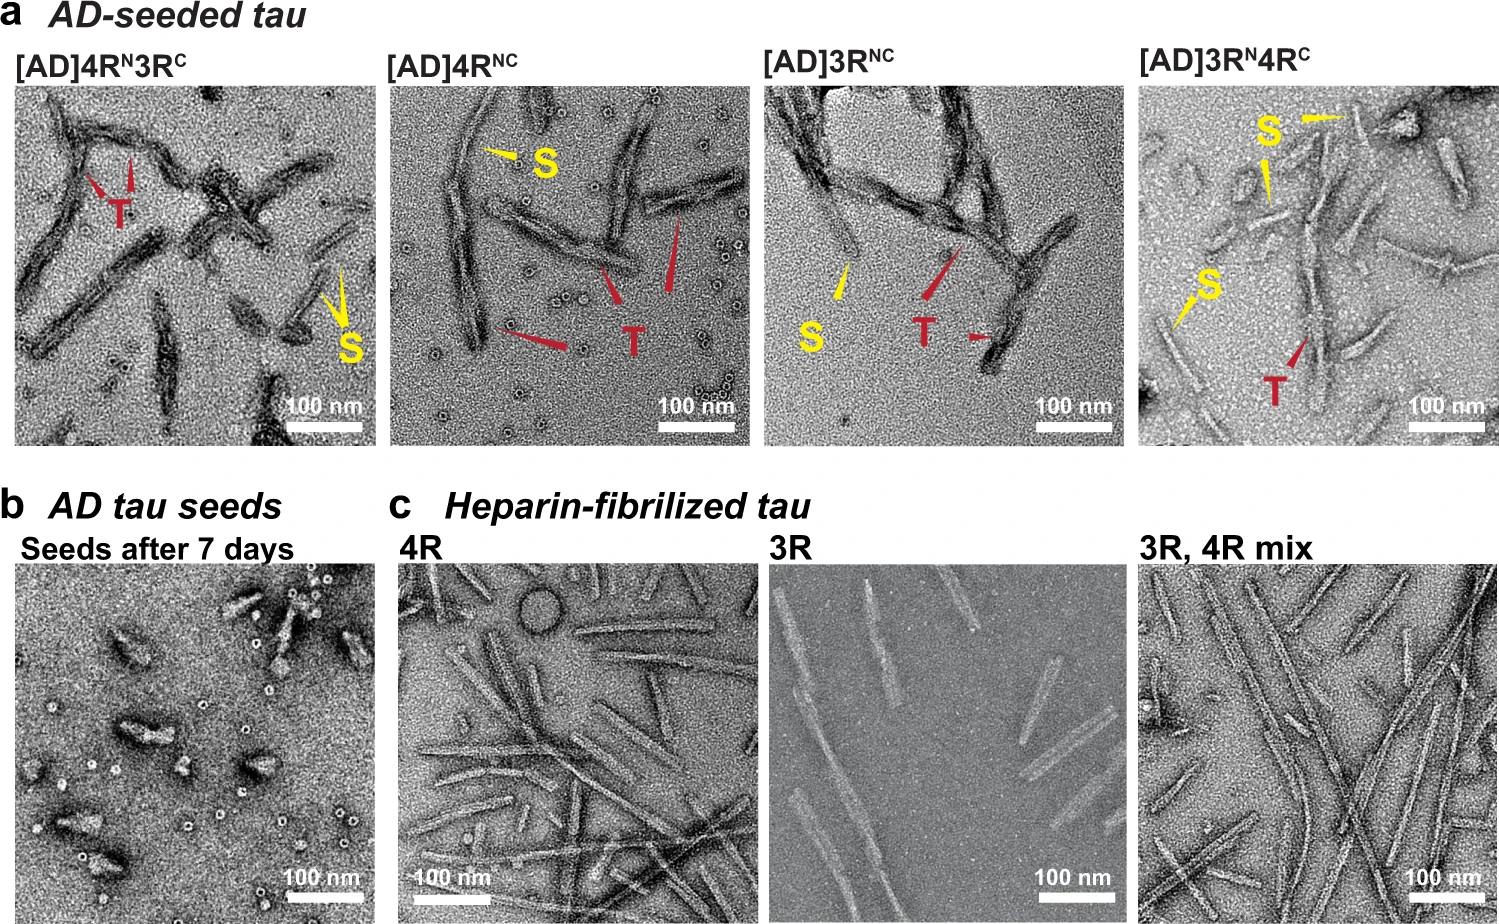
Ultrastructural morphology of AD-tau seeded tau fibrils is distinct from that of heparin-fibrillized tau.
a TEM images of AD-tau seeded fibrils containing a 1:1 mixture of 15N-labeled 4R tau and 13C-labeled 3R tau, 4R-only tau, 3R-only tau, and a 1:1 mixture of 15N-labeled 3R tau and 13C-labeled 4R tau. All samples show predominantly twisted (T) fibrils whose widths alternate between ~10 nm and ~25 nm, similar to the paired helical filaments of AD tau. In addition, a minority of straight (S) fibrils are observed, which are similar to the straight filaments of AD tau. b AD tau seeds after 7 days of incubation without added recombinant monomers. The seeds are fivefold shorter than the amplified tau fibrils. No long fibrils are observed. c Heparin-assembled recombinant tau fibrils. These fibrils are nearly exclusively straight, and are longer and more uniform than the straight filaments in AD-tau seeded filaments. At least five different images from different regions of each grid were obtained for each sample. A side-by-side comparison of these fibrils can be found in Supplementary Fig. 2.
To determine how 4R and 3R tau monomers are organized in AD-tau templated fibrils, we conducted a 15N–13C rotational-echo-double-resonance (REDOR) NMR experiment26 (Fig. 3). This experiment measures the proportion of 13C-labeled tau that is one strand away from an 15N-labeled tau in the hydrogen-bonded cross-β fibril. Because two hydrogen-bonded β-strand backbones are separated by ~4.8 Å, the distance-dependent intermolecular 15N–13C dipolar coupling depends only on how two differentially labeled tau monomers are mixed (Fig. 3a, b). 13C dipolar dephasing of an 15N-labeled tau is manifested as intensity loss between a spectrum measured with the 13C pulses off (S0) and the 13C pulses on (S). Greater 15N–13C dipolar dephasing, or lower S/S0 values, indicates a higher probability of 13C-labeled tau following an 15N-labeled tau. To increase the spectral sensitivity, we observed this 15N intensity loss through the signals of the directly bonded amide proton. No 1H spectral resolution is required, as the REDOR experiment detects all rigid amides in the rigid β-sheet fibril core (Fig. 3c, d). To simplify the 1H spectra and facilitate the comparison of 2D 15N–1H correlation spectra, we perdeuterated the protein monomers and back-exchanged them with water. The resulting recombinant tau contains only NH and OH protons.
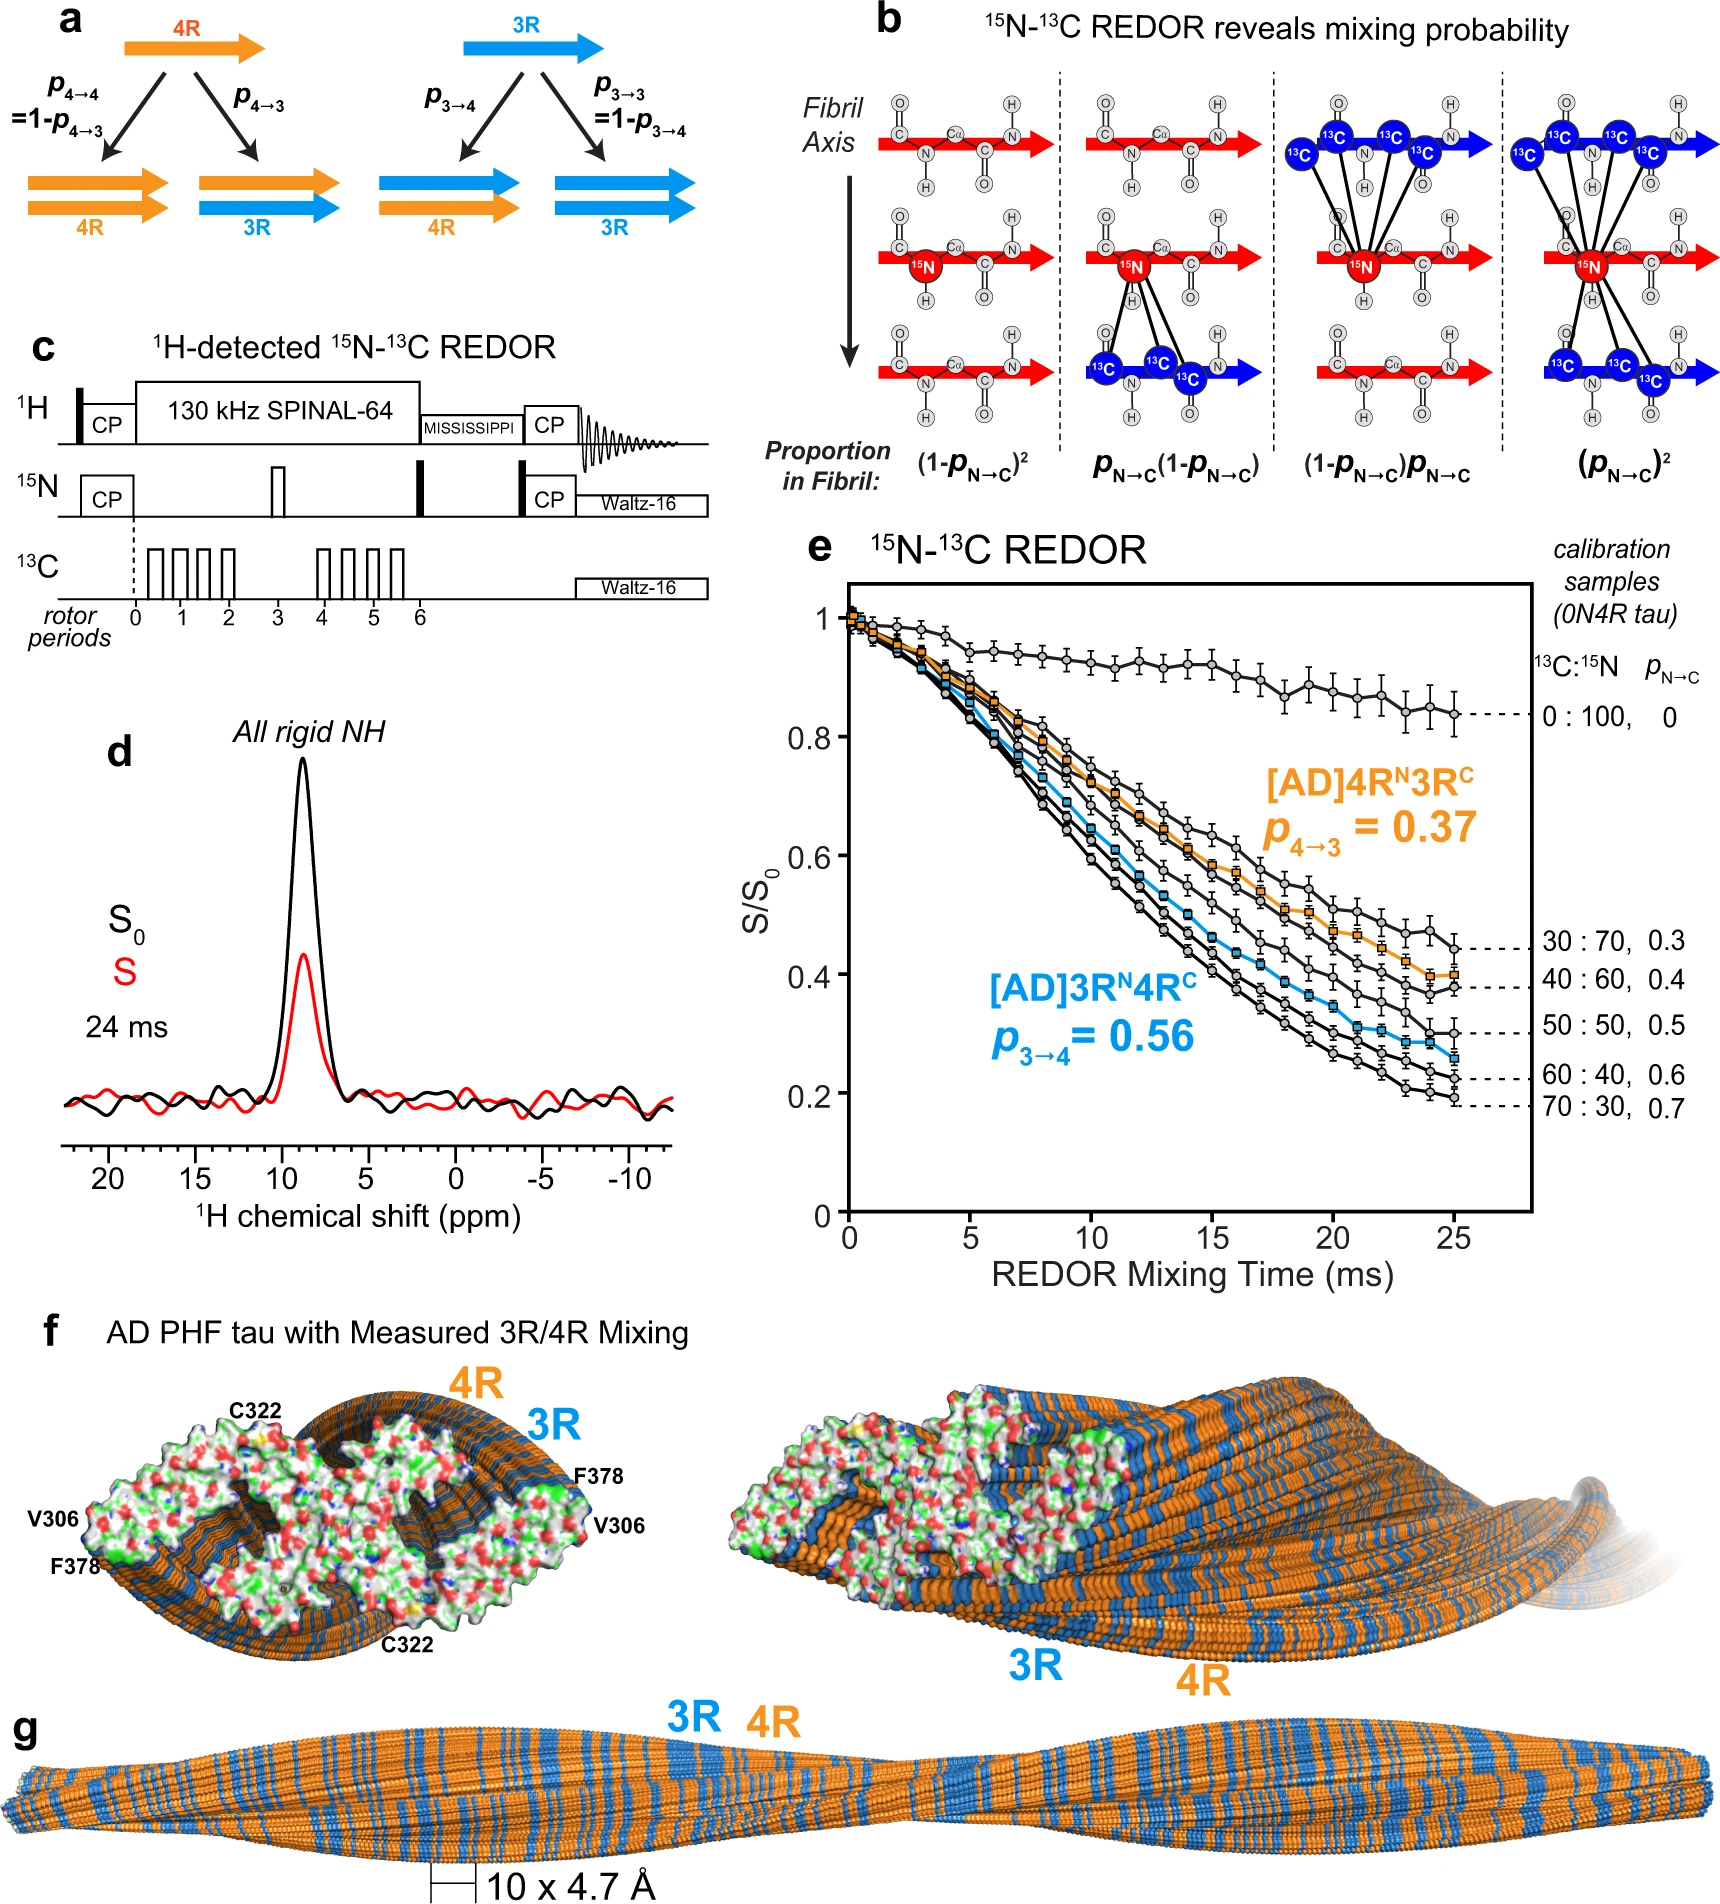
15N–13C REDOR NMR reveals the tau isoform mixing pattern in Alzheimer’s disease brain tau filaments.
a Schematic of four possible isoform combinations of two hydrogen-bonded tau molecules and their probabilities. b Diagram of four possible nearest neighbors of an 15N-labeled tau and their probabilities in a fibril. The probability that an 15N-labeled tau is followed by a 13C-labeled tau is denoted by pN→C. Larger pN→C values increase the intermolecular 15N–13C dipolar dephasing, which is manifested as lower REDOR S/S0 ratios. c Pulse sequence for the 1H-detected 15N–13C REDOR experiment. d A representative pair of the REDOR spectra, showing the total intensities of all rigid protein amides in the absence (S0) and presence (S) of 13C dephasing pulses. This spectrum was measured on [AD]4RN3RC #2 with a mixing time of 24 ms under 20 kHz MAS. e Measured 1H-detected 15N–13C REDOR decay curves. The REDOR data of mixtures of 13C, 2H-labeled 0N4R tau and 15N, 2H-labeled 0N4R tau serve as calibrations (gray) for quantifying pN→C, which is equal to the fraction of 13C-labeled protein in the mixture. The REDOR data of AD-seeded 4RN3RC indicate a probability p4→3of 0.37, while the data of AD-seeded 3RN4RC give a probability p3→4 of 0.56. Each curve represents the average of two independently fibrillized samples. Error bars represent the propagated uncertainty from the spectral signal-to-noise ratio (one standard deviation). f, g Mixing of 4R (orange) and 3R (blue) tau in an AD PHF fibril (PDB: 5O3L). Tau isoforms along the fibril axis were simulated using the measured mixing probabilities. The simulations were done independently for each of the two protofilaments. f End view (left) and oblique view (right) of the PHF tau filaments. The terminal monomers’ atoms are colored as H—white, C—green, N—blue, O—red, and S—yellow. g Sideview of the PHF tau fibril, showing a pair of protofilaments containing 360 monomers each, with a filament length of ~170 nm.
We mixed 50% 15N-labeled 4R tau and 50% 13C-labeled 3R tau in two independently prepared AD-tau seeded samples ([AD]4RN3RC) (Supplementary Table 4). A second pair of AD-tau seeded samples has the reverse mixed labeling motif, containing 50% 15N-labeled 3R tau and 50% 13C-labeled 4R tau ([AD]3RN4RC). We first measured the REDOR dephasing (S/S0) of heparin-fibrillized 0N4R tau samples21,22 containing varying molar ratios of 15N-labeled and 13C-labeled monomers. These samples allow direct experimental calibration of the REDOR dephasing of different statistical mixtures of 15N-labeled protein and 13C-labeled protein. For these 0N4R tau samples, the probability of a 13C-labeled monomer following an 15N-labeled monomer (pN→C) in the fibril is equal to the fraction of 13C-labeled monomers in the mixture. The fact that in vitro-fibrilized tau and AD-seeded tau do not have the same rigid core structure does not affect the use of intermolecular REDOR for determining the statistics of mixing, because the REDOR experiment only depends on the existence of parallel-in-register cross-β packing, which is true for both heparin-fibrillized tau and AD tau.
Figure 3e shows the REDOR dephasing of mixed 13C-labeled and 15N-labeled 0N4R tau samples, whose 13C:15N molar ratios range from 0:100% to 70%:30%. The dephasing curves show the expected trend: the higher the fraction of 13C-labeled tau, the faster the dipolar dephasing, and the lower the S/S0 values. The measured REDOR decay curves can be simulated using the known intermolecular distances in a cross-β amyloid fibril (Supplementary Fig. 3). To do this, we conducted both explicit spin simulations27 and second-moment analysis28. Both methods of simulation reproduce the trend of the mixing-ratio-dependent dipolar dephasing, but do not match quantitatively the measured REDOR dephasing of the calibration samples. This is not surprising, because each simulation method has shortcomings that limit its accuracy (see “Methods”). The explicit spin simulation is restricted to a maximum of about 10 spins, while the second-moment analysis neglects nuclear spin interactions other than 15N–13C dipolar coupling. Moreover, neither simulation captures the effects of natural abundance 13C spins in the 15N-labeled monomer. For these reasons, we rely on the more accurate experimental REDOR results of the calibration samples to extract the mixing probabilities of AD tau filaments.
The spectra of the [AD]4RN3RC samples yielded a REDOR dephasing curve that falls between the calibration curves for 30:70 and 40:60 13C:15N labeled 0N4R tau (Fig. 3e). Interpolation of the measured S/S0 values between the two calibration curves yielded a p4→3 value of 0.37 ± 0.03 (Supplementary Figs. 3 and 4). Thus, in AD-seeded tau filaments, a 4R tau is followed by a 3R tau with 37% probability, and hence by a 4R tau with 63% probability. The reversely mixed labeled [AD]3RN4RC samples showed faster REDOR dephasing: the measured REDOR curve falls between the calibration curves for 50:50 and 60:40 13C:15N 0N4R tau. Interpolation of the two measured calibration curves to match the REDOR dephasing of the AD-seeded sample yielded a p3→4 value of 0.56 ± 0.02. Thus, in the AD-seeded tau filaments, a 3R tau is followed by a 4R tau with 56% probability, and hence by a 3R tau with 44% probability. These data together indicate that each 4R tau monomer is flanked by 63% 4R tau, while each 3R tau monomer is flanked by 56% 4R tau. Therefore, the AD tau filaments, when offered equal amounts of 4R tau and 3R tau monomers, neither completely separate the two isoforms, which would correspond to p4→3 = p3→4 = 0, nor strictly alternate the two isoforms, which would correspond to p4→3 = p3→4 = 1. Moreover, both 4R tau and 3R tau have a small preference for contacting 4R tau. A two-state Markov model (see “Methods”) shows that these probabilities can be converted to the mole fraction of 4R tau in the filament according to 𝜒4=𝑝3→4/(𝑝3→4+𝑝4→3)χ4=p3→4/(p3→4+p4→3), giving a 4R tau mole fraction of 60 ± 2%. Thus, the AD tau filaments incorporate the two isoforms with a 60: 40 molar ratio in favor of 4R tau. This composition is consistent with the estimated 4R and 3R tau incorporation levels from the 15N and 13C spectral intensities (Supplementary Fig. 5 and Supplementary Table 4). Furthermore, because p4→4 (63%) is larger than the overall 4R tau incorporation level (60%) while p3→4 (56%) is smaller than it, there is a small preference for homotypic 4R–4R and 3R–3R contacts over heterotypic 3R–4R contacts. We can alternatively express this preference for homotypic contact in terms of a mixing quotient, 𝑄=𝑝3→4𝑝4→3/𝑝3→3𝑝4→4Q=p3→4p4→3/p3→3p4→4, defined in analogy to the equilibrium constant of mixing. Large Q values indicate a preference for heterotypic mixing while small Q values indicate a preference for block copolymerization. When there is no homotypic or heterotypic preference, i.e., when the mixing is agnostic of the present isoform, then p3→4 = p4→4 = χ4, and Q = 1. The measured p4→3 and p3→4 values correspond to a Q value of 0.75 ± 0.11, indicating a small preference for homotypic contacts, independent of the overall isoform incorporation level. To provide a molecular view of this isoform mixing, we replicated the cryoEM structure of AD PHF tau4 into a long filament containing 360 monomers in each protofilament, and simulated the 4R and 3R tau alternation to match the measured p4→3 and p3→4 values (Fig. 3f, g). The simulation depicts both the larger abundance of 4R tau over 3R tau in the filament and the intimate and fluent molecular mixing of the two tau isoforms.
To assess whether the AD-templated recombinant tau fibrils show isoform-dependent conformation and dynamics, we measured 2D 15N–1H correlation NMR spectra. Dipolar hNH spectra selectively detect rigid β-sheet residues (Fig. 4a–e) whereas J-hNH INEPT spectra selectively detect nearly isotropically mobile residues (Fig. 4f–i). In addition to the mixed isoform samples, we also prepared AD-tau seeded 4R-only tau and 3R-only tau samples. All four seeded tau fibrils show very similar dipolar hNH spectral patterns. For example, the chemical shifts of the resolved Gly peaks are the same. This AD-tau seeded spectral fingerprint is distinct from the peak pattern of heparin-fibrillized 4R tau. For example, the heparin-fibrillized sample shows resolved signals of the only two Cys residues in the protein and their sequential Gly residues (C291–G292 and C322–G323)22. These peaks are absent from the AD-tau seeded spectra. Therefore, the AD tau fold can recruit 3R tau monomers, 4R tau monomers, or a mixture of both, without changing the conformation of the rigid β-sheet core.
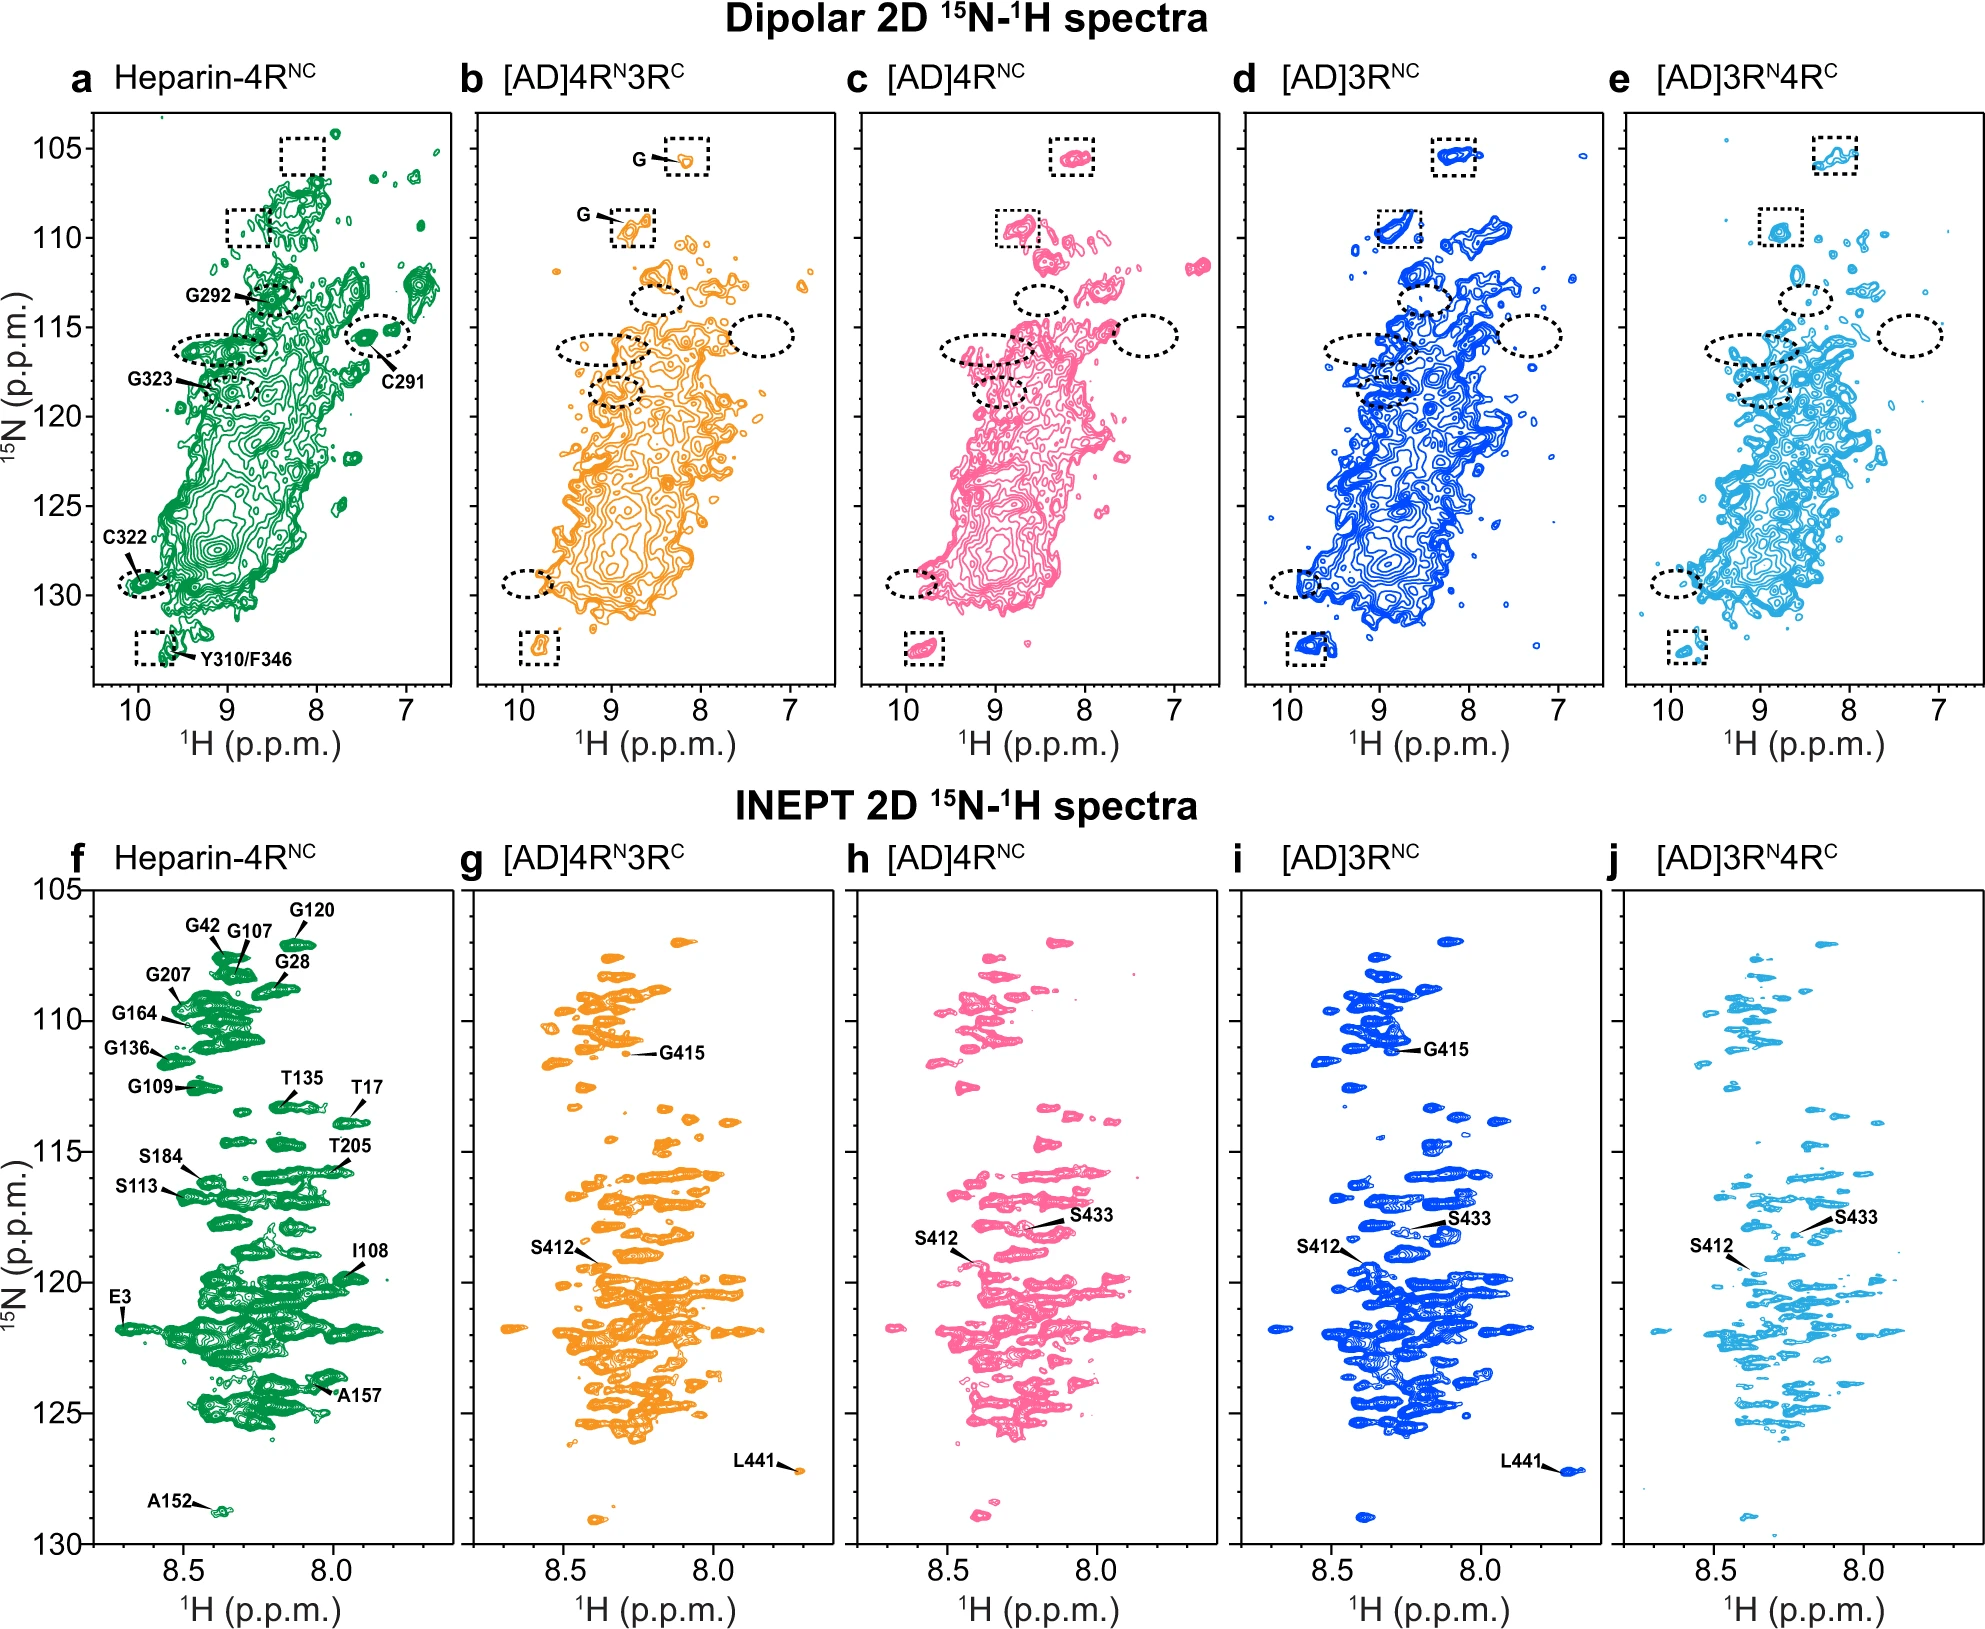
2D 15N-1H correlation spectra of AD-tau-seeded filaments show isoform-independent molecular conformation and dynamics that differ from heparin-fibrilized tau.
a–e 2D dipolar correlation spectra indicate a common rigid-core structure for all isoforms in AD seeded tau. a Heparin-fibrillized 0N4R tau. Several assignments based on 3D hCANH and hCA(co)NH spectra are indicated (Supplementary Fig. 7). b AD-tau seeded 15N-labeled 4R tau mixed with 13C-labeled 3R tau (1:1). c AD-tau seeded 15N, 13C-labeled 4R tau. d AD-tau seeded 15N, 13C-labeled 3R tau. e AD-tau seeded 15N-labeled 3R tau mixed with 13C-labeled 4R tau (1:1). Examples of peaks that are present in heparin-fibrillized tau but not in AD seeded tau are indicated by dashed ovals, while peaks that are present in AD seeded tau but not in heparin-fibrillized tau are indicated by dashed rectangles. f–j 2D INEPT spectra indicate similar dynamic segments for all isoforms in AD-seeded tau. Assignments for clearly resolved peaks are transferred from refs. 29,46. f Heparin-fibrillized 0N4R tau. g AD-tau-seeded 15N-labeled 4R tau mixed with 13C-labeled 3R tau. h AD-tau-seeded 15N, 13C-labeled 4R tau. i AD-tau-seeded 15N, 13C-labeled 3R tau. j AD-tau seeded 15N-labeled 3R tau mixed with 13C-labeled 4R tau. Peaks from residues from the N-terminus to G207 are present in all samples, whereas C-terminal residues show varying intensities among the samples.
The 2D INEPT spectra (Fig. 4f–i) also show similar chemical shifts for the four AD-tau-seeded samples22,23,29, indicating that the fuzzy coat has the same motionally averaged conformation for different tau isoforms. N-terminal residues to G207 at the beginning of the P2 domain exhibit the same chemical shifts and relative intensities. In comparison, C-terminal residues show weaker intensities and larger intensity variations, indicating that the C-terminus is less mobile compared to the N-terminus. In contrast to the dipolar spectra, the INEPT spectra of AD-tau-seeded samples are similar to the INEPT spectrum of heparin-fibrillized tau. Therefore, the mobile part of the fuzzy coat has similar dynamic conformations for all isoforms in both AD tau aggregates and in vitro fibrillized tau.
Discussion
These data provide direct structural evidence of the nature of molecular mixing of 4R and 3R tau in AD brain tau filaments. The 1H-detected 15N-13C REDOR experiment probes the molecular packing of tau isoforms along the fibril axis of AD tau, perpendicular to the C-shaped β-sheet structure4. We find that AD tau filaments recruit 4R and 3R tau monomers with a ratio of 60:40, and with a small preference for homotypic contacts. Moreover, the AD tau fibril incorporates 4R tau, 3R tau, or a mixture of the two isoforms without changing the β-sheet core structure, as seen by the similarity of the 2D dipolar hNH spectra (Fig. 4). Thus the AD tau prion incorporates either tau isoform into its pathological fold, without cross-seeding barrier between them, in contrast to in vitro assembled tau fibrils30,31,32. This fluent molecular mixing explains the biochemical observation that AD tau fibrils amplified with 4R tau, 3R tau, or both are equally capable of seeding both 4R and 3R mouse tau18,19,25. We hypothesize that this fluent mixing may promote fibril growth in vivo and play a role in making AD the most prevalent neurodegenerative disorder in humans.
Because the NMR data were obtained from AD tau seeds pooled from multiple patient brains, the 60:40 mixing and the probabilities we measured reflect the general properties of AD brain tau fibrils instead of the property of a single patient brain. The AD-seeded tau fibrils show highly reproducible 2D NMR spectra as well as reproducible REDOR dephasing, suggesting that there is no detectable molecular structural variation among the multiple AD brains. Although some biochemical studies have reported certain levels of heterogeneity in AD brain tau, these observations were all made based on total tau, including both pathogenic and non-pathogenic tau, in AD patients33,34. Our study instead focuses on sarkosyl-insoluble tau, which has been shown to have highly consistent fibril core structures across multiple AD patient cases5, and which exhibits consistent seeding abilities in vitro and in vivo19. Therefore, these prior biochemical and biophysical data provide additional support for the isoform-independent molecular structure observed here.
The 4R and 3R tau mixing probabilities we measured here are based on the assumption that the number of residues that contributes to the β-sheet core is the same for 4R and 3R tau in the AD-tau seeded fibrils. If the number of residues in the core differs between 4R and 3R tau, then the mixing probabilities would differ from the reported value. For example, if 4R tau incorporates more β-sheet residues into the fibril core than 3R tau, then the [AD]4RN3RCREDOR S/S0 intensities would be biased high, and the true p4->3 value would be larger than the measured value. Similarly, the true p3->4 would be smaller than the measured value. However, three observations suggest that it is unlikely for the two isoforms to have different fibril core sizes. First, tau filaments obtained from multiple AD brains have been shown by cryoEM to have the same β-sheet core, without signs of structural heterogeneity4,5. Second, the 2D hNH dipolar and INEPT spectra measured here (Fig. 4) show similar spectral peak patterns for the mixed isoform samples and the single isoform samples. Thus, the AD tau seeds are able to propagate by either isoform to develop the same structure. Third, the AD tau seeds are well amplified in our current study, which would be difficult to achieve if a monomer of the opposite isoform is added to the growing fibril with a different core size than the current isoform.
The moderate over-incorporation of 4R over 3R tau into the AD tau filament is consistent with fluorescence data of mammalian cells expressing 4R and 3R tau repeat domains. These data showed that both 4R and 3R tau are aggregated by AD brain extracts, but overexpression of 4R tau increased the total amount of the aggregates more than 3D tau did16. It is also consistent with the observation that 4R tau isoforms have faster fibril nucleation rates and elongation rates than 3R tau isoforms in vitro35,36.
The isoform-independent propagation of the AD tau structure and pathological properties is noteworthy. The R2 domain contains a fibrillary hexapeptide motif like the R3 domain37,38,39. Thus, if a series of 4R tau monomers is added to the elongating filament, we would expect their R2 domains to begin to form cross-β hydrogen bonds and join the rigid core. This should gradually lead to a new fibril structure that prefers to incorporate 4R tau instead of 3R tau. The 2D NMR spectra measured here indicate that the AD tau is able to avoid this fate, even when only 4R tau monomers are added to the seed. The molecular mechanism for this avoidance is still unclear. It is possible that the posttranslational modification pattern of AD tau favors 4R tau incorporation36 as well as predisposing the seeded structure to prevent the incorporation of the R2 domain into the β-sheet core. The AD tau fold may have evolved over its slow replication phase40 to adapt to the environment of the AD brain41. The fluent molecular mixing of both 4R and 3R tau isoforms and the preservation of the β-sheet conformation regardless of the isoform could potentially be an adaptive trait to optimize prion growth and propagation. The significant amplification of the morphology and toxicity of AD tau filaments shown here opens new avenues for future characterization of the molecular structure of AD tau using a wide range of biophysical methods.