
Faulty autolysosome acidification in Alzheimer’s disease mouse models induces autophagic build-up of Aβ in neurons, yielding senile plaques
By Ju-Hyun Lee, Dun-Sheng Yang, Chris N. Goulbourne, Eunju Im, Philip Stavrides, Anna Pensalfini, Han Chan, Cedric Bouchet-Marquis, Cynthia Bleiwas, Martin J. Berg, Chunfeng Huo, James Peddy, Monika Pawlik, Efrat Levy, Mala Rao, Mathias Staufenbiel, and Ralph A. Nixon
Excerpt from the article published in Nature Neuroscience (2022). Published: , DOI: https://doi.org/10.1038/s41593-022-01084-8
Editor’s Highlights
- Alzheimer’s disease (AD) is defined neuropathologically by two lesions: intracellular tau aggregates (neurofibrillary tangles) and neuritic plaques composed of focally swollen (dystrophic) neurites (DNs)8, extracellular β-amyloid and many other proteins.
- Aditionally, in yet still intact neurons, profuse Aβ-positive autophagic vacuoles (AVs) containing incompletely digested autophagy substrates accumulate progressively packed into large membrane blebs forming flower-like perikaryal rosettes within affected neurons at the earliest disease stage and promoting senile amyloid plaques.
- Progressive failure of an initially neuroprotective autophagy response in neurons is accompanied by an evolution of these poisonous rosettes toward neuronal cell death involving lysosomal (LYs) membrane permeabilization, cathepsin release and, ultimately, glial invasion and extracellular plaque formation and expansion.
- LYs are targets of causative gene products and risk factors for AD, including the pathogenic amyloid precursor protein (APP) metabolites APP-βCTF and Aβ that are actively generated within endosomal and autophagic pathways and are normally cleared by LYs.
- A pathogenic link between APP metabolites and LY dysfunction is essential in AD progression.
Abstract
Autophagy is markedly impaired in Alzheimer’s disease (AD). Here we reveal unique autophagy dysregulation within neurons in five AD mouse models in vivo and identify its basis using a neuron-specific transgenic mRFP-eGFP-LC3 probe of autophagy and pH, multiplex confocal imaging and correlative light electron microscopy. Autolysosome acidification declines in neurons well before extracellular amyloid deposition, associated with markedly lowered vATPase activity and build-up of Aβ/APP-βCTF selectively within enlarged de-acidified autolysosomes. In more compromised yet still intact neurons, profuse Aβ-positive autophagic vacuoles (AVs) pack into large membrane blebs forming flower-like perikaryal rosettes. This unique pattern, termed PANTHOS (poisonous anthos (flower)), is also present in AD brains. Additional AVs coalesce into peri-nuclear networks of membrane tubules where fibrillar β-amyloid accumulates intraluminally. Lysosomal membrane permeabilization, cathepsin release and lysosomal cell death ensue, accompanied by microglial invasion. Quantitative analyses confirm that individual neurons exhibiting PANTHOS are the principal source of senile plaques in amyloid precursor protein AD models.
Main
Autophagy is the principal pathway for lysosomal degradation, maintaining cellular homeostasis by constitutively turning over obsolete proteins and organelles. It is induced further by disease and cell stress to eliminate abnormal proteins, aggregates and damaged organelles1,2,3,4. Autophagy encompasses several mechanisms for sequestering substrates and their delivery to lysosomes (LYs). In the major autophagy–lysosomal pathway (ALP), macroautophagy, an elongating double membrane envelops cytoplasm or, via adaptor protein, engages specific targeted substrates and then closes to form an autophagosome (AP). APs mature to autolysosomes (ALs) upon fusion with LY or endolysosome, which introduces varied cathepsin proteases, other acid hydrolases and vATPase, the proton pump that acidifies AL lumens and activates the hydrolases. LYs are targets of causative gene products and risk factors for AD5, including the pathogenic amyloid precursor protein (APP) metabolites APP-βCTF and Aβ6 that are actively generated within endosomal and autophagic pathways and are normally cleared by LYs7.
AD is defined neuropathologically by two lesions: intracellular tau aggregates (neurofibrillary tangles) and neuritic plaques composed of focally swollen (dystrophic) neurites (DNs)8, extracellular β-amyloid and many other proteins9. Additionally, AVs containing incompletely digested autophagy substrates accumulate progressively within affected neurons at the earliest disease stage5,10,11,12. The molecular basis for autophagy dysfunction in AD, its relationship to APP/amyloid pathology and its pathogenic implications are unclear due, in part, to technical challenges of monitoring ALP abnormalities in vivo in brain. To overcome these limitations, we generated transgenic mice (TRGL) with neuron-specific expression of tandem fluorescence-tagged LC3 (mRFP-eGFP-LC3 or tfLC3), an autophagy adaptor protein selectively associated with AP and AL13. The tfLC3 probe enabled us to investigate individual vesicular components of the neuronal ALP in intact brain and, to our knowledge for the first time, assess AL acidification ratiometrically in neurons throughout disease progression in mouse AD models.
To identify and monitor AD-related ALP deficits, we crossed TRGL and AD model mice that develop either early-onset or late-onset disease pathology. In all five AD mouse models studied, we demonstrated early-appearing deficiencies of lysosomal vATPase activity, autophagy dysfunction in vulnerable neuron populations and accumulation of APP-βCTF and Aβ selectively within poorly acidified AL (pa-AL) well before extracellular β-amyloid deposition. Furthermore, we identified a unique autophagic stress response in more compromised neurons characterized by fulminant proliferation of AVs within perikarya and formation of large membrane blebs packed with Aβ/APP-βCTF-filled AVs. The strongly fluorescent petal-like blebs surrounding a DAPI-positive fluorescent nucleus generate flower-like profiles that we term ‘PANTHOS’ (poisonous flower). Notably, AV fusion with endoplasmic reticulum (ER) yields intraluminal formation of β-amyloid fibrils in a tubular network surrounding the nucleus, yielding morphologic features of a cored amyloid plaque within the intact neuron. Using an extensive array of imaging and histochemical techniques, we establish quantitatively that PANTHOS neurons are the origin of the vast majority of senile plaques in AD mouse models, thus prompting a reconsideration of the conventionally accepted sequence of events in plaque formation in AD.
Results
Detecting in vivo ALP dysfunction
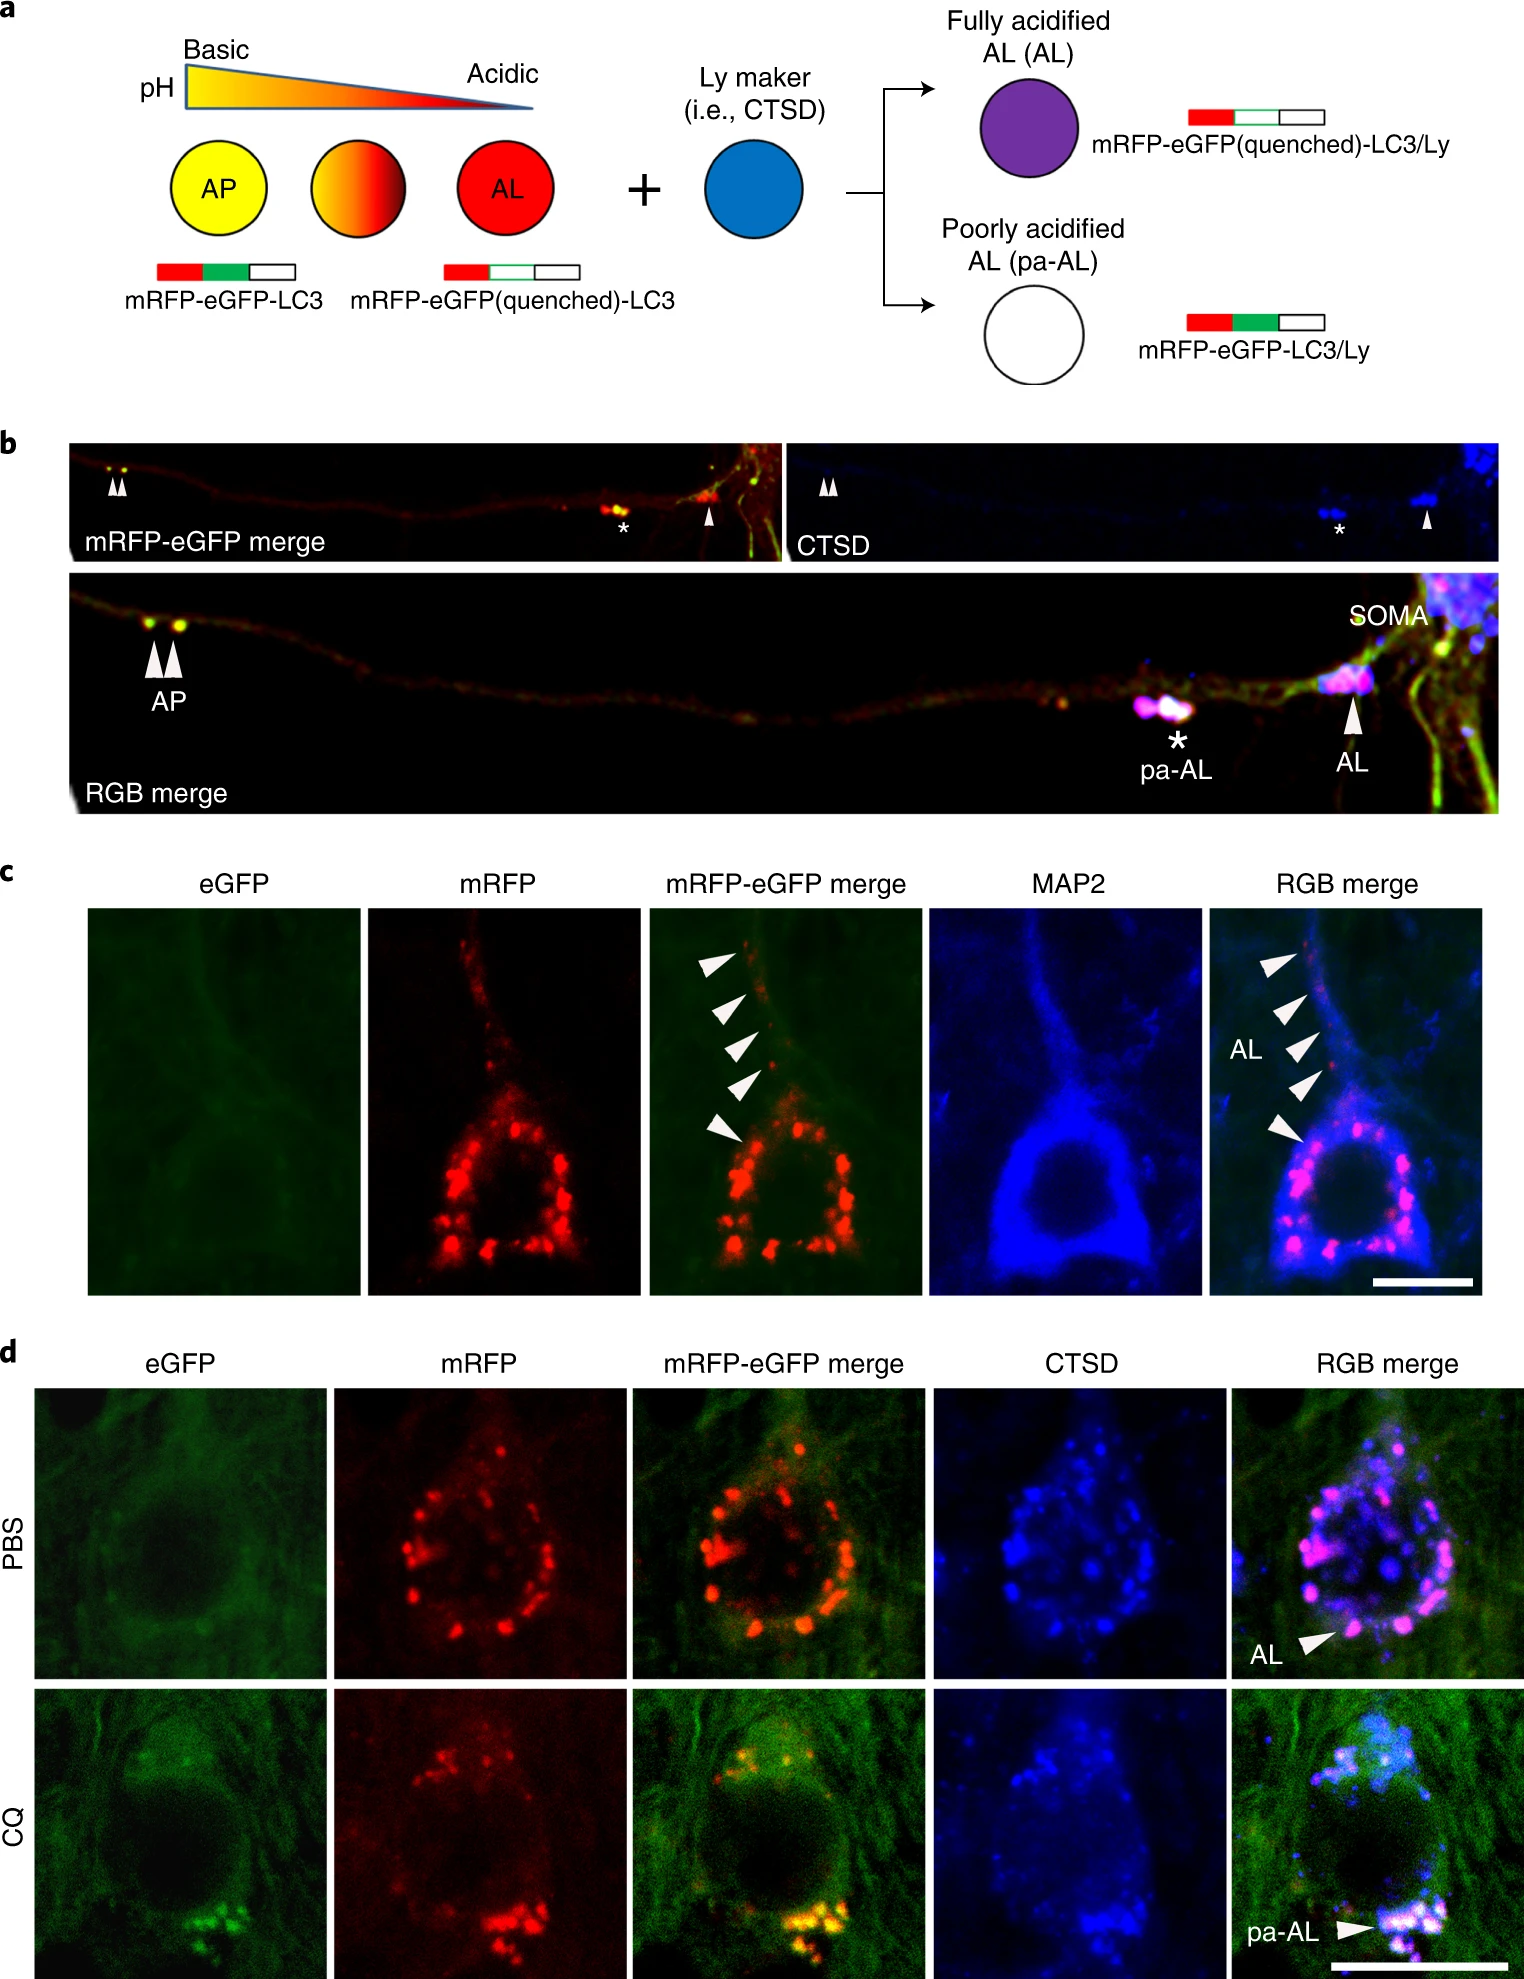
A tandem mRFP-eGFP-LC3 transgene (tfLC3) driven by the THY-1 promoter is postnatally expressed specifically in neurons. tfLC3 is expressed approximately one-fold higher than endogenous LC3 levels and has no detectable effects on the ALP13. Like endogenous LC3, tfLC3 binds to AP membranes and persists after AP–LY fusion as an internalized substrate degraded within AL, ultimately yielding non-fluorescent LYs. The tfLC3 on AP fluoresces yellow-green (eGFP/mRFP) at the neutral pH of AP, but AL maturation upon fusion with LY14acidifies the AL, causing fluorescence shifts from yellow to orange and then to red as eGFP fluorescence is quenched below pH 6.0 (ref. 15). LYs after autophagic clearance of fluorescent LC3 or after new LY biogenesis can be visualized by immunohistofluorescence (IHF) labeling with LY markers (for example, cathepsin D (CTSD) or LAMP 2) tagged with a third fluorophore. Notably, this third fluorophore also differentiates the yellow-fluorescing AP from an AP that fuses with an LY and is cathepsin-positive but fails to acidify adequately and, thus, fluoresces yellow by tfLC3 labeling alone (Fig. 1a)13,14. The latter profile is classified as a pa-AL.
Design and expression of dual-tagged autophagy sensor in TRGL mouse brain.
a, Schematic representation of the tfLC3 color change. The sensor is composed of pH-resistant mRFP, pH-sensitive eGFP and LC3. An acidic environment triggers the quenching of the eGFP signal, resulting in the conversion of net yellow signal to red-only signal. In combination with LY marker (pseudo-blue), fully acidified AL (AL) or poorly acidified AL (pa-AL) produce purple or white color, respectively. b, tfLC3 fluorescence change in primary neurons. APs (double arrowheads) were seen at distal levels of axons, and pa-ALs (asterisk) were seen at more proximal levels, whereas fully acidified ALs (arrowhead) were predominantly located near or in the perikaryon. c, Representative fluorescence images from neocortical layer V neurons of TRGL mice co-labeled with the cytoskeleton marker MAP2. Arrowhead denotes fully acidified AL (AL). Scale bar, 10 μm. d, Representative fluorescence images of the tfLC3 fluorescence change under lysosomal acidification altered conditions (CQ) in TRGL mouse brain. Arrowheads denote AL or pa-AL. Scale bar, 20 μm. b–d, Experiment was repeated three times independently with similar results.
AP maturation and acidification are most easily appreciated when the transition from AP to AL is protracted during retrograde axonal transport in primary neuronal cultures of TRGL mice (Fig. 1b). AVs are much fewer in vivo in the intact mature brain16. Fully acidified AL is concentrated within perikarya and proximal dendrites in neurons (Fig. 1c, arrowhead). ALs fluoresce purple (combined red and blue) in a three-fluorophore (RGB) analysis of neocortical perikarya, reflecting an efficient perikaryal acidification mechanism (Fig. 1d, top). To model an AL/LY acidification deficit in vivo and validate the tfLC3 probe in intact brain in vivo, 6-month-old TRGL mice were administered the amphiphilic weak base chloroquine (CQ) or the vehicle alone (controls) by intraventricular infusion for 5 days, and neurons in neocortical layers III–V were imaged (Fig. 1d). A rise in vesicle pH above 6.0 causes tfLC3-positive puncta to fluoresce yellow. Based on a green/red channel merge alone, these puncta would be mis-identified as AP; however, IHF with a CTSD antibody and Alexa Fluor 647 (pseudo-blue) secondary antibody identifies these puncta as CTSD-positive and, therefore, as pa-AL. In a three-channel merge, they fluoresce white (green, red and blue fluorescence) (Fig. 1d, RGB merge bottom), contrasting with the purple acidified AL in normal neurons (Fig. 1d, RGB merge top). LYs remain blue after CQ, reflecting their pH-insensitive detection by IHF (Fig. 1d). A computer algorithm13 determines for each vesicle the relative contributions of the three fluorophores based on their hue angle and saturation, which is a more precise objective representation of ‘color’ (and vesicle identity) than achieved by visual perception.
AL acidification deficiency arises before β-amyloid deposits
We crossed TRGL mice13 with Tg2576 mice17, an AD model that develops β-amyloid plaques starting at 10~12 months of age. ALP patterns in 1.6-month-old Tg2576/TRGL crosses were indistinguishable from single-TRGL littermates (Extended Data Fig. 1a); however, by 5 months of age, more than 90% of neocortical layer III–V perikarya had acquired yellow fluorescent AVs in addition to acidified ALs (Extended Data Fig. 1a). CTSD co-labeling revealed that the yellow AVs are exclusively CTSD-positive and, therefore, pa-ALs (Fig. 2a, bottom panels). pa-AL was also positive for CTSB and the lysosomal membrane protein LAMP1 (Extended Data Fig. 1b). Hue-angle-based assignment and quantification of AV subtypes in neocortex13 revealed four-fold more pa-ALs in Tg2576/TRGL (9.0 ± 0.5 per neuronal cross-section) than in TRGL (2.1 ± 0.3), significantly fewer mature ALs (4.4 ± 0.4 versus 6.6 ± 0.3 per neuronal cross-section) (Fig. 2b) and increased size of pa-ALs and ALs (1.3 ± 0.04 versus 0.48 ± 0.03 and 1.75 ± 0.09 versus 0.74 ± 0.05, respectively) (Fig. 2c). By 12 months, perikaryal pa-ALs further increased in Tg2576/TRGL (17.2 ± 0.7 per neuronal cross-section) (Fig. 2e,f). To further document AL acidification deficits in Tg2576 brain, we isolated AL/LY-enriched fractions by OptiPrep density centrifugation (Extended Data Fig. 1c) and assayed their ATPase activity18. Consistent with observed pH deficits, vATPase activity in LY/AL of 6-month-old Tg2576 was decreased (65.6 ± 4.1%) compared to that of age-matched wild-type (WT) littermates (Fig. 2d) and decreased further by 12 months in Tg2576 mouse brain (45.3 ± 3.7% relative to WT) (Fig. 2g). ATPase activity was similarly reduced in brains from two other mouse models of AD (5xFAD and APP51) (Extended Data Fig. 1d). The time course graph indicates age-dependent increased prevalence of pa-AL while vATPase activity declines (Fig. 2h).
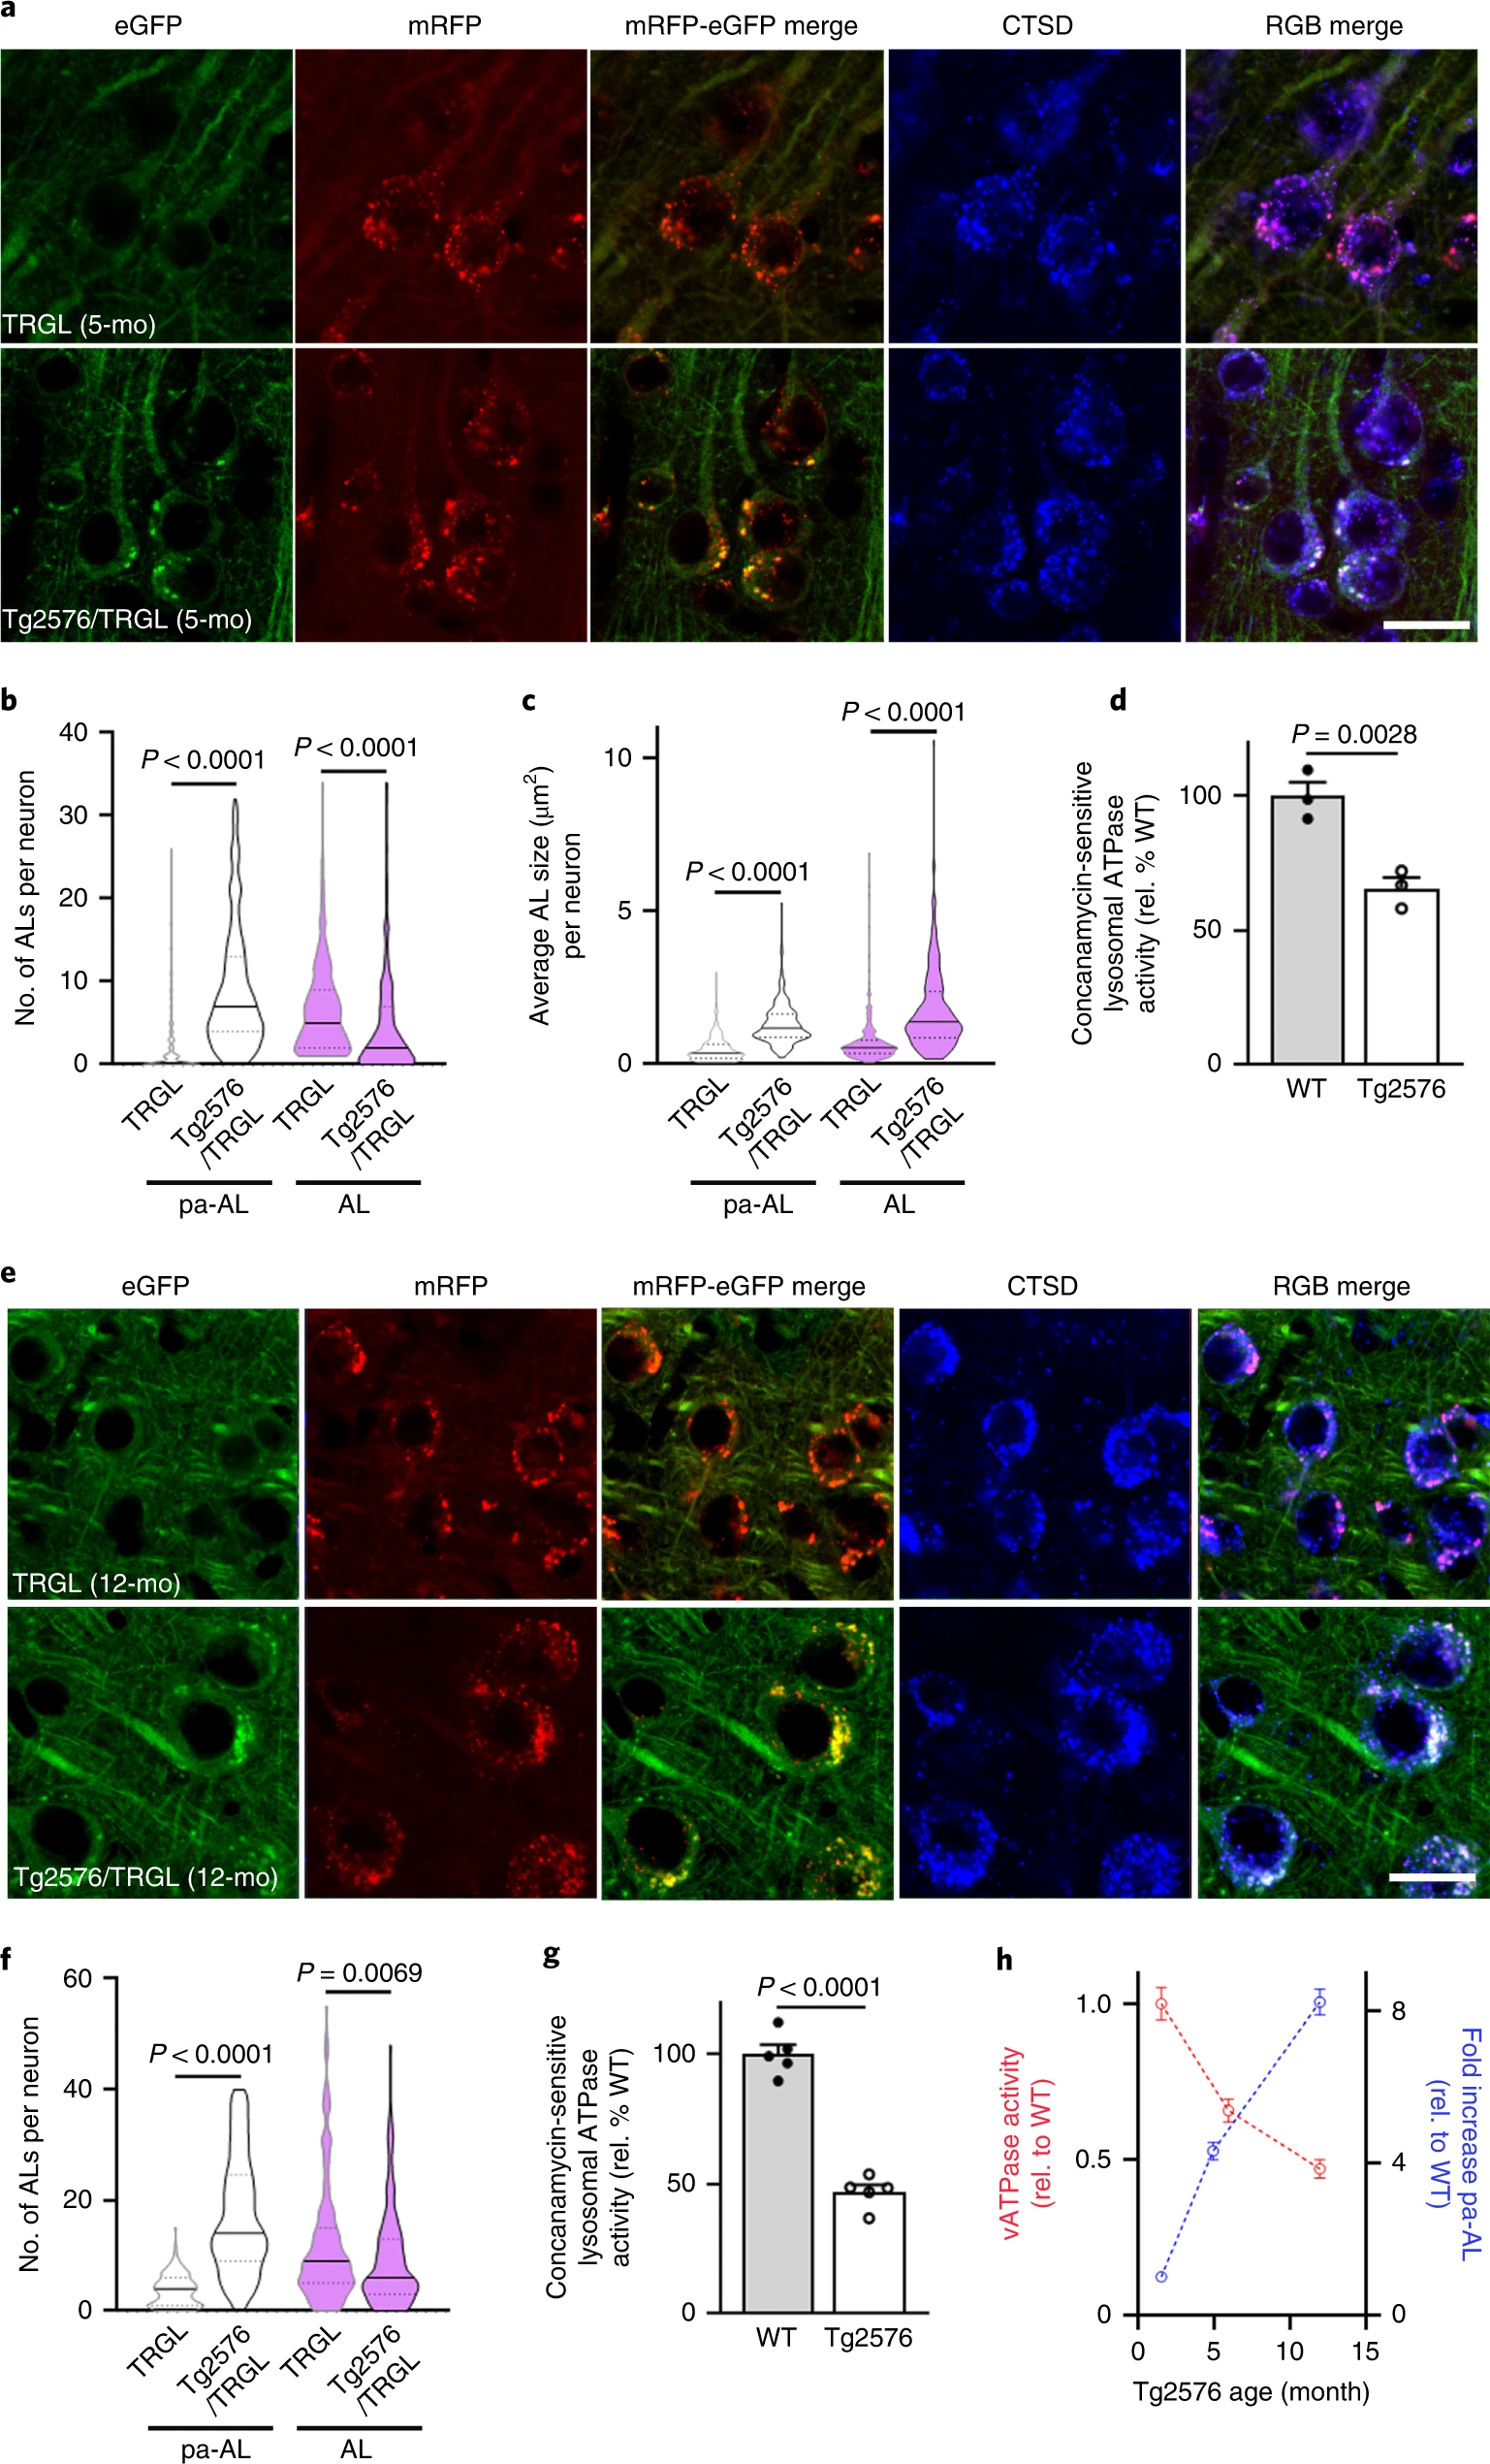
AL acidification deficits develop early in AD model mice and progress with age.
a, Representative fluorescence images of tfLC3, co-labeled with CTSD, in neocortical neurons of 5-month-old TRGL and Tg2576/TRGL mouse brains. ALs exhibit a red or purple color without or with CTSD co-localization, respectively, whereas pa-ALs exhibit a yellow or white signal depending on CTSD co-label, respectively. Scale bar, 20 μm. b, Number of pa-ALs in 5-month-old Tg2576/TRGL is elevated compared to neurons in TRGL littermates. n = 243 (TRGL) and n = 245 (Tg2576/TRGL) neurons from three mice. c, pa-AL size in 5-month-old Tg2576/TRGL are larger than neurons in TRGL littermates. n = 243 (TRGL) and n = 245 (Tg2576/TRGL) neurons from three mice. d, Lysosomal vATPase activity is decreased in 6-month-old male Tg2576 compared to WT littermate neocortex. n = 3 mice. e, Representative fluorescence images of 12-month-old TRGL and Tg2576/TRGL mouse brains. Scale bar, 20 μm. f, Number of pa-ALs in 12-month-old Tg2576/TRGL are elevated compared to TRGL littermate neocortical neurons and to 5-month-old Tg2576/TRGL. n = 202 (TRGL) and n = 213 (Tg2576/TRGL) neurons from three mice. g, Lysosomal vATPase activity is decreased in 12-month-old male Tg2576 compared to WT littermates (and greater than in 6-month-old Tg2576). n = 5 mice. Violin plot colors correspond to the colors of the puncta (white: pa-AL; purple: AL). h, Time course analysis of vATPase activity and pa-AL number in Tg2576 mice. vATPase activity: n = 3 (1.6 months and 5 months) and n = 5 (12 months). pa-AL: n = 243 (1.6 months), n = 245 (5 months) and n = 213 (12 months). Quantitative data are presented as means ± s.e.m., unpaired t-test, two-tailed P value as indicated. a, e, Experiment was repeated three times independently with similar results. See also Extended Data Fig. 1. mo, month; rel., relative.
Source data
APP-βCTF/Aβ accumulate in pa-AL at early stages of disease
APP-βCTF and Aβ accumulate intracellularly before β-amyloid is deposited extracellularly in AD, with the endosomal–lysosomal system representing the main subcellular site for their generation19,20,21. To relate APP-βCTF/Aβ intracellular accumulation to early AL acidification deficits in Tg2576 mice, we localized APP metabolites within AV subtypes using a monoclonal antibody (JRF/AβN/25) that detects APP-βCTF and Aβ22. By 5 months, 40% of layer III–V neocortical perikarya in Tg2576/TRGL mice contained Aβ/APP-βCTF-positive puncta (Fig. 3a), which were almost exclusively pa-AL (88.6 ± 2.4%) based on CTSD co-immunolabeling and imaging of four fluorophores (Fig. 3a, arrows, and Fig. 3b). Immunoblot analyses on subcellular fractions from Tg2576 brains confirmed that LC3-II enriched AV fractions contain abundant APP-βCTF as well as γ-secretase components (presenilin 1 and nicastrin) (Fig. 3c) and Aβ (Extended Data Fig. 2a). Aβ localization in AVs was further validated by Aβ1-42 antibody (JRF/cAβ42/26) (Extended Data Fig. 2b, arrowhead). Also, APP-βCTF localization in AVs was further validated by an in situ proximity ligation assay (PLA) using a modified Duolink technology (Methods) involving two primary antibodies directed against different epitopes (N-terminus or C-terminus) on APP-βCTF (Fig. 3d). PLA fluorescence (red) detected APP-βCTF in APPswe-overexpressing N2A cells and Tg2576 neurons at considerably higher levels than in controls (Fig. 3e, arrowheads, and Extended Data Fig. 2c,d). Notably, PLA signal (blue) revealed that APP-βCTF selectively accumulated in ALs that were poorly acidified in Tg2576/TRGL perikarya (92.9 ± 1.3%, n = 50 neurons) (Fig. 3f and Extended Data Fig. 2e–g).
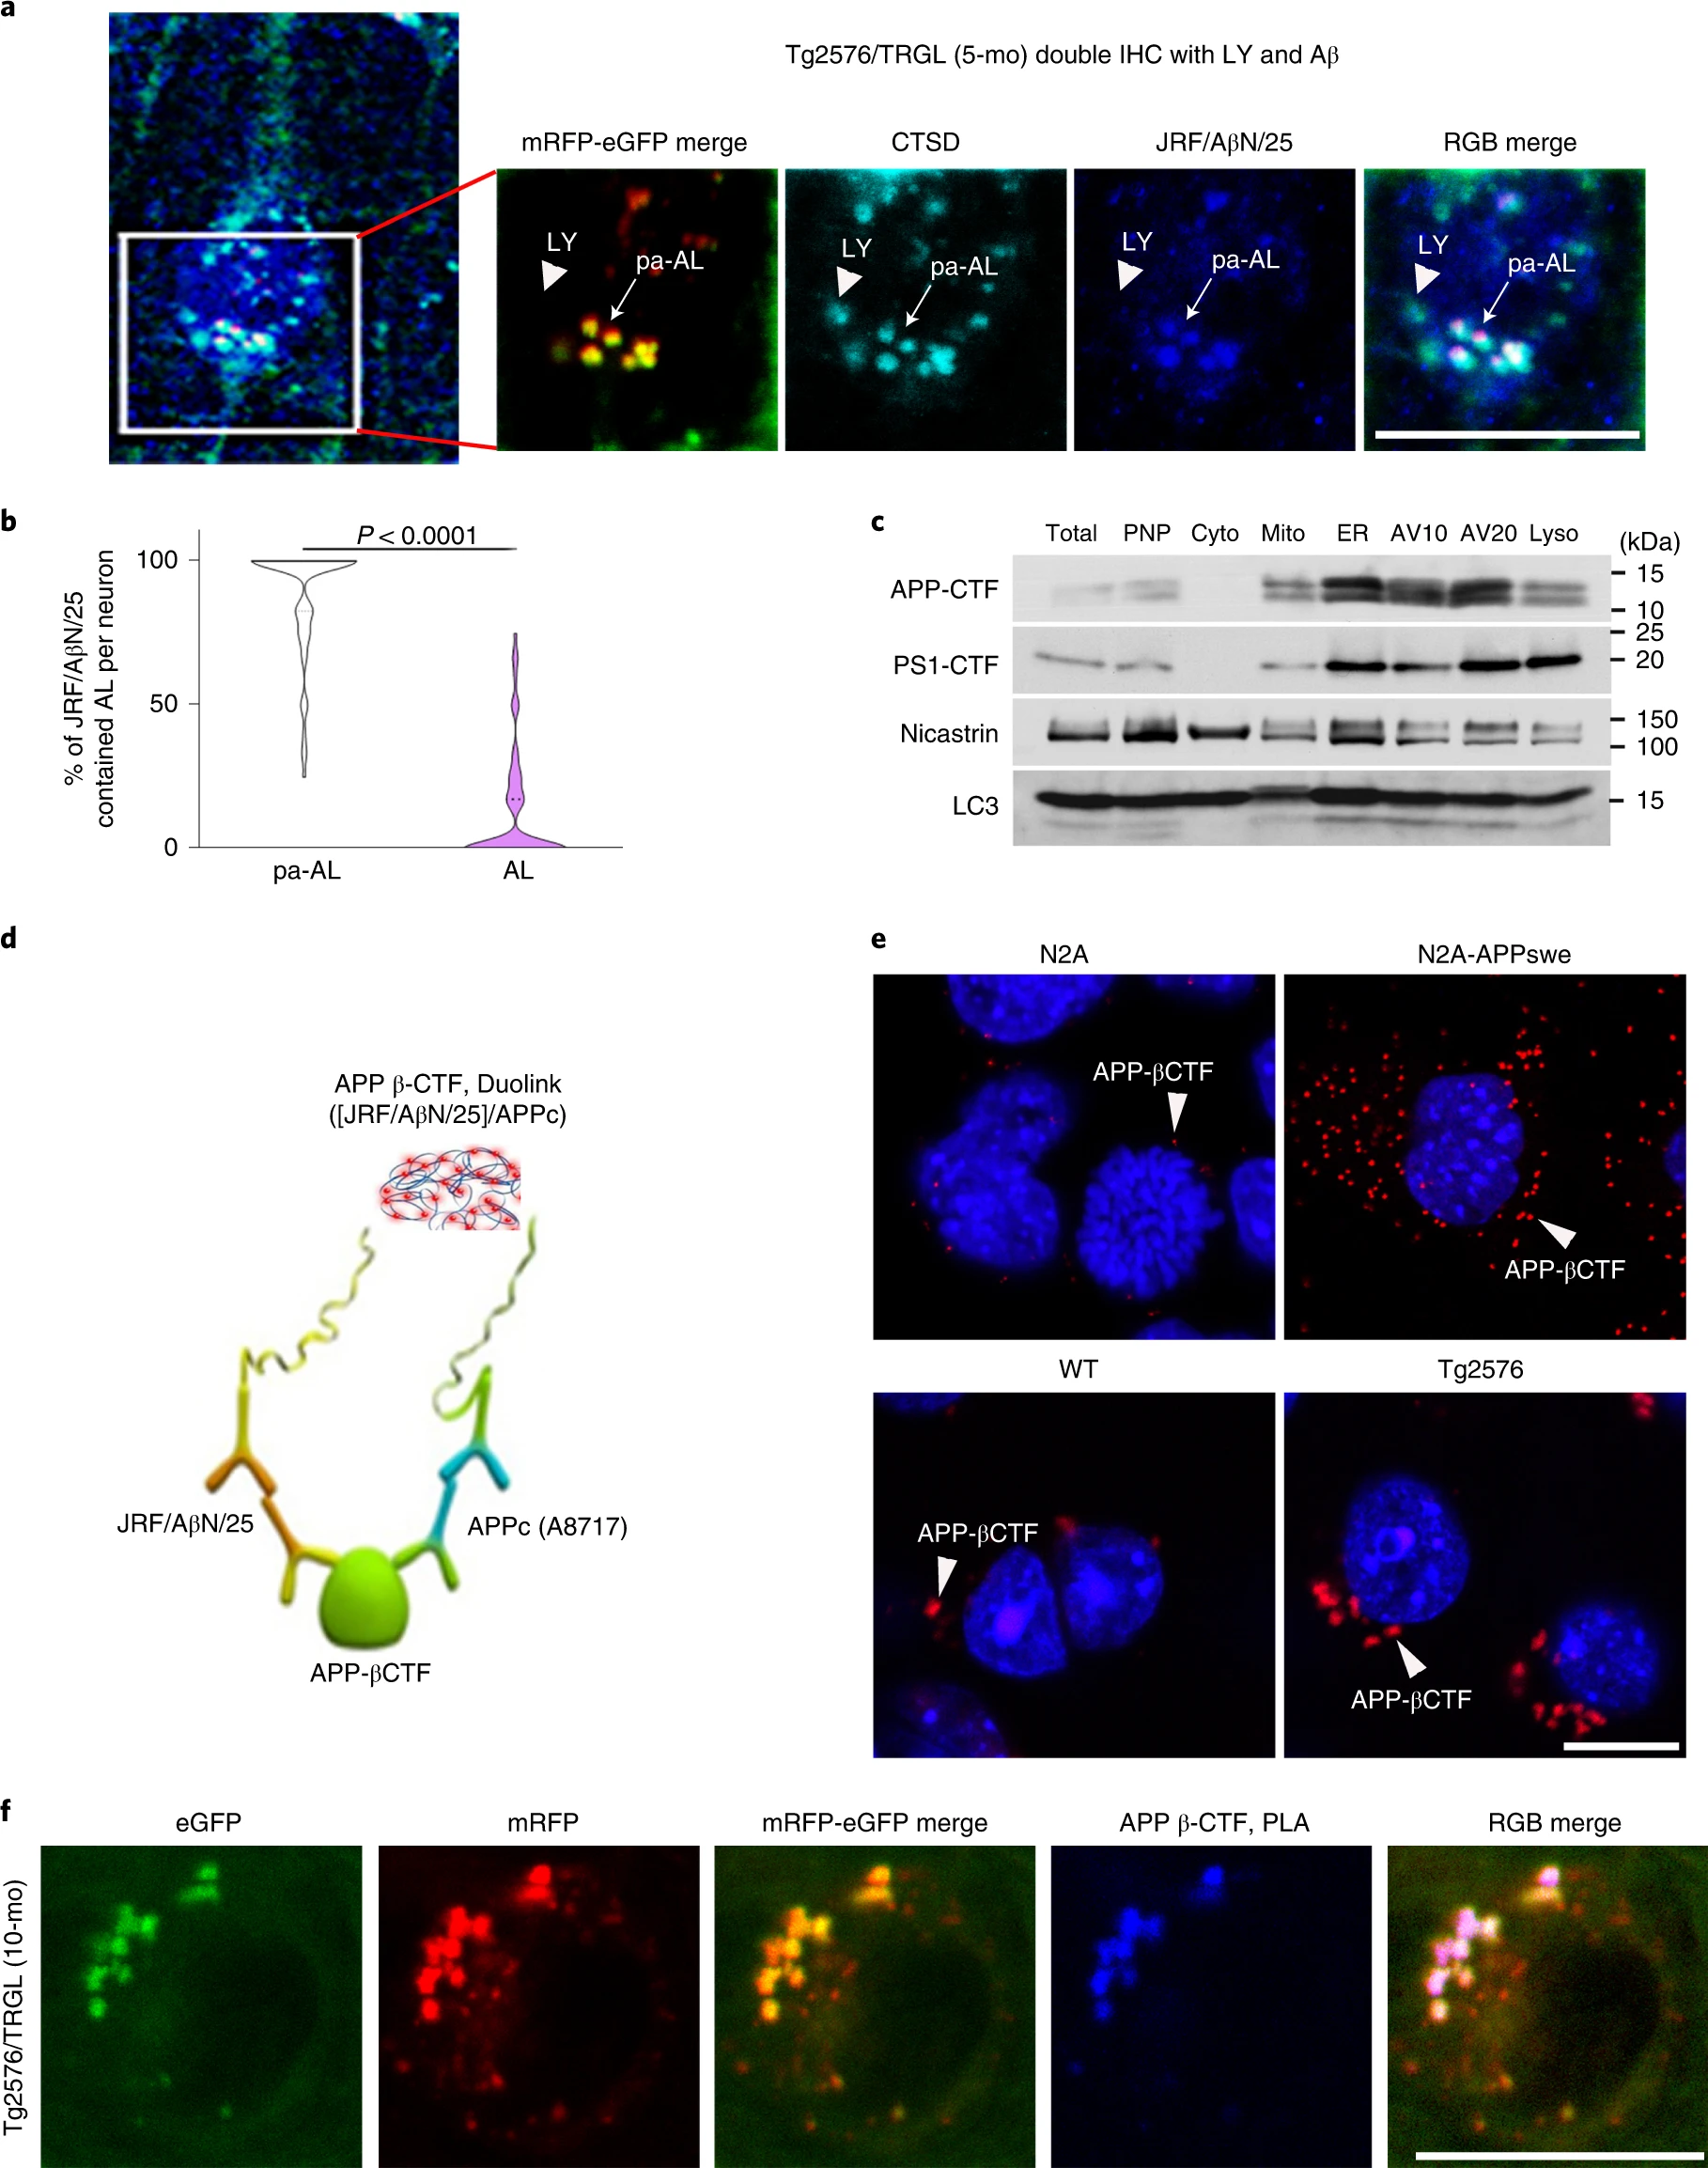
Intraneuronal APP-βCTF/Aβ accumulates selectively within pa-AL in AD mice.
a, Immunofluorescence co-labeling of 5-month-old Tg2576/TRGL mouse brain neurons with a CTSD antibody and JRF/AβN/25 antibody against APP-βCTF/Aβ. APP-βCTF/Aβ accumulates in enlarged pa-ALs producing a white signal (arrow), whereas it is absent from LYs (arrowhead). Scale bar, 20 μm. b, Percentage of AL and pa-AL subtypes positive for JRF/AβN/25 immunoreactivity in neurons of 5-month-old Tg2576/TRGL mouse brains. n = 66 neurons from three mice. Violin plot colors correspond to the colors of the puncta (white: pa-AL; purple: AL). Quantitative data are presented as means ± s.e.m., unpaired t-test, two-tailed P value as indicated. c, AV fractionation from 10-month-old Tg2576 mice. Fractions were obtained by pooling five mouse brains. The experiment was repeated two times independently with similar results. d, Schematic representation of the PLA performed using JRF/AβN/25 for APP-βCTF N-terminus and APPc for APP-βCTF C-terminus. e, Representative PLA fluorescence images from N2A-APPswe cells and 10-month-old Tg2576 mouse brain compared to WT controls. Arrowheads denote PLA signal for APP-βCTF. Scale bar, 20 μm. f, Representative PLA fluorescence images from Tg2576/TRGL mouse brain. PLA signals were co-localized with pa-AL, resulting in white puncta. Scale bar, 20 μm. a, c, e, f, The experiment was repeated three times independently with similar results. See also Extended Data Fig. 2. IHC, immunohistochemistry; mo, month.
Source data
Progressively compromised neurons massively accumulate pa-AL
In 10-month-old Tg2576/TRGL mice, a subpopulation of neocortical neurons (layer III–V) began to accumulate substantially enlarged pa-ALs, which bulge the plasma membrane outward (Fig. 4a, enlarged right panel, arrowhead). The further massive proliferation of LC3-positive vesicles was accompanied by formation of large strongly fluorescent membrane blebs that project from the plasma membrane and expand perikaryal circumference. A central nuclear region devoid of LC3 fluorescence (Fig. 4a) could be labeled by nuclear markers, including DAPI, histone H3 or lamin A/C (Fig. 4b,c). The absence of autofluorescence in this nuclear area excluded the possibility that DAPI signal was non-specific autofluorescence due to amyloid (Extended Data Fig. 3a). Most AVs in affected perikarya were LY-marker-positive by IHF, indicating that they were pa-ALs (Fig. 4d and Extended Data 3b), which reflects a severe deficit of AL maturation and acidification.
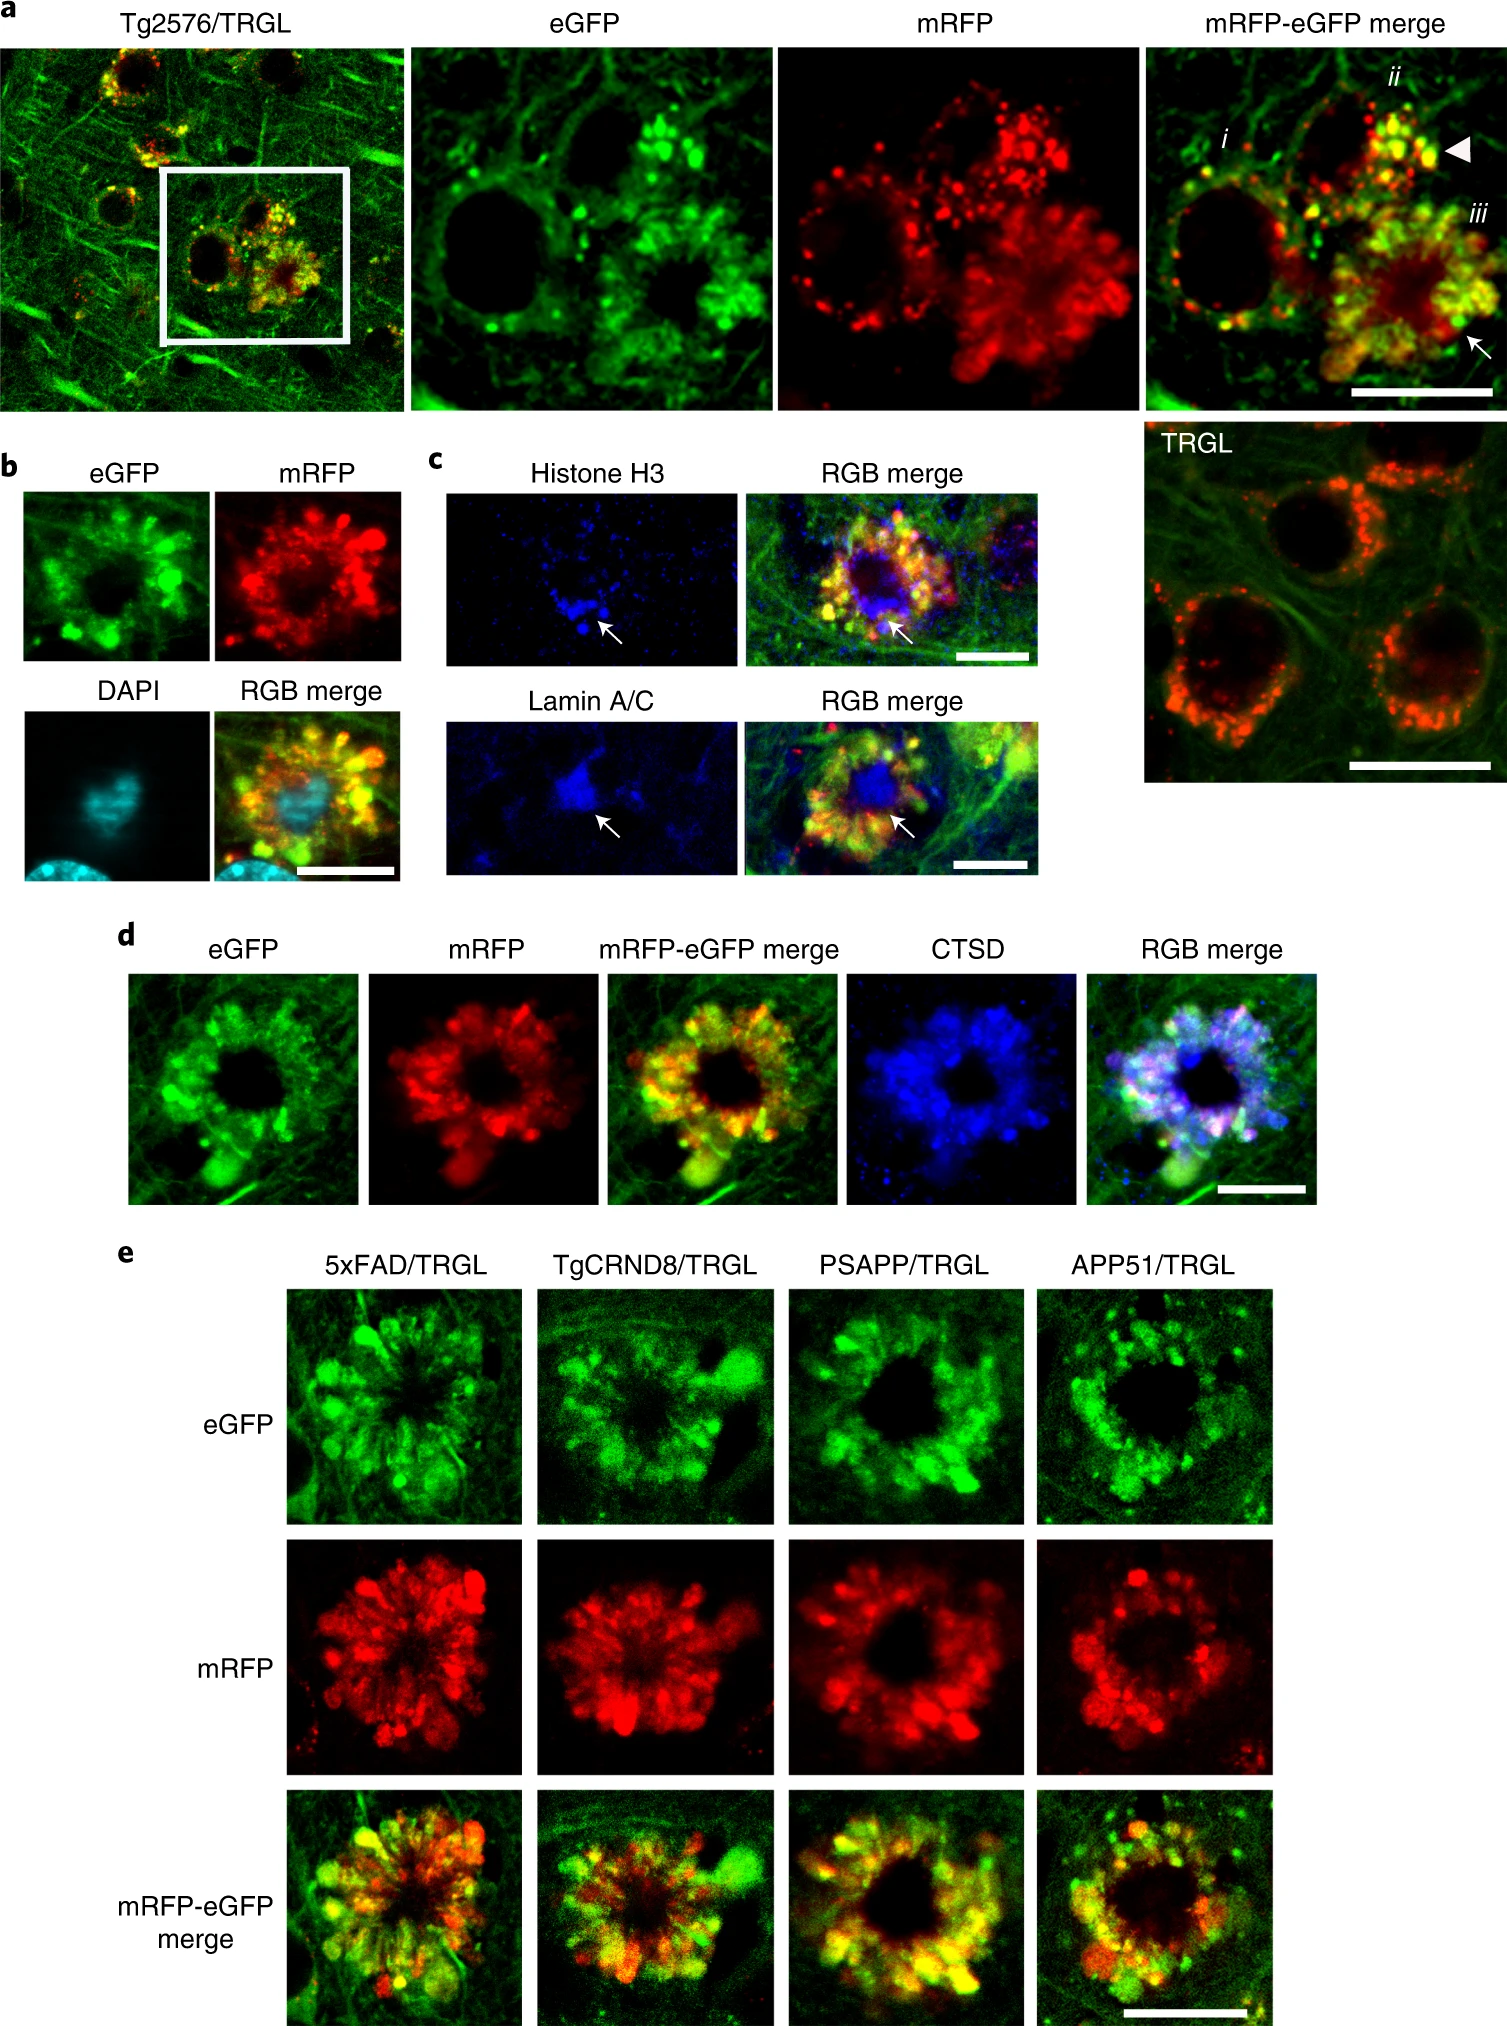
tfLC3 probe reveals a unique pattern of autophagic stress, AL pH deficit and plasma membrane blebbing (‘PANTHOS’) in five different AD mouse models.
a, Representative tfLC3 fluorescence images of 10-month-old Tg2576/TRGL mouse brain depicting neurons at three stages of PANTHOS (i: early pH change in AL; ii: focal PM bulging as pa-ALs enlarge and proliferate (arrowhead); iii: full PANTHOS pattern (arrow)). (See graphic representation of these stages in Extended Data Fig. 8). A control TRGL neuron (5th panel in a) exhibits fully acidified ALs. Scale bar, 20 μm. b, Staining of PANTHOS neurons using nuclear marker (DAPI) in 10-month-old Tg2576/TRGL mouse brain. Scale bar, 10 μm. c, IHF staining of PANTHOS neurons using nuclear markers (histone H3 and lamin A/C) in 10-month-old Tg2576/TRGL mouse brain. Scale bar, 10 μm. See also Extended Data Fig. 2. d, IHF staining of LY marker (CTSD) in 10-month-old Tg2576/TRGL mouse brain. Scale bar, 10 μm. e, PANTHOS pattern is conserved across four additional AD mouse models. Male 5xFAD/TRGL (2.7 months) and male TgCRND8/TRGL (1.9 months) and female PSAPP/TRGL (3.1 months) and female APP51/TRGL (20 months) were imaged. Scale bar, 10 μm. a–e, The experiment was repeated three times independently with similar results. See also Extended Data Fig. 3. PM, plasma membrane.
We observed an identical autophagic neurodegenerative pattern in five different mouse models of AD, including models with accelerated neuropathology onset (5xFAD, TgCRND8 and PSAPP) or delayed onset (Tg2576 and APP51—an exceptionally late-onset model expressing hAPPwt)23 (Fig. 4e). 5xFAD/TRGL mice develop robust ALP disruption and neuronal degeneration at an early age (starting after 2 months depending on sex)24,25,26(Extended Data Fig. 3c–e) and in a more reproducible pattern than in Tg2576 or APP51 mice (Extended Data Fig. 3e). We used this model in further investigations on the relationship between the development of LC3-positive membrane blebs and disease progression, including quantitative amyloid plaque pathology. To our knowledge, similar huge AV-filled perikaryal membrane protrusions, as further defined ultrastructurally (Fig. 5), have not been previously described in a neurodegenerative state27. Because these rosettes of large fluorescent blebs surrounding a central DAPI-positive nucleus resemble petals of a flower, we have termed this unique degenerative process PANTHOS and refer to the affected cells as PANTHOS neurons.
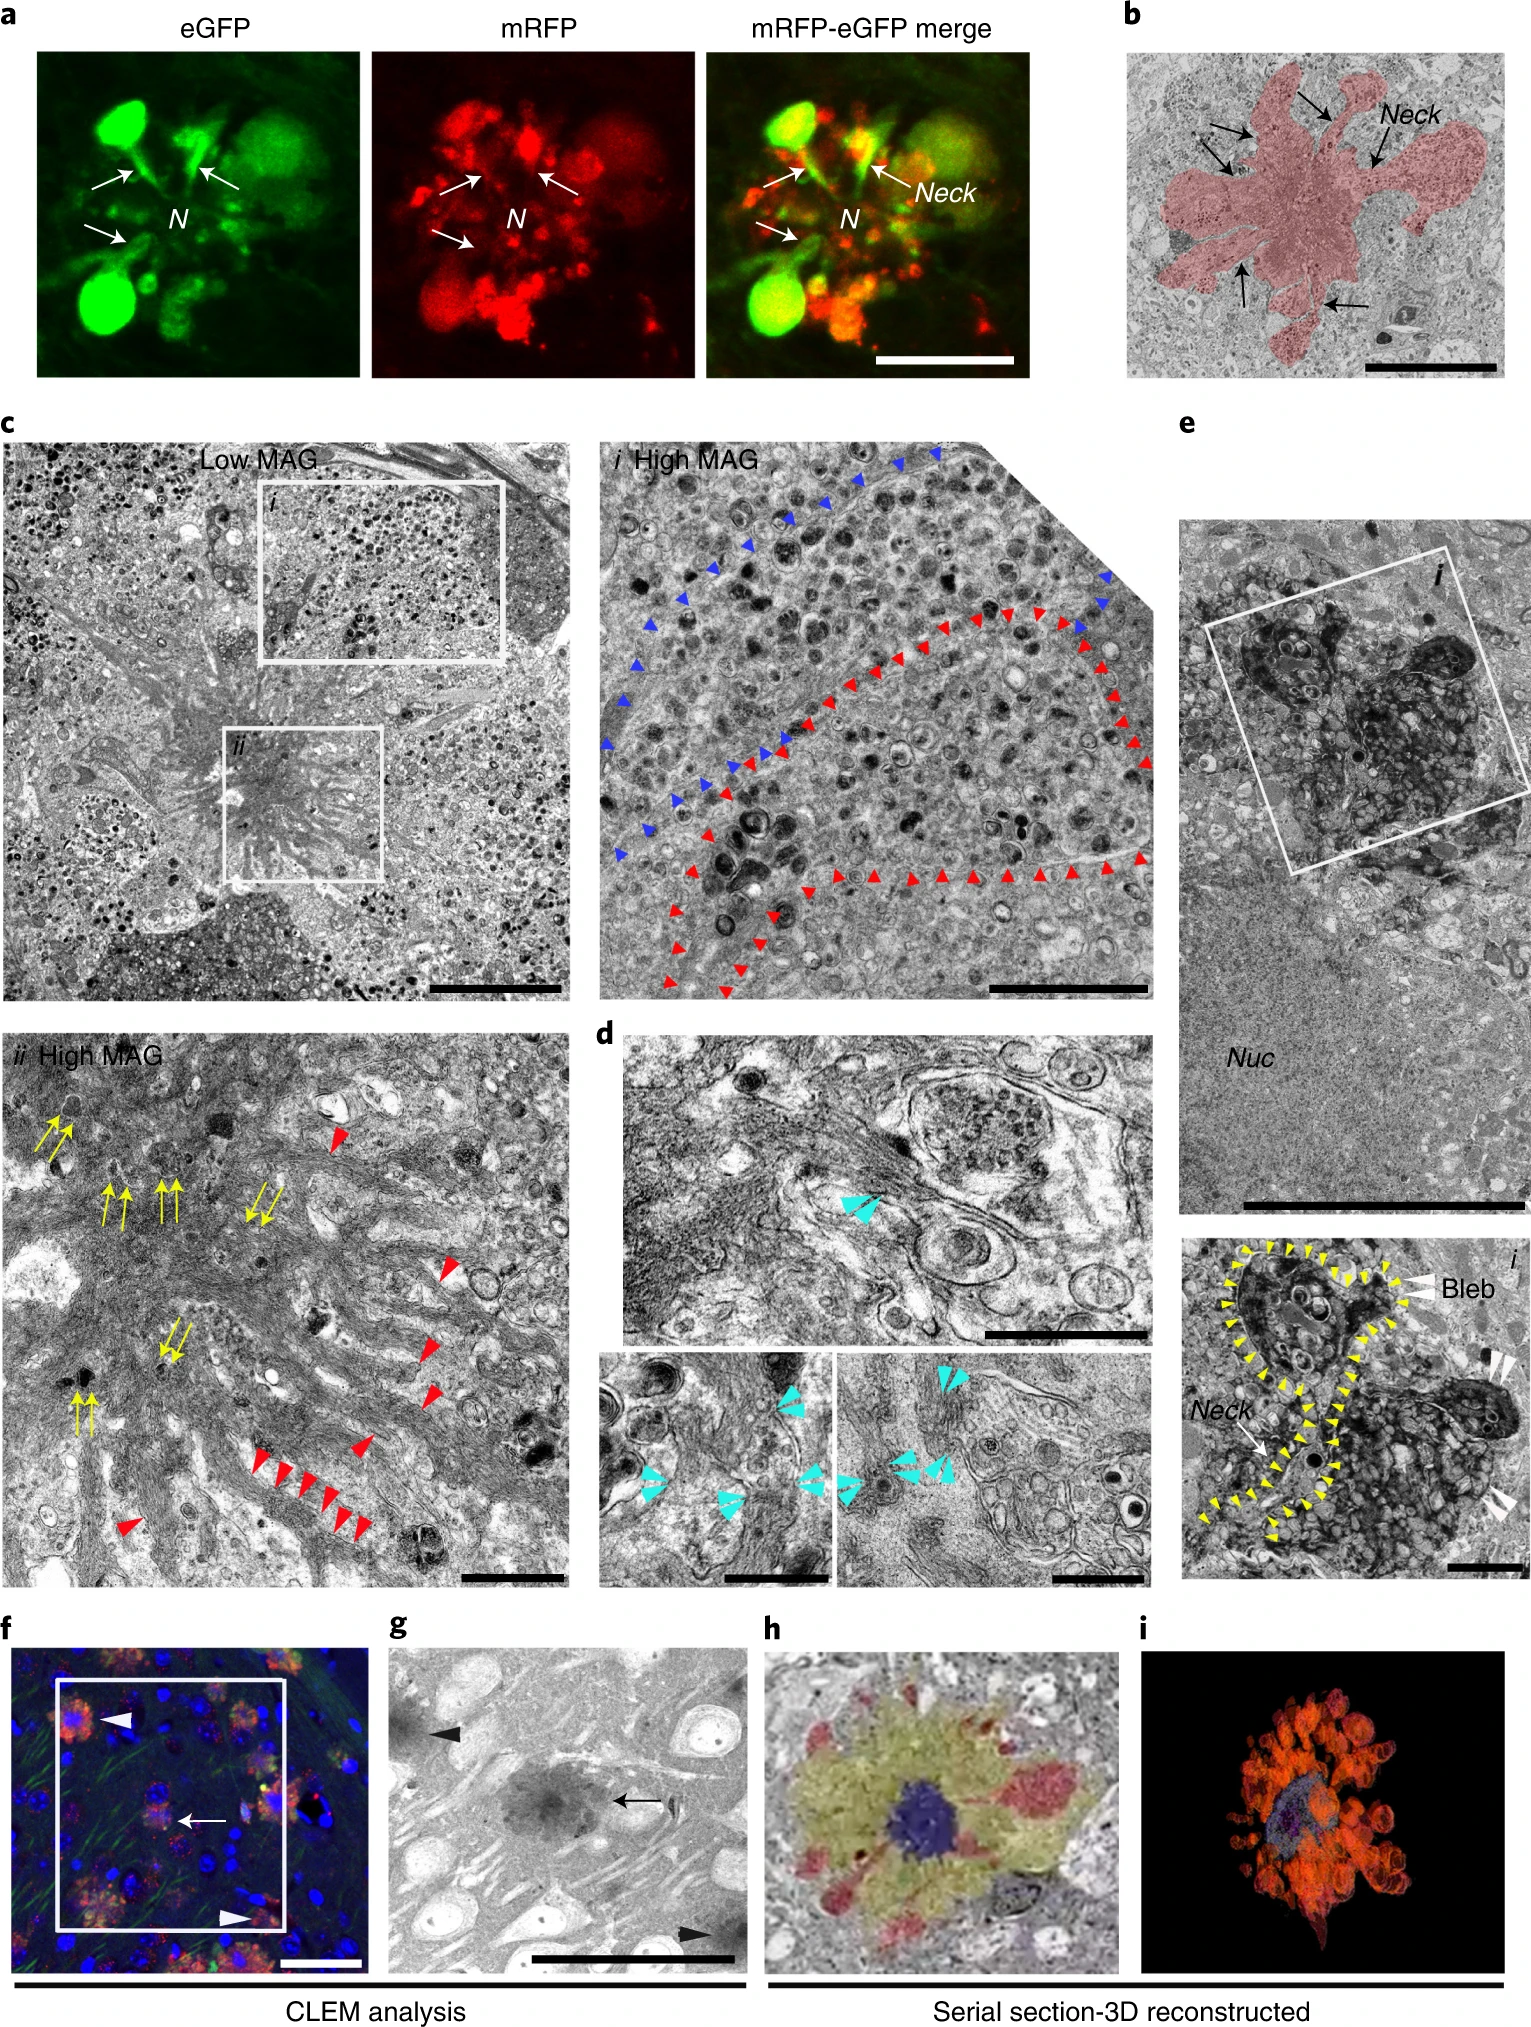
Ultrastructural characterization of PANTHOS neurons in an AD mouse model.
Confocal image of a PANTHOS neuron exhibiting many tfLC3-positive (AV-filled) blebs with tapered necks arising from the perikaryon. N denotes nucleus area. See also in Extended Data Fig. 4. Scale bar, 10 μm. b, Representative EM image of a PANTHOS neuron depicting AV-filled blebs projecting from the perikaryal plasma membrane via necks that are continuous with perikaryal cytoplasm (arrow). 2.7-month-old 5xFAD/TRGL mouse brain. Scale bar, 20 μm. c, EM image of a PANTHOS neuron from a 5-month-old 5xFAD/TRGL mouse brain. Scale bar, 5 μm. Box i: AV-filled peripheral plasmalemmal blebs (blebs membrane boundary: arrowheads). Scale bar, 2 μm. Box ii: a centrally located electron-dense network of radiating membrane-bound tubular extensions (red arrowheads) containing incorporated AVs (yellow arrows). Scale bar, 1 μm. d, EM images for the spatial relationship between AVs and tubular extensions within which thin fiber bundles are visible (light blue arrowheads: AV/tubule contact sites). Scale bar, 500 nm. Full-resolution images for c and dare presented as Extended Data Fig. 5. e, Representative perikaryal blebs extending from the plasma membrane of a PANTHOS neuron. PS/APP mouse brain, labeling by acid phosphatase (ACPase) cytochemistry, a marker of AL/LY, reveals the fulminant autophagy pathology (mainly ALs) segregated into blebs. Scale bar, 5 μm. Box i: Enlarged EM image of the ROI area (box) depicting a bleb (white arrowhead) and long cytoplasmic neck (outlined by yellow arrowheads). Scale bar, 1 μm. f, Immunohistochemistry image of the ROI (box) used for serial SEM imaging of the 2.7-month-old 5xFAD/TRGL mouse brain. Scale bar, 40 μm. g, z-stacked serial SEM image, 370–430, of the ROI area. Scale bar, 40 μm. Arrow indicates the PANTHOS of interest; arrowheads indicate adjusted reference PANTHOS. Bleb tracing (h) and 3D reconstruction of the PANTHOS (i) using IMOD modeling. The experiment was repeated three (a–e) or two (f–i) times independently with similar results. See also Supplementary Fig. 1 and Video 1.
PANTHOS—a unique pattern of neurodegeneration in AD
The greater resolution of autophagic profiles afforded by the tfLC3 probe allowed us to visualize by confocal imaging the AV-filled blebs extending directly from the perikaryal cytoplasm of PANTHOS neurons via necks that taper toward the center of the perikaryon (Fig. 5a and Extended Data Fig. 4). Electron microscopy (EM) analysis on brains of 5xFAD/TRGL mice confirmed the continuity of blebs with the perikaryal cytoplasm and identified AVs as the principal constituents within blebs (Fig. 5b). Perikaryal blebs exhibit long membrane-bound necks extending from the soma of the PANTHOS neuron (Fig. 5c, box i, outline with arrowheads). Additional features of PANTHOS neurons at higher EM resolution include a centrally located electron-dense network of radiating membrane-bound tubular extensions containing partially fused and fully incorporated AVs (Fig. 5c, box ii: yellow arrows, and Extended Data Fig. 5a, inset: yellow arrowheads) as well as bundles of 6-nm fibers (Fig. 5c, box ii, and Extended Data Fig. 5a, red arrowheads) that are strongly Aβ immunoreactive (Fig. 6d, box ii). In other EM images, AVs and Aβ-positive fiber-containing tubular extensions are seen to be in the process of fusing (Fig. 5d and Extended Data Fig. 5b, light-blue arrowheads).
EM analysis of brain sections labeled histochemically for the lysosomal enzyme acid phosphatase (ACPase) further confirmed the identity of most AVs in blebs as strongly ACPase-positive ALs, including those within the tapered bleb necks connecting blebs to the cytoplasm of the degenerating perikaryon (Fig. 5e, inset: yellow arrowheads). Although the asymmetric morphology of perikaryal blebs and their evident cytoplasmic origin distinguish them from DNs, blebs were further distinguished from DNs, which are enriched with neurofilaments, exhibit weak signal for lysosomal markers (CTSD and LAMP2) as shown by IHF (Extended Data Fig. 5c, arrow) and are infrequent compared to perikaryal blebs around PANTHOS neurons (Extended Data Fig. 5d).
To further establish the perikaryal origin of the many AV-filled blebbing profiles, we performed correlative light electron microscopy (CLEM) together with serial block-face scanning EM imaging using an Apreo scanning electron microscope. Reconstruction of more than 500 z-plane images recreated the entire PANTHOS neuron in three dimensions (Supplementary Fig. 1 and Movie 1). A stacked EM image sequence from 370 to 430 of region of interest (ROI) area (Fig. 5f) confirmed that the sizes of early-stage PANTHOS profiles approximate the size of normal neurons (Fig. 5g), but these profiles have expanded circumference as perikaryal blebbing becomes more extensive (Fig. 5h). The DAPI-positive center area of PANTHOS neurons approximates the sizes of the electron-dense centrally located areas in the stacked EM image (Fig. 5g). ImmunoEM analyses with the nuclear marker KDM1/LSD1 confirmed the existence of nuclear remnants in the central area by detecting strong immunoreactivity in the same central area even after nuclear integrity was extensively disrupted (Extended Data Fig. 5e). A movie sequence through these serial sections clearly visualized dozens of AV-filled membrane blebs arising within the cytoplasm from tapered necks that expand into large bulbous projections (blebs) from the perikaryon (Supplementary Movie 1), as shown in a colorized section from the full set (Fig. 5h). A 3D reconstruction modeling illustrates the extensive blebbing of the perikaryon (Fig. 5i).
PANTHOS neurons are the principal origin of amyloid plaques
In 5xFAD/TRGL mice, Aβ and APP-βCTF accumulate selectively within pa-ALs before β-amyloid plaques appear (Fig. 6a, arrowheads), as in Tg2576 mice (Fig. 3). Transition of neurons to a PANTHOS pattern is accompanied by robust accretion of perinuclear Aβ/APP-βCTF immunoreactivity. Co-labeling of these PANTHOS neurons with DAPI and anti-β-amyloid antibody (4G8) identified a 4G8-positive corona surrounding a DAPI-positive nucleus remnant at the center of most affected perikarya (Fig. 6b). The progression of PANTHOS formation with respect to β-amyloid accretion was further confirmed in the late-onset AD mouse model APP51 (Extended Data Fig. 6a–c).
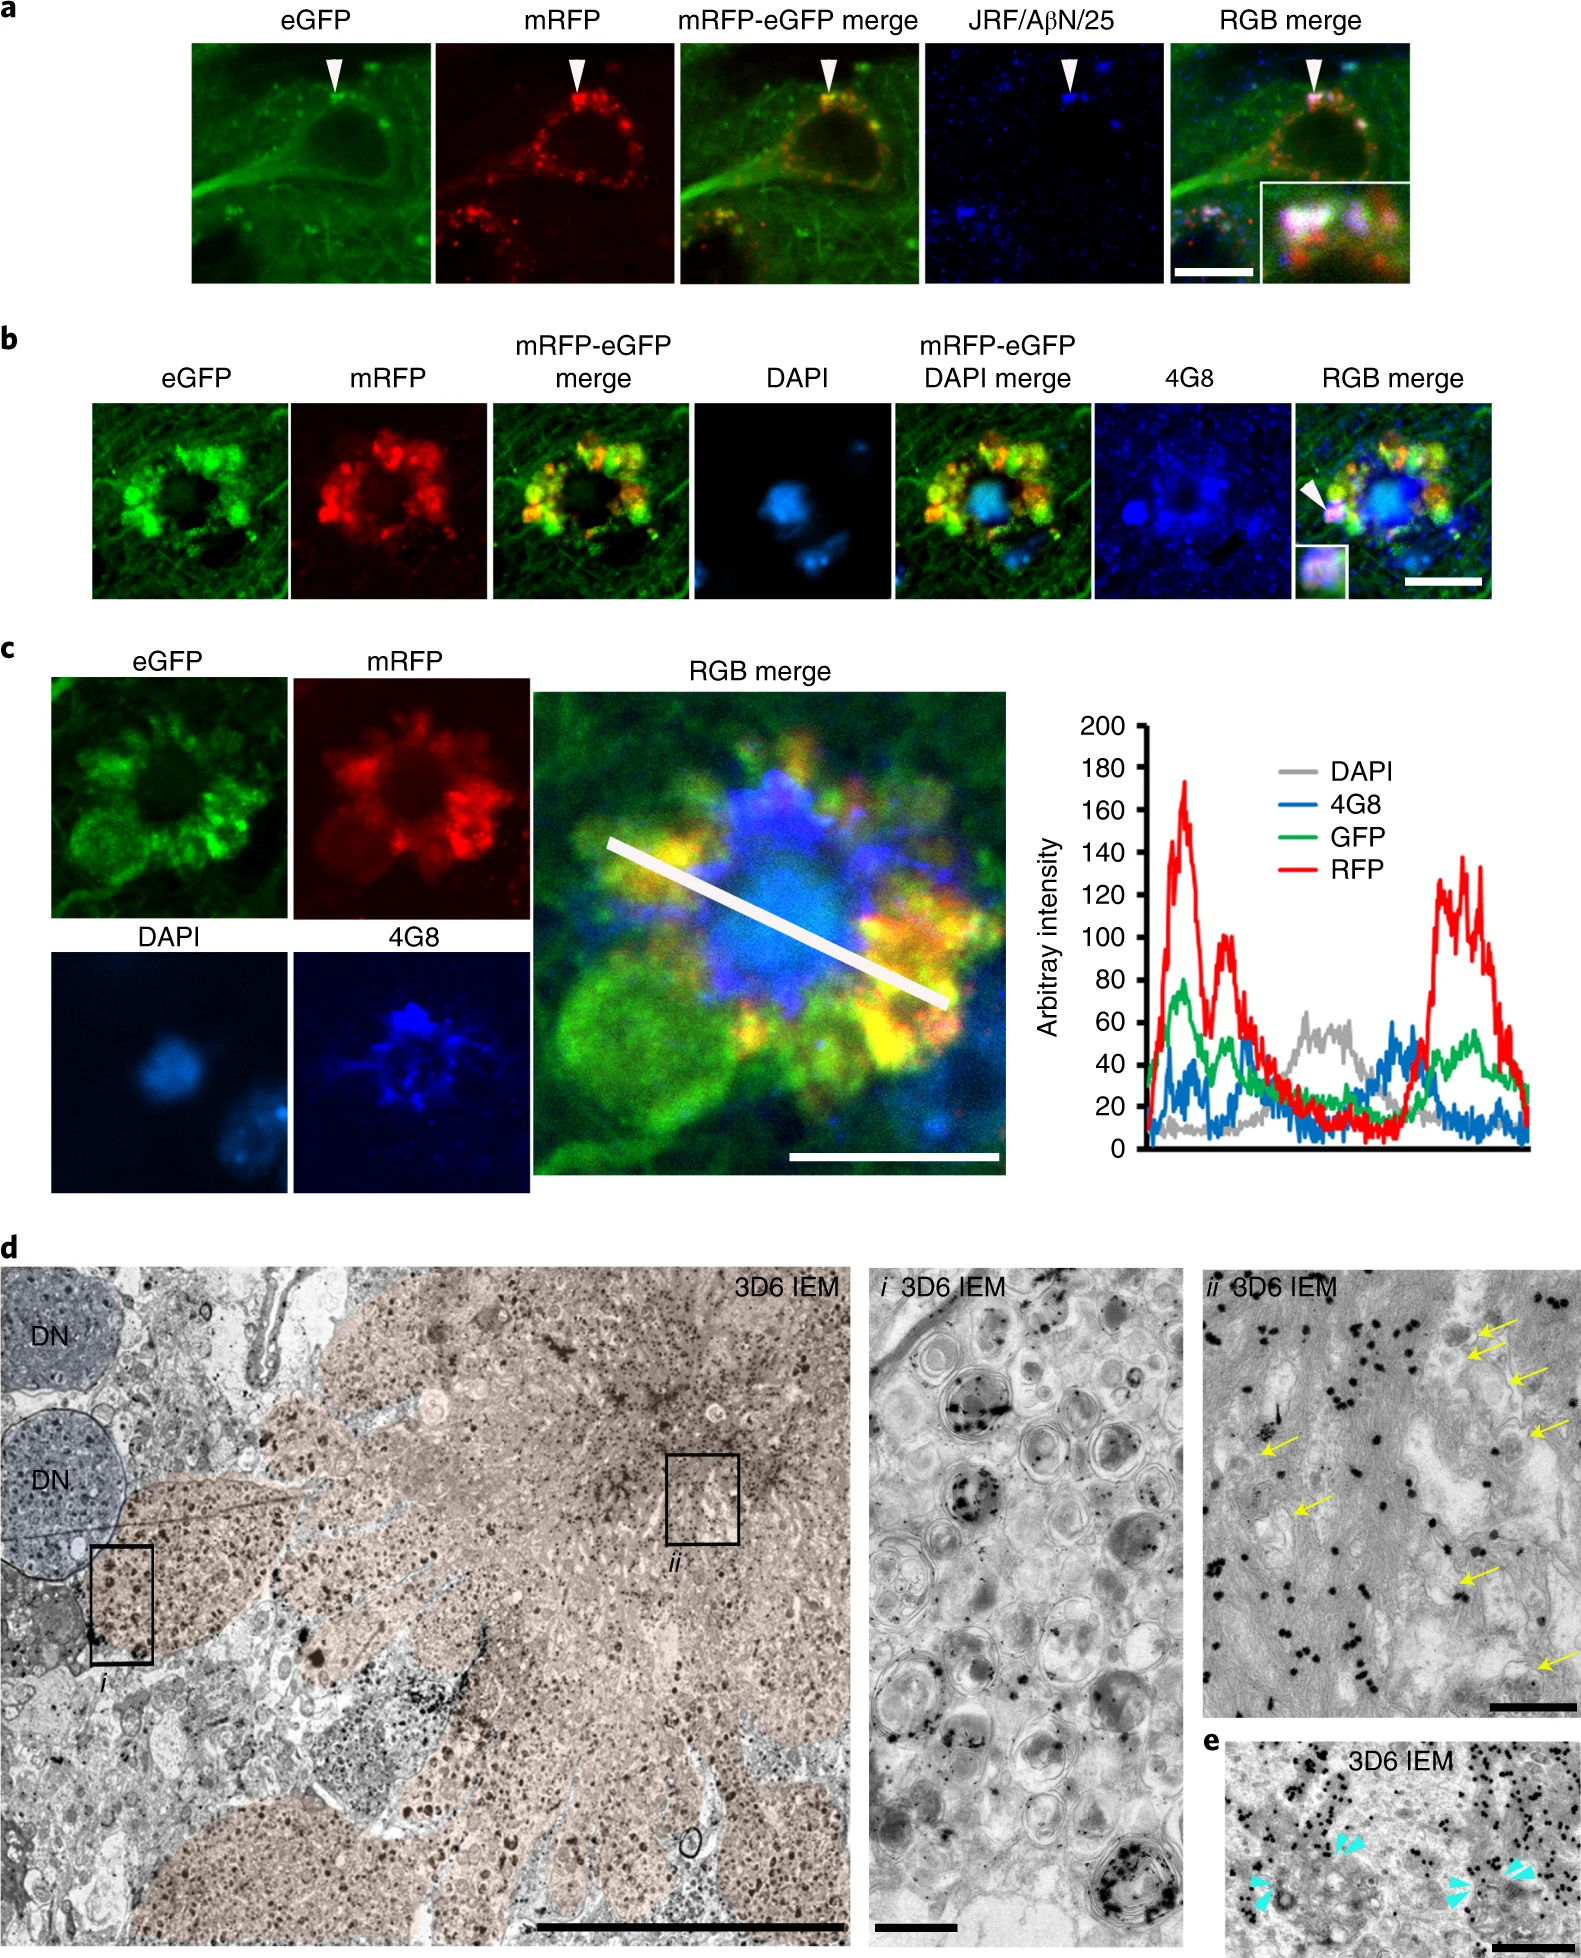
Evolution of intraneuronal β-amyloid accretion and distribution in PANTHOS neurons in brains of AD mouse models.
a, IHF co-labeling of 2.7-month-old male 5xFAD/TRGL mouse brain neurons with JRF/AβN/25 monoclonal antibody against APP-βCTF/Aβ. Scale bar, 10 μm. b, IHF labeling of Aβ (4G8) and DAPI stain. Perinuclear intraneuronal Aβ accumulation surrounding a visible DAPI-positive nucleus within a PANTHOS neuron. Inset depicts Aβ in a bleb of the PANTHOS neuron. Scale bar, 10 μm. c, Immunofluorescence staining of a DAPI-labeled PANTHOS neuron using 4G8 antibody followed by fluorescence intensity analysis. Perinuclear Aβ accumulates within a PANTHOS neuron. The white line in the merged image indicates the scan path through the PANTHOS neuron from which fluorescence intensity is determined spatially for each fluorophore. Scale bar, 10 μm. d, Representative Aβ IEM (3D6) image demonstrates extensive AV-filled blebbing of the PM in a PANTHOS neuron (colorized light pink) and, by comparison, two profiles (blue coloration) tentatively identified as DNs in a 5-month-old 5xFAD/TRGL mouse brain. Scale bar, 10 μm. Box i depicts Aβ immunoreactive AVs in the bleb. Box ii depicts overlap of Aβ immunoreactivity with the central nuclear area that also displays the electron-dense network of radiating membrane-bound tubular extensions, which are strongly Aβ immunoreactive. Yellow arrows indicate AVs incorporated into the central amyloid-positive network. Scale bar, 500 nm. e, Representative amyloid (3D6) IEM image. Light-blue arrowheads denote vesicle and amyloid bundle contact sites. a–d, The experiment was repeated three times independently with similar results. Scale bar, 1 μm. See also Extended Data Fig. 6. PM, plasma membrane.
In 5xFAD/TRGL mice, quantitative spectral analysis of the PANTHOS neuron’s central area discriminated DAPI fluorescence from fluorescence due to 4G8 immunolabeling (Fig. 6c). At more advanced stages of PANTHOS, DAPI fluorescence gradually disappears as more β-amyloid accumulates centrally (Extended Data Fig. 6d). Ultrastructural and 3D6 immunoelectron microscopy (IEM) analyses localized this central accretion of Aβ immunoreactivity (Fig. 6d) within intraneuronal membranous tubular profiles (Fig. 6d, box i). Within many of these same profiles, 3D6-positive bundles of fibrils, with widths of around 10 nm, approximated the known diameters of fibrillar β-amyloid28 (Fig. 6d, box ii). Resembling the PANTHOS morphologies in Fig. 5b, Aβ IEM of a PANTHOS neuron with 3D6 additionally detected 3D6-positive AVs packed into perikaryal blebs. Perikaryal AVs were also shown to be continuous with, and incorporated into, the central Aβ-positive network of membrane tubular structures (Fig. 6e and Extended Data Fig. 6e (3D6 and 4G8 IEM)). IEM with antibodies to either LC3 or CTSD confirmed that these vacuoles are AVs (Extended Data Fig. 6e). ER, a key source for AP membrane components, is increasingly mobilized to supply membrane for new APs as autophagy induction in AD brain remains high29. However, as accumulating AVs deplete sources of available membrane, APP-rich ER and Golgi membranes join endosomes as major sources of APP-βCTF/Aβ generation. Therefore, ER and Golgi are likely key contributors to the expansion of the amyloid fibril network, supporting AP/AL formation by contributing both membrane and β-amyloid precursor.
Consistent with PANTHOS being the principal source of amyloid plaques, immunolabeling of β-amyloid with 3D6 in 5xFAD/TRGL mice revealed an exclusive co-incidence and a one-to-one quantitative relationship between individual PANTHOS neurons and individual amyloid plaques (Fig. 7a). All PANTHOS neurons were 3D6-positive, and 91.7 ± 0.01% of the total 3D6 signal in brain was detectable in PANTHOS lesions (n = 3 mice, 105 neurons and 94 lesions counted) (Fig. 7b). Moreover, a DAPI-positive nuclear signal, including condensed or fragmented/diffuse signals in the perikaryal center (Fig. 7c), was detectable in 91.4 ± 1.29% (n = 6, two sections per mouse) of PANTHOS lesions in cortex from 2.7-month-old 5xFAD/TRGL mice (Fig. 7d, top graph). In older mice (6 months), 67.8% of the PANTHOS neurons still displayed DAPI nuclear signal (Fig. 7d, bottom graph) despite glial invasion and advanced neurodegeneration. This percentage is likely an underestimate because immunoEM analyses with the nuclear marker KDM1/LSD1 revealed nuclear remnants even after loss of nuclear integrity (Extended Data Fig. 5e). The temporal and 1:1 spatial relationship among PANTHOS, intracellular perinuclear Aβ accretion and amyloid plaque formation, therefore, indicates that the vast majority of amyloid plaques originate from a corresponding individual PANTHOS neuron. The transition from intact nucleated PANTHOS neurons to the more advanced stage of DAPI disappearance with glial invasion of the cell likely represents the loss of cellular integrity and conversion to an extracellular plaque.
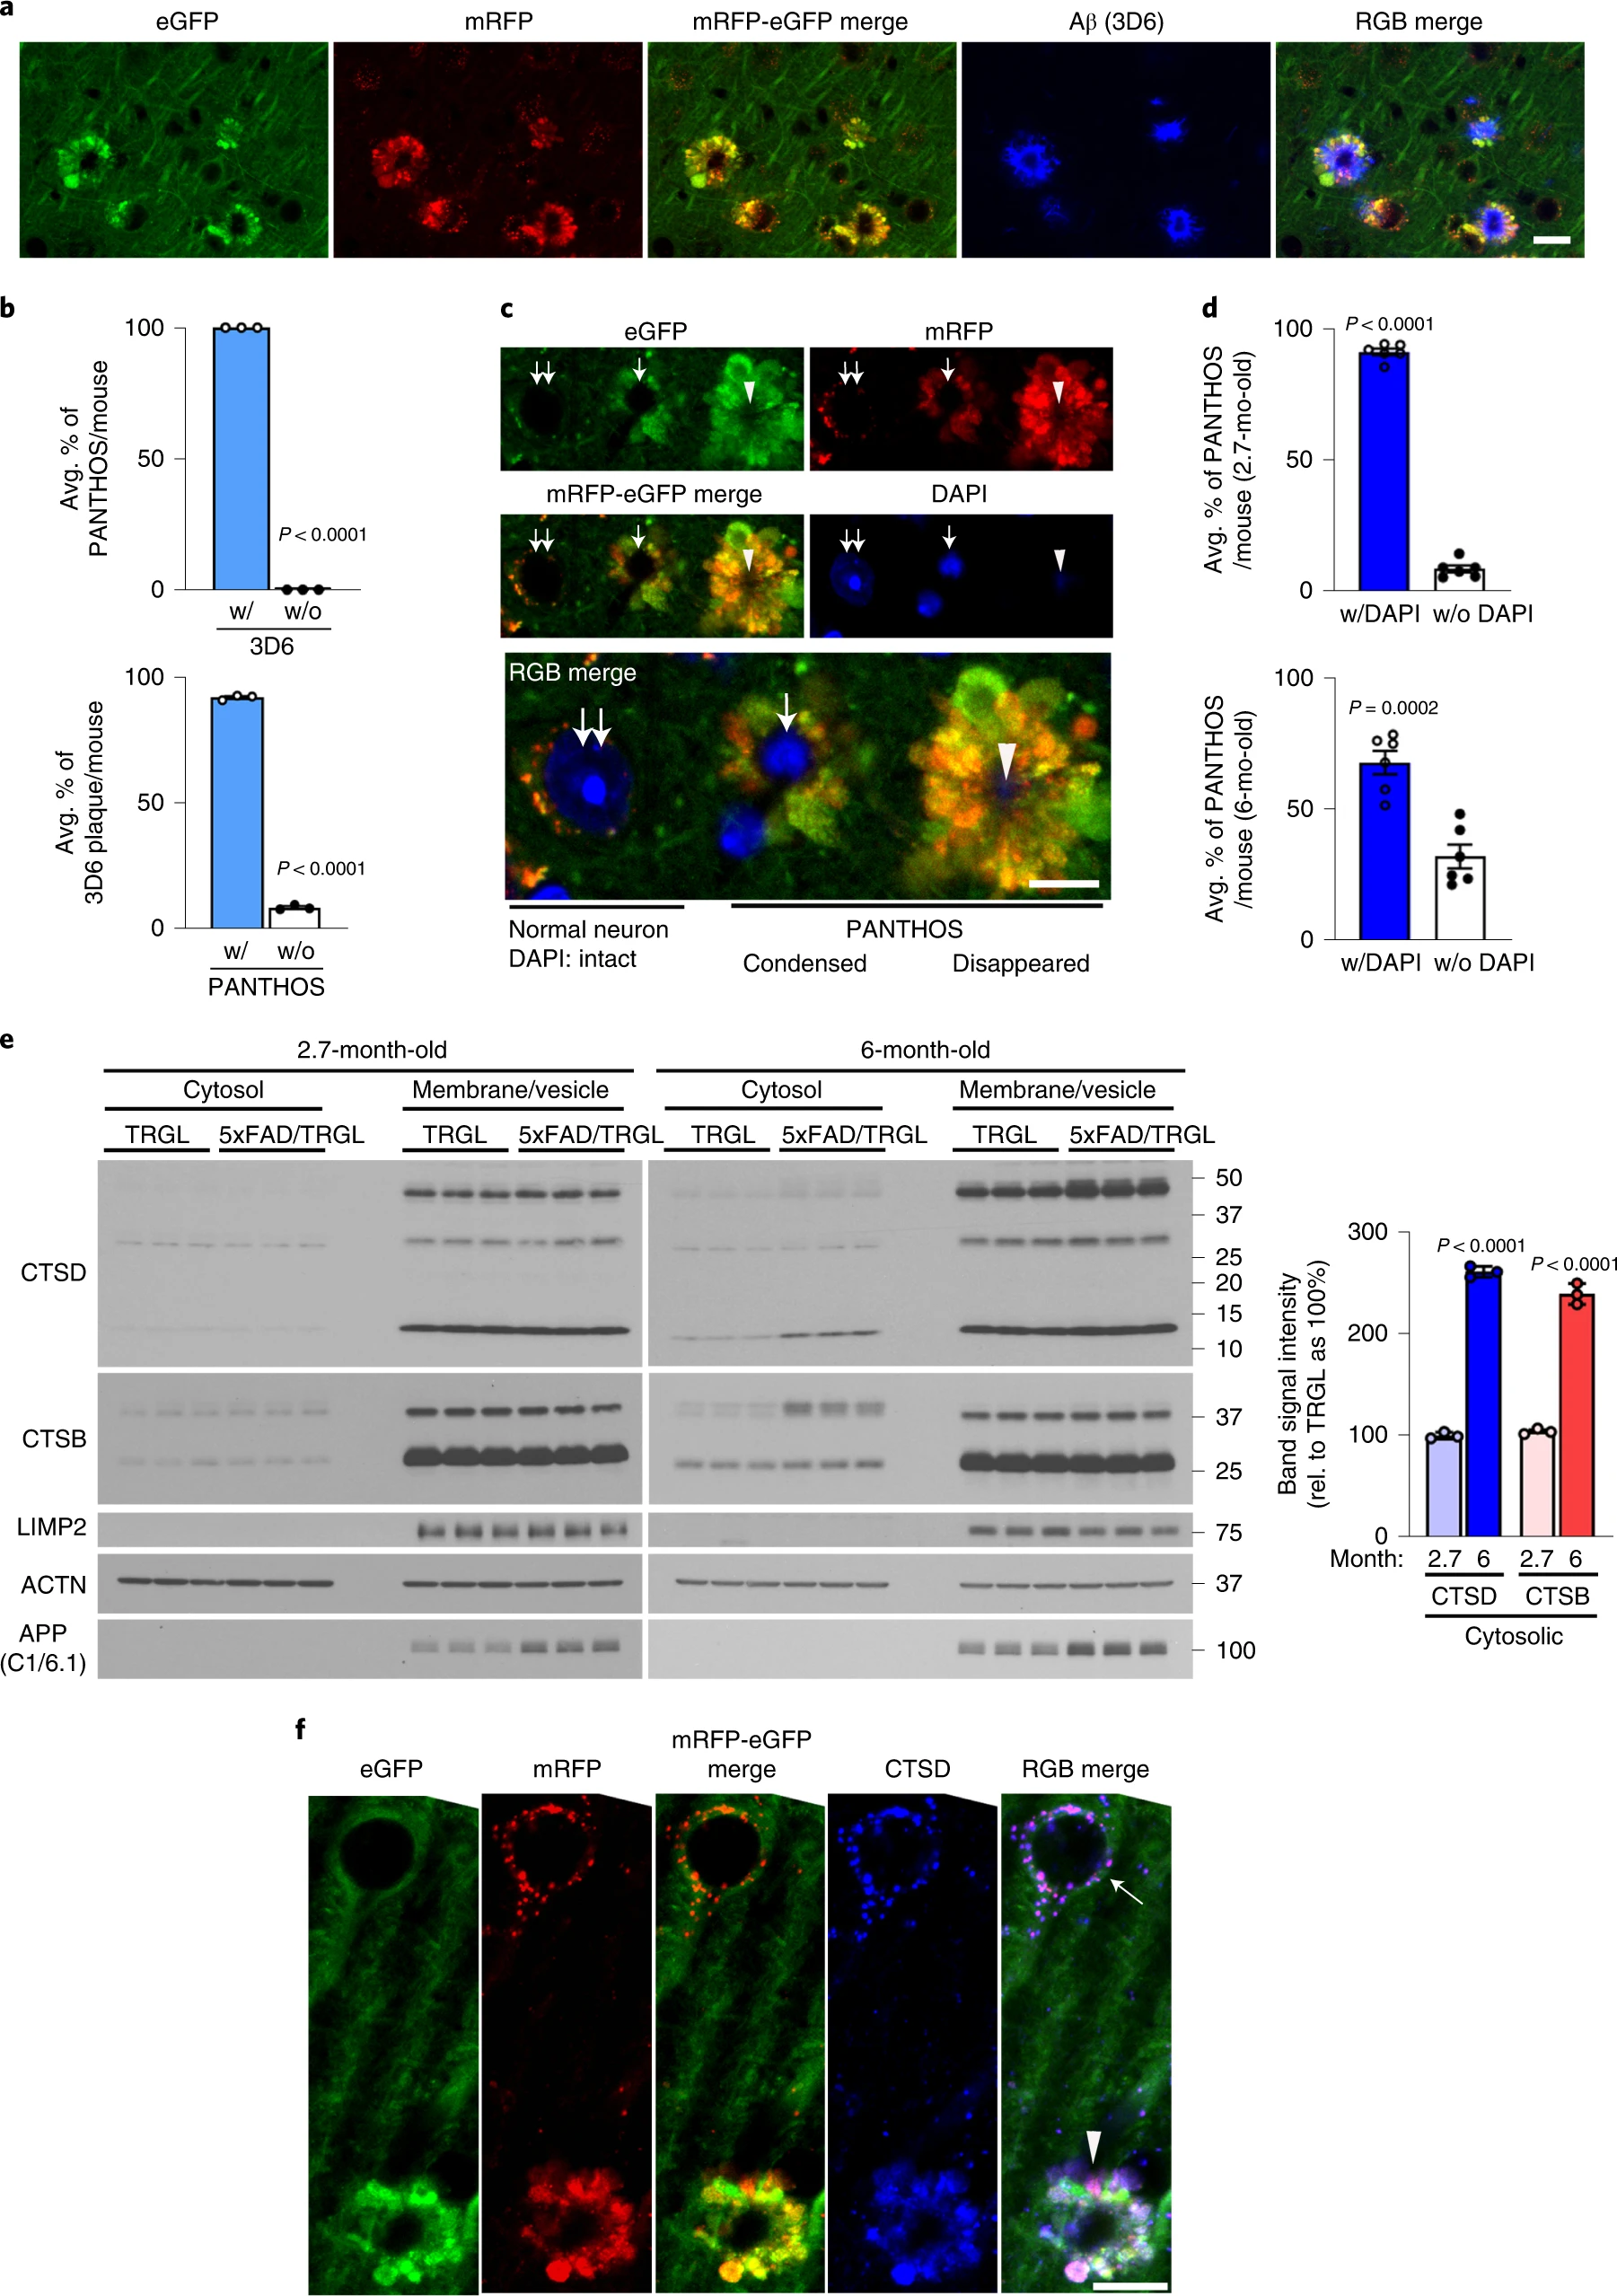
PANTHOS neurodegeneration coincides with β-amyloid plaque formation and subsequent lysosomal neuronal cell death.
a, Aβ antibody 3D6 detecting the appearance of amyloid plaques in 5xFAD mice (2.7-month-old male) demonstrates co-incidence with the presence of a PANTHOS neuron. Scale bar, 20 μm. b, Quantitative percentage of PANTHOS neurons that are 3D6-positive (top) and percentage of PANTHOS among 3D6-positive plaques that are associated with PANTHOS (bottom)—with PANTHOS (91.7 ± 0.5%), without PANTHOS (8.3 ± 0.5%), with 3D6 (100 ± 0%), without 3D6 (0 ± 0%). n = 3 mice. c, DAPI staining depicting various stages of PANTHOS development and ultimate disappearance of detectable DAPI (although not necessarily nuclear marker IR; see Extended Data Fig. 5e). Normal DAPI-labeled nucleus (double arrow), condensed DAPI signal (single arrow) and non-detectable DAPI in very advanced PANTHOS neuron (arrowhead). Scale bar, 10 μm. d, Percentage of PANTHOS neurons with detectable DAPI label in 2.7-month-old or 6-month-old 5xFAD/TRGL mouse brain. 2.7 months: with DAPI (91.4 ± 1.3%) and without DAPI (8.6 ± 1.3%); 6 months: with DAPI (67.8 ± 4.5%) and without DAPI (32.2 ± 4.5%). n = 6 (two sections per mouse, three mice; 94 neurons in cortex area were counted). e, Lysosomal enzyme distribution in cytosol and membrane/vesicle fraction in 2.7-month-old and 6-month-old 5xFAD and WT male mouse cortex. Cytosolic CTSD: 2.7 months (99.8 ± 1.9%) and 6 months (260.4 ± 3.1%); cytosolic CTSB: 2.7 months (103.8 ± 1.6%) and 6 months (238.5 ± 5.9%). n = 3 mice per each genotype. f, Immunofluorescence labeling of 2.7-month-old 5xFAD/TRGL mouse brain neurons with a CTSD antibody. Arrow indicates normal CTSD-positive puncta in a healthy neuron. The experiment was repeated three times independently with similar results. The arrowhead indicates diffuse CTSD signal in a PANTHOS neuron. Scale bar, 20 μm. Quantitative data are presented as means ± s.e.m., unpaired t-test, two-tailed P value as indicated. mo, month; rel., relative.
Source data
Lysosomal permeabilization promotes neuronal cell death
Lysosomal alkalinization is reported to promote lysosomal membrane permeabilization and cathepsin release into cytosol30. Cytosolic and membrane/vesicle fractionation analyses markedly increased levels of lysosomal enzymes in the cytosol of brain from 6-month-old 5xFAD mice compared to brains from WT littermates (Fig. 7e). Lysosomal enzyme leakage was detectable at 6-month, but not young (2.7-month), brains, when many fewer neurons are affected. We further examined the association of PANTHOS with lysosomal membrane permeabilization using CTSD IHF. Compared to an adjusted normal neuron (Fig. 7f, arrow), a PANTHOS neuron (Fig. 7f, arrowhead) displayed diffuse CTSD immunoreactivity in a 5xFAD/TRGL mouse brain co-labeled with CTSD. We ruled out the involvement of a caspase-3-mediated apoptotic cell death, because PANTHOS neurons were caspase-3-negative (Extended Data Fig. 7a).
PANTHOS neurons evolve into senile plaques in AD models
To characterize the evolution of PANTHOS neuron lesions into mature plaques, we immunolabeled PANTHOS with Thioflavin S (Thio-S) for the detection of dense-cored senile plaques (Fig. 8a and Extended Data Fig. 7b,c). In quantitative analyses of 5xFAD/TRGL at 2.2 months of age, half of the PANTHOS profiles were Thio-S-positive, whereas, in 6-month-old 5xFAD/TRGL mice, more than 95% were Thio-S-positive (Fig. 8a, graph). To further characterize the evolution of PANTHOS neuron lesions into mature plaques, we immunolabeled reactive astrocytes and microglia. Neither glial cell type was frequently associated initially with PANTHOS neurons, and, therefore, these cells were unlikely to be a major triggering factor in PANTHOS development. In quantitative analyses of 5xFAD/TRGL at 2.7 months of age, most PANTHOS neurons were unengaged by microglia or astrocytes (Fig. 8b). In older 5xFAD/TRGL mice (6 months), when greater numbers of PANTHOS neurons exhibited advanced loss of structural integrity, relatively few affected neurons were unengaged by microglia and astrocytes (Fig. 8b).
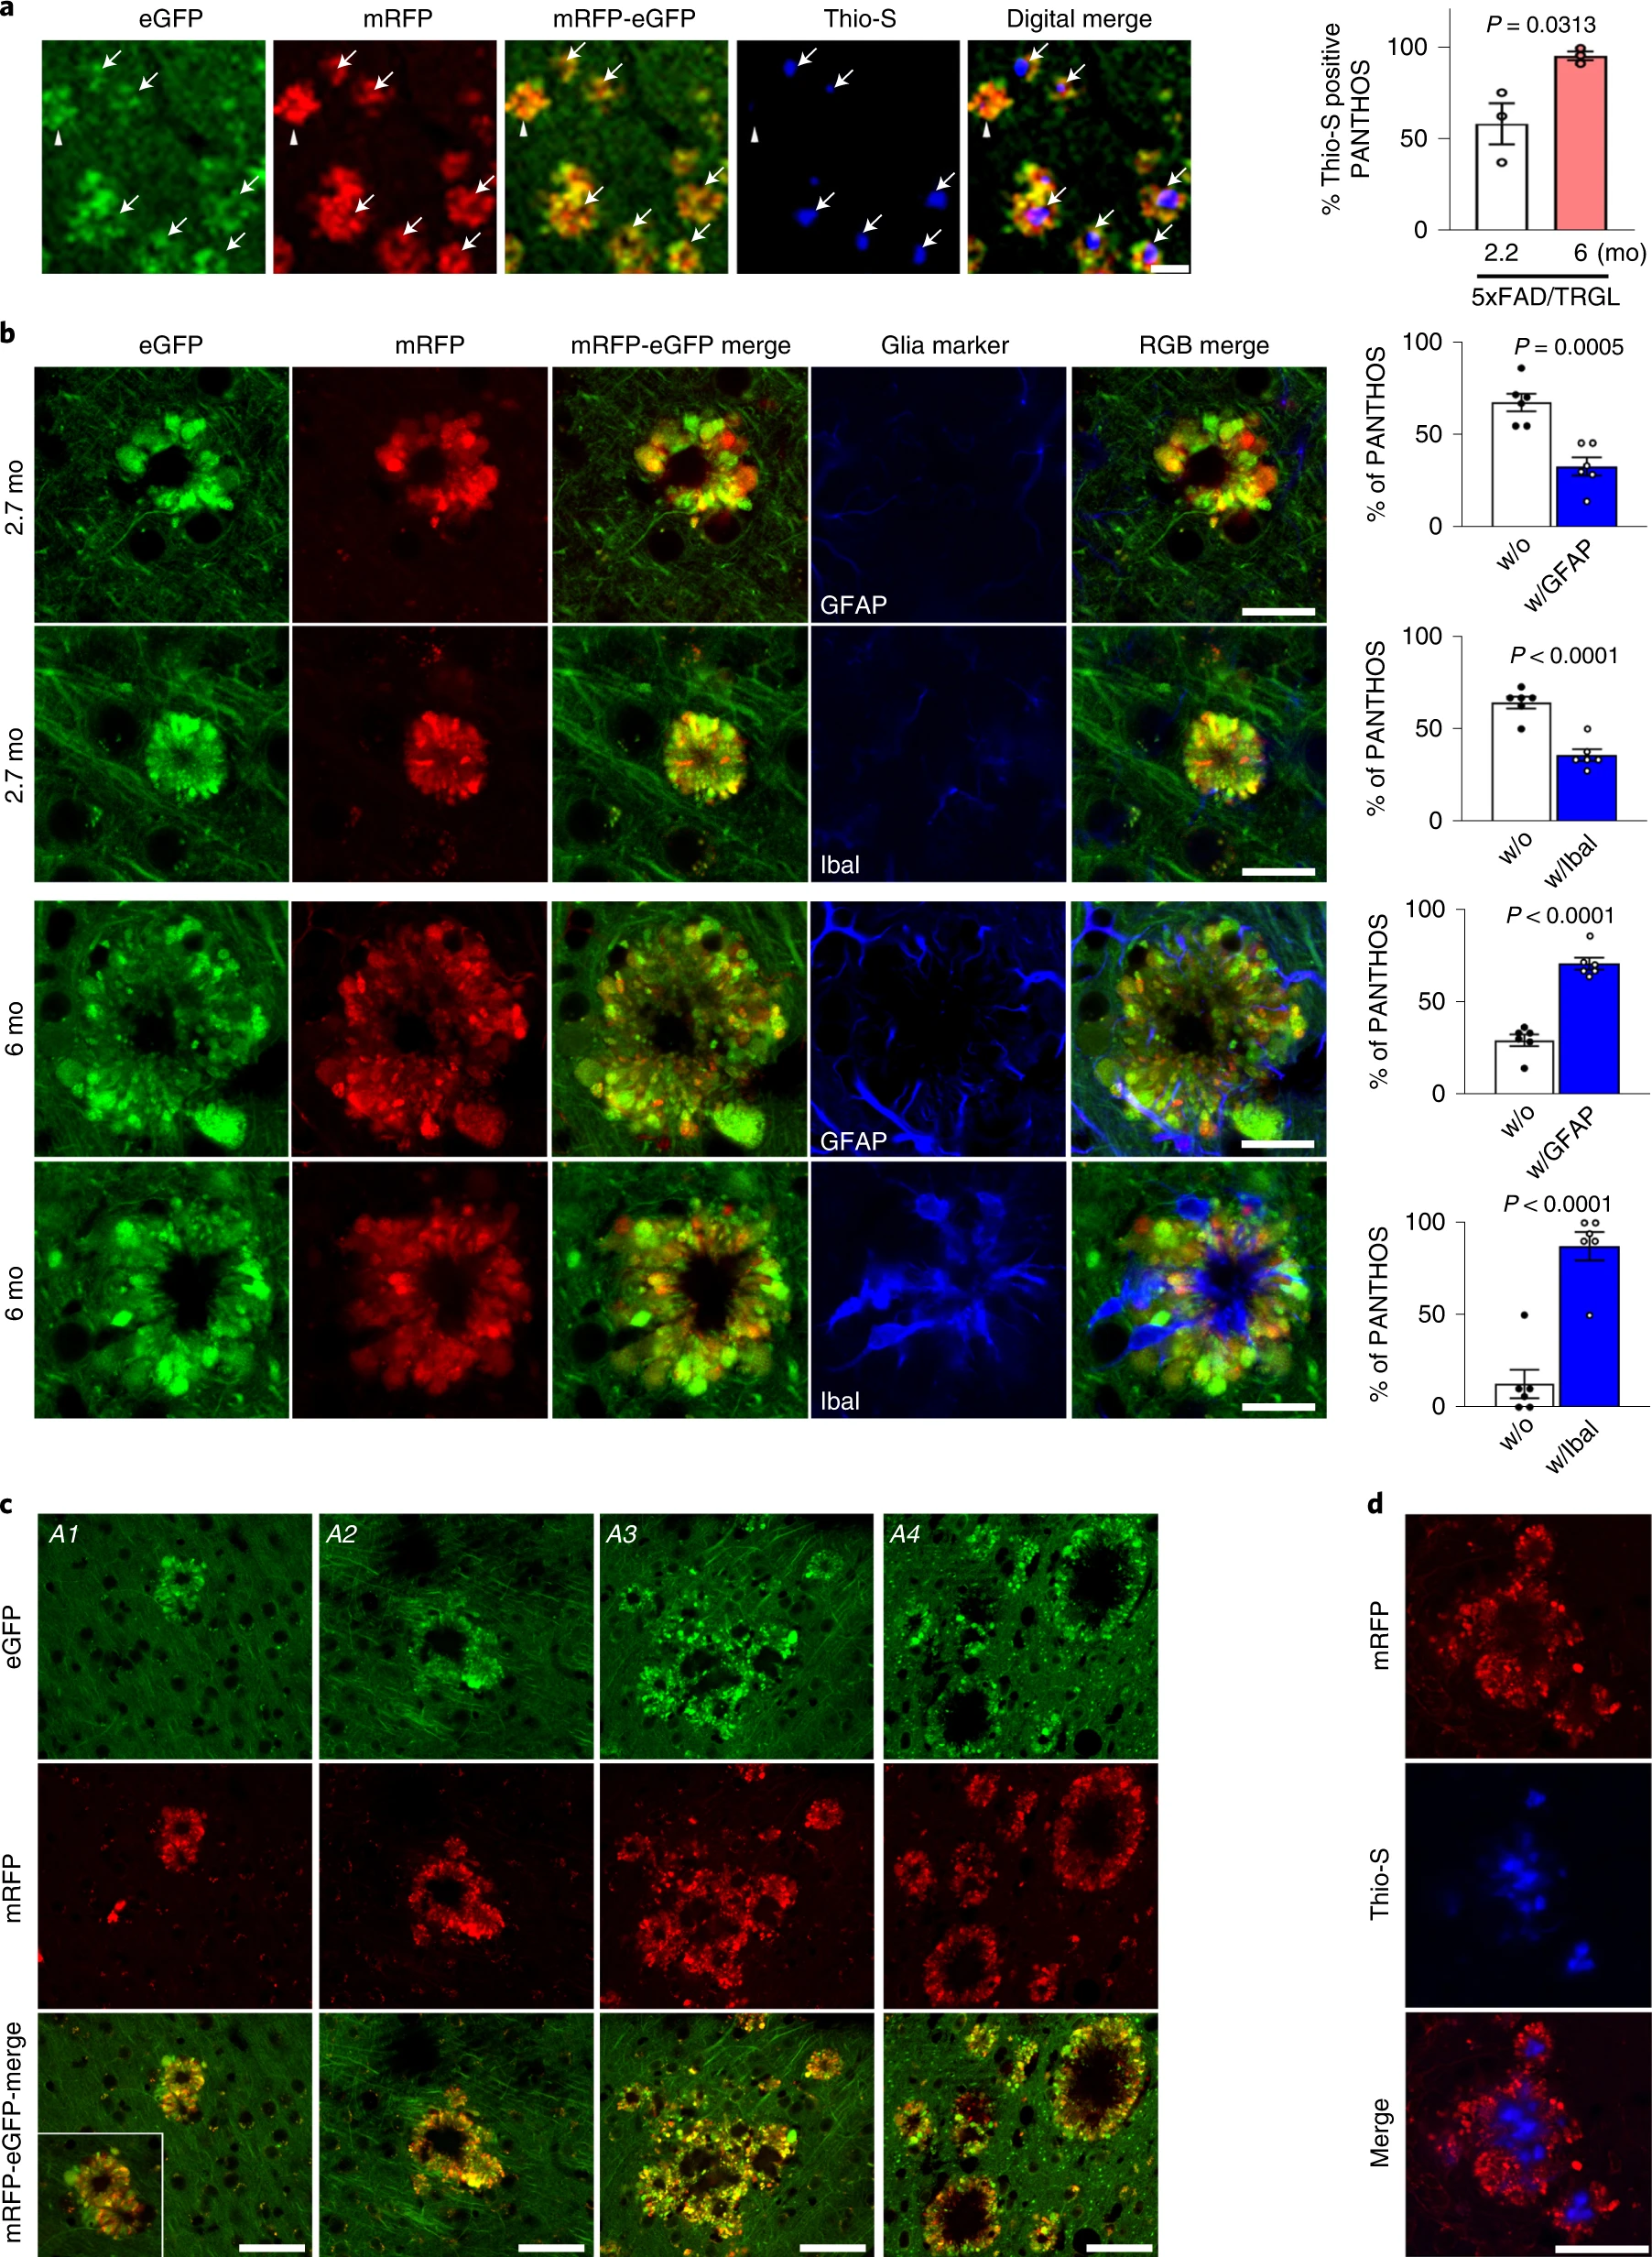
PANTHOS neurons evolve into classical dense-cored senile plaques in AD models.
, Dense-cored senile plaque labeling using Thio-S in 2.2-month-old or 6-month-old 5xFAD/TRGL mice. Quantified presence of Thio-S within the confines of a PANTHOS neuron (n = 3 mice). 2.7 months (58.1 ± 11.2%) and 6 months (95.2 ± 2.4%). Scale bar, 50 μm. See also Extended Data Fig. 7. b, IHF labeling using markers of astrocytes (GFAP) or microglia (Iba I) in 2.7-month-old or 6-month-old 5xFAD/TRGL mice. Quantified presence of microglia or astrocytes within the confines of a PANTHOS neuron. 2.7 months: without GFAP (67.2 ± 4.8%), with GFAP (32.8 ± 0.8%), without IbaI (64.2 ± 3.1 %), with IbaI (35.8 ± 3.1%); 6 months: without GFAP (29.3 ± 3.2%), with GFAP (70.7 ± 3.2%), without IbaI (12.6 ± 7.7%), with IbaI (87.4 ± 7.7%). n = 6 (two sections per mouse, three mice). Scale bar, 20 μm. c, Growth of a senile plaque commonly occurs by coalescence of one or multiple adjacent PANTHOS neurons and the progressive clearance of cellular debris after centrally located cells have degenerated, leaving behind the poorly degradable amyloid originating from these neurons. A1–A3: 12-month-old Tg2576/TRGL; A4: 25.5-month-old APP51/TRGL mouse brain. Scale bar, 50 μm. See also Extended Data Fig. 8. d, Growth of a Thio-S-positive dense-cored senile plaque commonly occurs by coalescence of one or multiple adjacent PANTHOS neurons. Scale bar, 50 μm. c, d, The experiment was repeated three times independently with similar results. Quantitative data are presented as means ± s.e.m., unpaired t-test, two-tailed P value as indicated. mo, month.
Source data
In older 5xFAD mice, PANTHOS lesions frequently expanded into larger senile plaques when adjacent PANTHOS neurons merged into a single larger structure (Fig. 8c, A1 and A2, respectively) that comprised multiple Thio-S-positive dense cores (Fig. 8d). Within these growing lesions, newly recruited PANTHOS neurons could still be recognized (Extended Data Fig. 8a, arrowheads), but loss of integrity of the original PANTHOS neurons and its adjacent neighbors created an expanding central core of persisting β-amyloid as other cellular debris is cleared, yielding, finally, an enlarged extracellular dense-cored senile plaque (Fig. 8b, A3 and A4, respectively), as confirmed by z-stack confocal imaging (Extended Data Fig. 8b).
Discussion
Our transgenic dual-fluorescence probe, identifying autophagic compartments and associated changes in their pH in vivo, established that autophagy failure in five different APP-AD mouse models originates from an early decline of AL/LY acidification. Furthermore, we uncovered a previously undescribed pattern of extreme autophagic stress, termed PANTHOS, in individual neuronal perikarya, which is characterized by massive perikaryal accumulations of poorly acidified AVs containing APP-βCTF/Aβ. The advance of PANTHOS generates an intraneuronal perinuclear ‘core’ of β-amyloid within membrane tubules. Preliminary analyses of human AD brain (Extended Data Fig. 9) revealed a similar PANTHOS in selected neocortical neurons, which is most easily appreciated immunocytochemically at the Braak II pathologic stage as the first β-amyloid plaques are forming. Progressive failure of an initially neuroprotective autophagy response in neurons29 is accompanied by an evolution of PANTHOS toward neuronal cell death involving lysosomal membrane permeabilization, cathepsin release and, ultimately, glial invasion and extracellular plaque formation and expansion (Extended Data Fig. 10, diagram).
AL acidification deficits in Tg2576 mice were detectable by 5 months of age—more than 4 months before β-amyloid deposited extracellularly. The emergence of pH deficits in AL coincided with lowered vATPase activity in brain LYs—the likely molecular basis for the acidification deficit. Declining AL acidification was accompanied by selective build-up of APP-βCTF and Aβ within enlarged pa-ALs. These APP metabolites are known to be both generated and degraded in ALs12,31 and amphisomes32. We also cannot exclude additional delivery of APP-βCTF and Aβ to AL/LY through microautophagy and chaperone-mediated autophagy33.
The exceptional resolution of our tfLC3 autophagy probe, combined with advanced ultrastructural and multiplex confocal imaging methods, enabled the recognition of a unique pathobiologic process (‘PANTHOS’) in intact neurons within vulnerable cell populations. This morphologic pattern, not previously reported, to our knowledge, includes AV accumulation (‘autophagic stress’) so extreme that it induced huge AV-filled plasma membrane blebs and accelerated perinuclear accretion of Aβ and β-amyloid fibrils within tubulo-vesicular structures created, in part, through AV fusion. Large AV-filled blebs were shown by CLEM and 3D serial ultrastructural analyses to be formed by plasma membrane evagination and to originate from the perikaryal cytoplasm. Their asymmetric morphology, high hydrolase content and extensive distribution encircling an affected perikaryon far outnumbered DNs. Unlike perikaryal blebs, DNs were commonly enriched with neurofilaments, only weakly cathepsin-immunoreactive and LAMP2-immunoreactive and frequently myelinated.
Autophagic stress develops in many congenital lysosomal storage disorders (LSDs). In several of these disorders, Niemann–Pick type C (NPC1)34 and mucopolysaccharidosis type III (MPS-III), pH has been shown to be elevated35. Among LSDs, NPC1 has considerable phenotypic overlap with AD (for example, paired-helical filaments, cholinergic neurodegeneration, endosome anomalies, disease acceleration by ApoE4, intracellular Aβ/βCTF elevation and modest amyloid deposition36,37,38); tauopathy has been reported in mouse MPS-III models and intracellular synuclein, and Aβ accumulations are detected in MPS-III brain39. That individuals with these disorders usually do not survive to mid-adult ages may partly explain the infrequency of amyloid plaques. Even individuals with AD due to PSEN1 mutations generally do not develop amyloid plaque pathology until the fourth decade of life, when aging factors may contribute10,40. Also, neuronal ALP induction continues to increase in AD brain even as substrate clearance declines29,41, compounding autophagic stress and likely increasing βCTF/Aβ generation12.
PANTHOS neurons account quantitatively for the overwhelming majority of plaques that developed in five different AD models at the ages studied. In young 5xFAD mice, β-amyloid cored plaques, detected with β-amyloid antibodies, showed nearly 1:1 coincidence with a single PANTHOS neuron exhibiting a central nucleus. Even at a relatively late stage of compromise, intracellular Aβ-immunoreactive fibrils forming a perinuclear core are mainly contained within membrane-bound tubular structures derived from fusion of Aβ-positive ALs. This stage can be reached without appreciable microglial or astrocytic invasion that would reflect ‘eat me’ signaling from dying neurons42,43, implying, therefore, that neuronal structural integrity is prolonged even as PANTHOS is quite advanced. Subsequent microglial and astrocytic invasion of the PANTHOS neuron heralds the eventual cell death that converts this amyloid lesion within an intact neuron into an extracellular amyloid plaque.
β-amyloid plaque formation in AD has commonly been considered to originate from extracellular deposition of β-amyloid derived from secreted Aβ, which then triggers secondary neuritic dystrophy and neuronal cell death. By contrast, our evidence in diverse AD models supports the opposite sequence—namely, extracellular plaques mainly evolve from intraneuronal build-up of β-amyloid within membrane tubules, forming a centralized amyloid ‘core’ within single intact PANTHOS neurons that subsequently degenerate to give rise to the classical senile plaque. This ‘inside-out’ process accords with and substantiates hypotheses from many investigators44,45. In versions of this hypothesis, Aβ and its oligomeric species generated intracellularly within ALP compartments can gain access to the extracellular space by neurodegeneration, local membrane damage or unconventional secretion (exocytosis). Importantly, a few investigators have described intracellular membrane-enclosed amyloid fibrils in AD mouse models46 and, in AD brain, the frequent presence of amyloid surrounding DAPI-positive nuclei47,48 and neuronal lysosomal hydrolase abundance within extracellular β-amyloid49.
Our findings add to mounting evidence that lysosomal acidification and the dysregulation of the vATPase complex are common targets of genetic and metabolic disruptions associated with neurodegenerative disease50. Coupled with previous evidence10,20, our findings strongly support a pathogenic link between APP metabolites and LY dysfunction in AD. Notably, remediating PSEN1-related lysosomal pH deficits by various means ameliorates autophagy failure and other AD-related pathology in AD models7,24. Additional supporting evidence from our group shows that the PANTHOS cascade in APP-based AD models described in this report can be significantly alleviated by pharmacologically targeting the lysosomal pH deficit. Beyond the significance of findings revealed here, we anticipate broad potential of our transgenic dual-fluorescence tfLC3 autophagy probe to characterize ALP changes sensitively over time in other neurodegenerative disease models and to facilitate assessment of autophagy/lysosome modulators as therapeutic agents.