
Divergent Ca2+/calmodulin feedback regulation of CaV1 and CaV2 voltage-gated calcium channels evolved in the common ancestor of Placozoa and Bilateria
By Julia Gauberg, Wassim Elkhatib, Carolyn L. Smith, Anhadvir Singh, and Adriano Senatore
Excerpt from the article published in Journal of Biological Chemistry, volume 298, 4, 101741, April 2022, DOI: https://doi.org/10.1016/j.jbc.2022.101741
Editor’s Highlights
- Voltage-gated calcium (CaV) channels belong to a vast eukaryotic lineage of four-domain channels, which in animals includes voltage-gated sodium (NaV) and NALCN sodium leak channels.
- CaV1 and CaV2 voltage-gated calcium channels evolved from an ancestral CaV1/2 channel via gene duplication somewhere near the stem animal lineage.
- Notably, all invertebrate animals included in the analysis possess two α2δ homologues, while mammals possess four (α2δ1 to α2δ4), with unclear phylogenetic relationships because of low node support values distributed within the α2δ clade.
- The association of the CaV1 and CaV2 channels with CaVβ was likely inherited from the ancestral CaV1/2 channel, given the presence of a CaVβ gene in choanoflagellates that can regulate mammalian CaV1.2 and CaV2.3 channels.
- CaV1 and CaV2 channels also require the ancillary subunit CaVα2δ for their membrane expression, localization, and gating characteristics, which in contrast to the cytoplasmic CaVβ subunit associates with extracellular regions of the pore-forming α1 subunit.
- Placozoan CaV1 and CaV2 channels also bear a conserved, negatively charged aspartate residue in the extracellular DI S1–S2 loop, identified as a critical determinant for the interaction between the CaV1.2 α1 subunit and the ancillary subunit CaVα2δ1.
- CaV1.2 channels in the mammalian brain become proteolytically cleaved at the DII-DIII linker, as a form of age-related regulation of channel activity.
- CaV1.2 and CaV1.3 channels bear NSCaTE motifs at their N termini, which convert N-lobe mediated CDI into a local, buffer-resistant process.
- CaVα2δ1 subunit caused a hyperpolarizing shift in voltage properties and increased sensitivity to voltage changes, as is observed for vertebrate CaVchannels.
Abstract
CaV1 and CaV2 voltage-gated calcium channels evolved from an ancestral CaV1/2 channel via gene duplication somewhere near the stem animal lineage. The divergence of these channel types led to distinguishing functional properties that are conserved among vertebrates and bilaterian invertebrates and contribute to their unique cellular roles. One key difference pertains to their regulation by calmodulin (CaM), wherein bilaterian CaV1 channels are uniquely subject to pronounced, buffer-resistant Ca2+/CaM-dependent inactivation, permitting negative feedback regulation of calcium influx in response to local cytoplasmic Ca2+ rises. Early diverging, nonbilaterian invertebrates also possess CaV1 and CaV2 channels, but it is unclear whether they share these conserved functional features. The most divergent animals to possess both CaV1 and CaV2 channels are placozoans such as Trichoplax adhaerens, which separated from other animals over 600 million years ago shortly after their emergence. Hence, placozoans can provide important insights into the early evolution of CaV1 and CaV2 channels. Here, we build upon previous characterization of Trichoplax CaVchannels by determining the cellular expression and ion-conducting properties of the CaV1 channel orthologue, TCaV1. We show that TCaV1 is expressed in neuroendocrine-like gland cells and contractile dorsal epithelial cells. In vitro, this channel conducts dihydropyridine-insensitive, high-voltage–activated Ca2+ currents with kinetics resembling those of rat CaV1.2 but with left-shifted voltage sensitivity for activation and inactivation. Interestingly, TCaV1, but not TCaV2, exhibits buffer-resistant Ca2+/CaM-dependent inactivation, indicating that this functional divergence evolved prior to the emergence of bilaterian animals and may have contributed to their unique adaptation for cytoplasmic Ca2+ signaling within various cellular contexts.
Introduction
Voltage-gated calcium (CaV) channels belong to a vast eukaryotic lineage of four-domain channels, which in animals includes voltage-gated sodium (NaV) and NALCN sodium leak channels (1). These pore-forming proteins, also referred to as α1 subunits, share a common transmembrane architecture of four homologous repeat domains (DI to DIV), each bearing six transmembrane alpha helices (Fig. 1A). In addition to opening with changes in membrane voltage, a key feature of CaVchannels is their selective permeability for Ca2+, which acts as a second messenger in the cytosol. Hence, CaV channels are able to translate electrical signals at the cell membrane into cytoplasmic Ca2+ signals, for example at the presynaptic terminal where they drive vesicle exocytosis and neurotransmitter release (i.e., excitation-secretion coupling) and in muscle where they drive contraction (excitation-contraction coupling) (2).
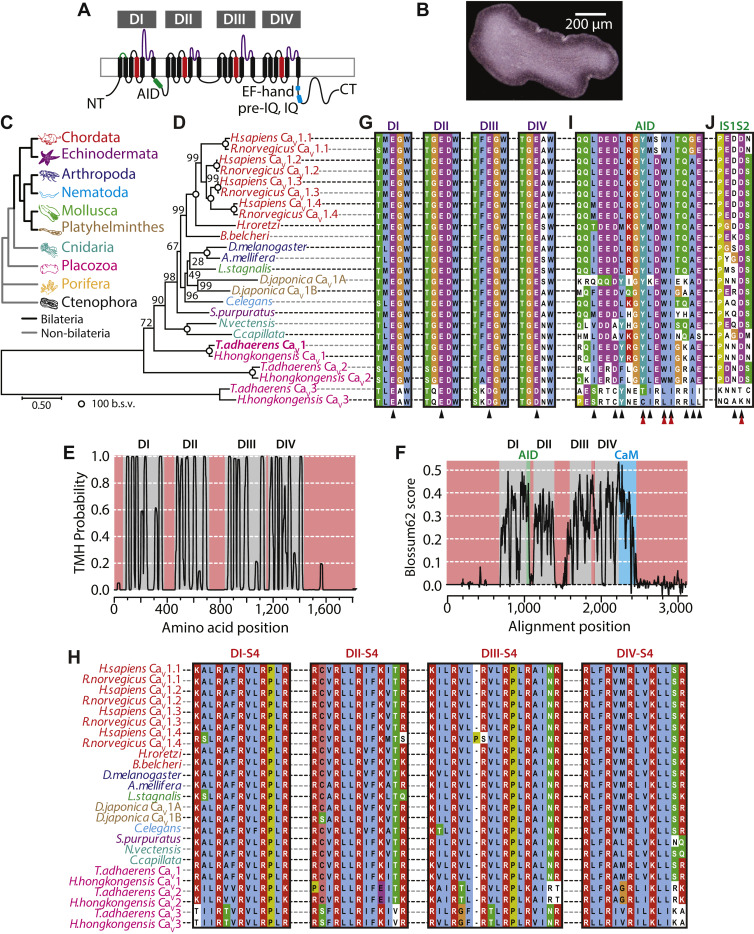
Conserved structural features of the Trichoplax CaV1 (TCaV1) channel.
A, illustration of the TCaV1 channel membrane topology. Four sets of six transmembrane segments are arranged in four repeat domains (DI–DIV), connected to each other with extracellular and cytosolic loops/linkers respectively. The N terminus, C terminus, alpha interaction domain (AID), as well as C-terminal EF hand, pre-IQ, and IQ regions required for calmodulin-dependent regulation are indicated and color coded with respect to panels Fto J. B, top-down micrograph of Trichoplax adhaerens reveals its small, asymmetrical body plan. C, cladogram depicting the proposed sister relationship of placozoans to bilaterians (black lines) and nonbilaterian invertebrates (gray lines). The colors are used to code for each phylum represented in panels D and H. D, maximum likelihood phylogenetic tree of representative full-length CaV1 channel protein sequences from major animal phyla, as well as CaV2 and CaV3 channels from the placozoans Trichoplax adhaerens and Hoilungia hongkongensis. Branch length scale bar on the bottom left corresponds to 0.5 substitutions per site, and nodes are labeled with bootstrap values for 1000 ultrafast replicates. E, Phobius (127) transmembrane helix probability plot of the TCaV1 channel protein sequence. DI to DIV are back colored in gray, while the cytoplasmic N terminus, C terminus, and cytoplasmic linkers are back colored red. F, EMBOSS Plotcon (128) running window similarity plot of the TCaV1 channel protein aligned with single representative CaV1 channels from each phylum included in panel D, revealing strong conservation within the transmembrane segments of DI to DIV (gray) and highly divergent cytoplasmic regions (red). The AID and calmodulin-interacting domains are highlighted in green and blue, respectively. G, amino acid sequence alignment of the selectivity filters from DI to DIV reveals a conserved four-glutamate selectivity filter P-loop motif (i.e., EEEE, indicated by black chevrons), present in all CaV1 and CaV2 channels, whereas placozoan CaV3 channels resemble other CaV3 channels with aspartate residues in lieu of glutamate in domains DIII and DIV (i.e., EEDD). Also conserved among all included calcium channels is an asparate residue adjacent to the DII selectivity filter glutamate, thought to contribute to Ca2+ selectivity. H, alignment of DI to DIV segment 4 (S4) helices that make up the voltage sensors. Positively charged lysine (K) and arginine (R) residues critical for voltage sensing are highlighted in red. I, protein alignment revealing conserved AIDs within the DI–DII cytoplasmic linkers of CaV1 and CaV2 channels, absent in CaV3 channels, which are required for interaction with the CaVβ ancillary subunit. The black chevrons denote amino acid positions that interface with the CaVβ protein, and red chevrons indicate amino acids positions considered most critical for the interaction (37, 38). J, alignment revealing a highly conserved aspartate in the DI S1–S2 extracellular loop of CaV1 and CaV2 channels that is essential for the interaction with the CaVα2δ1 ancillary subunit (39). CT, C terminus; NT, N terminus; TCaV, T. adhaerens voltage-gated calcium channel; TMH, transmembrane helix.
Most animals possess three types of CaV channels that separate into two ancient and phylogenetically distinct clades: CaV3 or T-type channels, which become activated by small membrane depolarization and are classified as low-voltage–activated channels, and high-voltage–activated or HVA channels, which are further classified as CaV1 or L-type channels and CaV2 or N-, P/Q-, and R-type channels (3). CaV3 channels are present in the genomes of single-celled choanoflagellates, our closest unicellular ancestors, and hence likely evolved before the emergence of animals (4). CaV1 and CaV2 channels are thought to have evolved strictly in animals via gene duplication of an ancestral CaV1/2-type channel type, still present in choanoflagellates and poriferan animals (sponges) (4, 5). In accordance, CaV1, CaV2, and CaV1/2 channels share common structural features that distinguish them from CaV3 channels, including an alpha interaction domain (AID) in the cytoplasmic linker between DI and DII, where the obligate ancillary subunit CaVβ binds and regulates channel membrane expression and gating (1, 6). The association of the CaV1 and CaV2 channels with CaVβ was likely inherited from the ancestral CaV1/2 channel, given the presence of a CaVβ gene in choanoflagellates (4, 7) that can regulate mammalian CaV1.2 and CaV2.3 channels in vitro (8), and the unpublished observation that efficient in vitro expression of the CaV1/2 channel cloned from the choanoflagellate Salpingoecca rosettarequires co-expression with its cognate CaVβ subunit (9). CaV1 and CaV2 channels also require the ancillary subunit CaVα2δ for their membrane expression, localization, and gating characteristics, which in contrast to the cytoplasmic CaVβ subunit associates with extracellular regions of the pore-forming α1 subunit (6). Whether this subunit also interacts with and regulates extant CaV1/2 channels is unclear, given its reported absence in the genomes of poriferans and choanoflagellates, the only organismal lineages known to possess CaV1/2 channels (4).
Also in accordance with their evolutionary relatedness, CaV1, CaV2, and CaV1/2 channels share C-terminal EF-hand, pre-IQ, and IQ domains/structures where the Ca2+ sensor protein calmodulin (CaM) binds and regulates channel gating. For CaV1 and CaV2 channels, Ca2+/CaM regulation is an important feedback mechanism that permits fine tuning of cytoplasmic Ca2+ influx in response to background Ca2+ levels. Most often, Ca2+/CaM regulation of CaV1 and CaV2 channels results in accelerated inactivation of macroscopic currents recorded under voltage-clamp (i.e., Ca2+-dependent inactivation or CDI), although vertebrate CaV2.1 channels can also exhibit Ca2+-dependent facilitation (10). Importantly, CaM bears two Ca2+-binding lobes (N and C terminal or N- and C-lobes), each with different Ca2+-binding properties. Specifically, the N-lobe exhibits weaker Ca2+ binding affinity and thus senses slow, global rises in cytoplasmic Ca2+, while the C-lobe has a much higher binding affinity, optimal for detecting transient local rises in Ca2+ emanating from the open channel pore (11). This difference in Ca2+ binding also permits experimental distinction between N- and C-lobe regulation, where N-lobe processes are disrupted by strong cytoplasmic Ca2+ buffering (e.g., 10 mM BAPTA), while C-lobe processes are buffer-resistant. Under strong buffering conditions, C-lobe regulation can be subsequently identified by switching the permeating cation from Ca2+ to Ba2+, the latter weakly binding CaM and hence unable to to triggering the CDI process (12).
In mammals, both CaV1 and CaV2 channels are subject to N-lobe regulation by CaM. However, CaV1.2 and CaV1.3 channels exhibit altered N-lobe modulation that is buffer resistant (i.e., local sensitivity), caused by direct interactions between CaM and the channels’ N termini, at structures referred to as NSCaTE (for N-terminal spatial Ca2+ transforming element) and NATE (for NSCaTE associated transduction element) (13, 14). Bilaterian (i.e., animals with bilateral body symmetry) invertebrate CaV1 channels also possess an NSCaTE motif; however, unlike CaV1.2 and CaV1.3, removal of this motif in vitrodoes not impact CDI (15), suggesting that this altered N-lobe regulation is a unique feature of mammalian CaV1.2 and CaV1.3 channels. Additionally, mammalian CaV1 channels, but not CaV2 channels, are also subject to pronounced, buffer-resistant CDI that is mediated by the C-lobe of CaM (10). Thus, altogether, a key distinction in CaM regulation between mammalian CaV1 and CaV2 channels is that only CaV1 channels exhibit buffer-resistant regulation for sensing local Ca2+ plumes, in addition to global sensitivity that is also apparent for CaV2 channels. Importantly, a similar distinction has been reported for the CaV1 and CaV2 channel homologues from the snail Lymnaea stagnalis, where under strong buffering conditions, the CaV2 channel lacks CDI when the permeating cation is switched from Ba2+ to Ca2+, while the CaV1 channel shows pronounced buffer-resistant CDI, that becomes apparent when Ca2+ is replaced with Ba2+ as the permeating cation (15, 16). Altogether, it is apparent that differential regulation of CaV1 and CaV2 channels by CaM is an ancestral trait that likely emerged hundreds of millions of years ago in last common ancestor of all bilaterians. However, the evolutionary origin of this distinction and whether it conserved in early diverging, nonbilaterian animals is not known.
The most early diverging animals to possess CaV1 and CaV2 channels, along with CaV3 channels, are species within the phylum Placozoa such as Trichoplax adhaerens (4, 5, 17). Trichoplax is a flat, disc-shaped marine invertebrate that lacks a neuromuscular system and synapses (Fig. 1B) and possess only six ultrastructurally distinguishable cell types (18). Despite their morphological simplicity, placozoans possess a large repertoire of genes associated with electrochemical signaling in the nervous system, which in addition to CaV channels, includes NaV and voltage-gated K+ channels (19, 20). Accordingly, placozoans produce action potentials (APs) (21), and it is likely that electrical and transient Ca2+ signaling play important roles in their biology. Having diverged from other animals over 600 MYA (22, 23), shortly after the emergence of CaV1 and CaV2 channels via gene duplication, placozoans can provide unique perspectives on the distinct evolutionary histories of CaV1 and CaV2 channels.
Previously, we determined the cellular expression and in vitro functional properties of the T. adhaerens CaV2 and CaV3 channel homologues (5, 24, 25). Here, we complete the characterization of the Trichoplax CaV channel set by similarly chracterizing the Trichoplax CaV1 channel, and describe the phylogenetic properties of the placozoan CaVβ and CaVα2δ and related subunit homologues. Trichoplax CaV1 (TCaV1) is expressed in contractile epithelial cells located on the dorsal epithelium and neuroendocrine-like gland cells located along the periphery of the animal. In vitro expression of the cloned channel is significantly increased upon co-expression with mammalian CaVβ1b and CaVα2δ1 subunits, in lieu of co-expressed Trichoplax ancillary subunits. Whole-cell voltage-clamp recording of transfected mammalian cells revealed robust high-voltage–activated Ca2+ currents with left-shifted voltage dependencies compared to the rat CaV1.2 channel (rCaV1.2), especially with respect to channel inactivation, producing a prominent window current at resting voltages between −50 and −30 mV. Interestingly, omission of a cotransfected CaVα2δ1subunit resulted in significant rightward shifts in channel activation and inactivation, underscoring the significance of this subunit in regulating TCaV1 channel gating. More similar to rCaV1.2 is the recovery from inactivation and kinetics for current activation, inactivation, and deactivation. Altogether, the functional properties of the Trichoplax CaV1 channel are somewhat divergent compared to the mammalian CaV1.2 channel orthologue, in line with the extreme phylogenetic distance between placozoans and bilaterians.
Similar to our finding for Trichoplax CaV2 (5), TCaV1 is insensitive to pharmacological blockers that are selective for mammalian orthologues, with minimal sensitivity to the dihydropyridine (DHP) blockers nifedipine, isradipine, and the two enantiomers of Bay K8644 which either block or enhance macroscopic currents. Considering the recent discovery of APs in the Placozoa, we compared the Ca2+ conducting properties of TCaV1 and TCaV2 using square voltage-clamp waveforms of different durations and frequencies, revealing similar Ca2+currents under most tested conditions. Where the two channels were found to differ was in their regulation by CaM. Specifically, whereas both channels are subject to CDI mediated by CaM, only TCaV1 exhibits modulation that is resistant to strong cytoplasmic Ca2+ buffering, evident when comparing inactivation properties when switching the permeating cation from Ca2+ to Ba2+. Thus, like in bilaterians, the Trichoplax CaV1 and CaV2 channels are differentially regulated by CaM, with the CaV1 channel capable of detecting local Ca2+ plumes, a feature that likely impacted the differential selection of CaV1 channels for specific Ca2+ signaling functions in different cellular contexts.
Results
The Trichoplax CaV1 channel bears the distinctive structural features of high-voltage–activated CaVchannels
T. adhaerens (Fig. 1B) is the most studied species from the phylum Placozoa (Fig. 1C), a group of simple seawater animals that have a phylogenetic sister clade relationship with bilaterians, and cnidarians (e.g., jellyfish, sea anemones, and corals). Placozoans lack a nervous system and synapses, although they possess most genes required for electrochemical neural signaling (19). The two most early diverging animal phyla are the poriferans (sponges) and ctenophores (comb jellies), the former lacking a nervous system (26) and the latter bearing the most divergent nervous systems, proposed by some to have evolved independently (27). Both ctenophores and sponges lack CaV1 and CaV3 channels (4), making placozoans the most early diverging group to possess a complete set of CaV1 to CaV3 channels, as well as one ancillary CaVβ and two CaVα2δ orthologues (20). A maximum likelihood phylogenetic tree of representative full-length CaV channel protein sequences from select species reveals phylogenetic relationships for CaV1 channels that mostly match the species phylogeny (28), with the orthologues from Trichoplax and the fellow placozoan Hoilungia hongkongensis being the most divergent, followed by those from cnidarians (Fig. 1D). Like most invertebrates (e.g., echinoderms, molluscs, nematodes, and most arthropods), placozoans possess single copy genes for CaV1 to CaV3 channels, whereas independent gene duplications produced multiple isotypes in certain lineages. For example, higher chordates possess four CaV1 channel isotypes (CaV1.1–CaV1.4), while more early diverging chordates such as tunicates (e.g., the sea squirt Halocynthia roretzi) and cephalochordates (e.g., the lancelet Branchiostoma belcheri) only have single CaV1 channel genes. CaV1 channels duplicated independently in Platyhelminthes (e.g., the planarian Dugesia japonica) to produce two isotypes, CaV1A and CaV1B (29). After placozoans, the next most early diverging animals to possess CaV1 to CaV3 channels are the cnidarians such as the starlet sea anemone Nematostella vectensis and the lion’s mane jellyfish Cyanea capillata, which notably duplicated CaV2 and CaV3 channels to produce three and two genes respectively, while retaining a single CaV1 channel gene (4, 5, 30, 31).
The open reading frame of the TCaV1 α1 subunit was cloned from a whole animal cDNA library, producing a consensus sequence encoding an 1822 amino acid protein with a predicted molecular weight of ∼208 kDa (GenBank accession number MW915585). When comparing the three Trichoplax CaVchannels to each other, the more proximal phylogenetic relationship between TCaV1 and TCaV2 is apparent as they share ∼41% sequence identity on a global protein alignment, compared to only 29% and 26%, respectively, with the TCaV3 channel. TCaV1 is also more similar to rat CaV1.2 than it is to TCaV2 and TCaV3, with 49% sequence identity. Structurally, the TCaV1 channel bears the hallmark features of bilaterian and cnidarian CaV1 and CaV2 channels (Fig. 1A), including four homologous repeat domains (domains I to IV), each bearing six predicted transmembrane alpha helices or segments (S1–S6) (Fig. 1E). Alignment of single representative CaV1 channel protein sequences from each phylum included in Figure 1D reveals that the transmembrane segments and intervening loops within the four repeat domains are highly conserved, while the N and C termini and cytoplasmic linkers between domains I to IV are highly divergent (Fig. 1F). Sequence conservation within domains I to IV includes four glutamate (E) residues within the extracellular pore-loop (P-loop) of each domain, located between S5 and S6, that form a Ca2+ selectivity filter motif of EEEE common to CaV1 and CaV2 channels (Fig. 1G). In contrast, and conserved in placozoans, CaV3 channels bear distinct selectivity filter motifs of two glutamate and two aspartate (D) residues (i.e., EEDD; Figs. 1G and S1). Notably, all three placozoan CaV channels possess a ubiquitously conserved aspartate residue adjacent to the DII selectivity filter glutamate (Fig. 1G), suggested to contribute to Ca2+ selectivity (32) but a reduced number of negatively charged amino acids four positions downstream of each selectivity filter residue which are thought to secondarily contribute (Fig. S1) (33, 34). There is also strong conservation of repeating positively charged arginine (R) and lysine (K) residues within the S4 helices of all CaVchannels (Figs. 1H and S1), key for voltage sensing (35). Notable is the deep conservation of proline (P) residues within DI and DIV S4 helices, important for the contribution of these segments to channel gating (36), and a lysine to glutamate substitution in the DII S4 helix of placozoan CaV2 channels, a unique feature that likely affects the local electrostatic environment due a switch in polarity and perhaps impacts gating.
An exception to the highly divergent cytoplasmic regions of CaV1 channels across phyla is the AID located between DI and DII (Figs. 1, A, I, F and S1), where the ancillary subunit CaVβ binds and regulates CaV1 and CaV2 channel membrane expression and gating. Within the AID is a highly conserved amino acid motif of tyrosine-X-X-tryptophan-isoleucine (YXXWI) which is critical for interactions with CaVβ (37, 38), also found in placozoan CaV1 and CaV2 channels, the S. rosetta CaV1/2 channel, but not CaV3 channels which lack an AID structure (Figs. 1I and S1). Placozoan CaV1 and CaV2 channels also bear a conserved, negatively charged aspartate residue in the extracellular DI S1–S2 loop (Fig. 1J), identified as a critical determinant for the interaction between the CaV1.2 α1 subunit and the ancillary subunit CaVα2δ1 (39). Lastly, we note deep conservation of C-terminal structures adjacent to DIV S6, named the EF-hand, pre-IQ, and IQ domains (Fig. 1, A and F), also present in S. rosetta CaV1/2 (Fig. S1), which are absent in CaV3 channels and are binding loci for the Ca2+ sensor protein CaM (discussed later).
Phylogenetic and primary sequence properties of the placozoan CaVβ and CaVα2δ ancillary subunits
Previously, T. adhaerens was reported to possess single CaVβ and CaVα2δ subunit homologues (4). Here, we sought to update these findings by searching for sequences within recently improved gene datasets for Trichoplax (20, 40), as well as H. hongkongensis (41). In accordance with the previous report, we identified single CaVβ protein sequences for each placozoan, both bearing predicted tandem SRC homology 3 (SH3) and guanylate kinase (GK) domains (Figs. 2A and S2 and File S1), a hallmark feature of the CaVβ subunit and other members of the membrane-associated guanylate kinase family (42). In accordance with the species phylogeny, the placozoan CaVβ subunits form a sister clade relationship with homologues from cnidarians and bilaterians on a phylogenetic tree (Fig. 2A). An exception is the highly divergent homologue from Caenorhabditis elegans, dubbed CCB-2, which lacks a predicted GK domain and in vivo, does not appear to regulate CaV channel α1 subunit function (43).
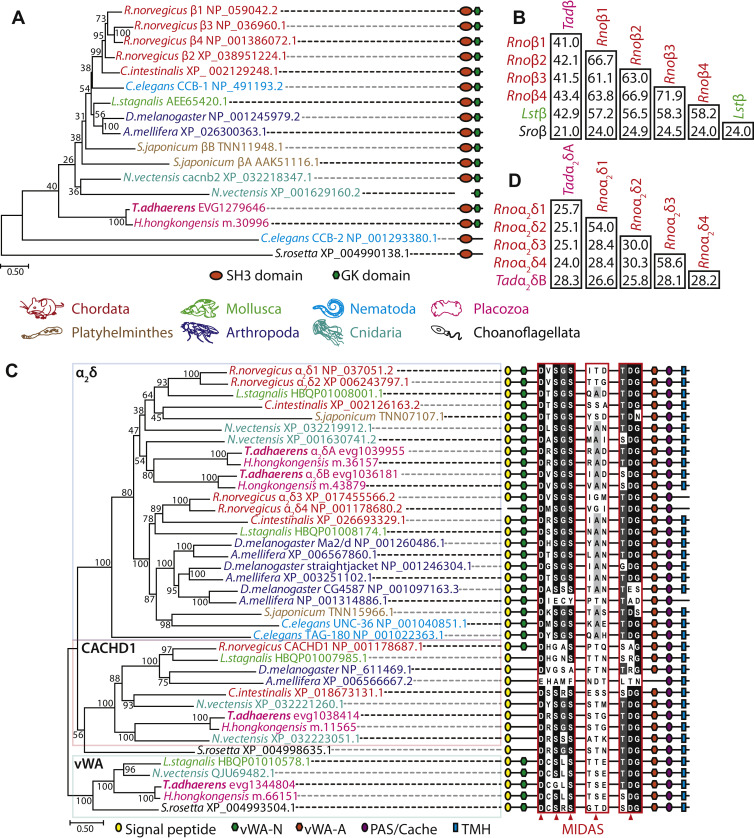
Phylogenetic properties of the Trichoplax adhaerens CaVβ and CaVα2δ subunits.
A, maximum likelihood protein phylogeny of select CaVβ ancillary subunits from select species, rooted on the homologue from the choanoflagellate species Salpingoeca rosetta, revealing that single homologues from the placozoan species Trichoplax adhaerens and Hoilungia hongkongensis placozoans form a sister clade relationship with most metazoan homologues, except the highly divergent C.eleganshomologue CCB-2. The symbols on the right of the phylogenetic tree depict successful prediction of SH3 and guanylate kinase (GK) domains using the structure prediction software InterProScan (129). Bootstrap node support values for 1000 ultrafast replicates are also presented on the phylogenetic tree, as well as the tree presented in panel C. B, sequence identity matrix for a global alignment of the Trichoplax adhaerens CaVβ protein sequence (Tadβ) with Rattus norvegicus CaVβ1–4 (Rnoβ1–4), Lymnaea stagnalis CaVβ (Lstβ), and Salpingoeca rosetta CaVβ (Sroβ). C, maximum likelihood protein phylogeny of α2δ and related proteins from select species, revealing that placozoans possess two α2δ homologues, a single CACHD1 homologue, as well as a single α2δ-like protein from a clade of homologues with similar primary structures as the α2δ subunit, including predicted von Wildebrand Factor type A (vWA) domains. The symbols on the right of the phylogenetic tree depict successful prediction of N-terminal signal peptides, vWA-N and vWA-A domains, PAS/cache domains, and C-terminal transmembrane helices using InterProScan (129). Also included are sequence alignments of the conserved metal ion-dependent adhesion site important for regulation of CaV1 and CaV2 channel α1 subunits. For panels A and C, the color coding of text refers to the different animal phyla as indicated in the legend located between the panels, and NCBI accession numbers for all sequence are included, with the exception of the placozoan homologues that were extracted from corresponding genome/transcriptome datasets (20, 41). D, sequence identity matrix for a global alignment of the Trichoplax adhaerensCaVα2δ protein sequences (Tadα2δA and Tadα2δB) with Rattus norvegicusCaVα2δ1–4 (Rnoα2δ1–4). Cache; Calcium channel chemotaxis receptors; MIDAS, metal ion-dependent adhesion site; PAS, Per-Arnt-Sim; TMHs, transmembrane helices.
Global alignment of the Trichoplax CaVβ (TCaVβ) protein sequence with that of the rat CaVβ1 to CaVβ4 subunits, and the functionally characterized homologues from the snail L. stagnalis (7) and S. rosetta (8), reveals strong sequence conservation within the SH3 and GK domains, including key residues within the GK domain that mediate interactions with the CaVα1 AID structure (38) (Fig. S2). This includes an “MLHKAL” motif, similar to the “LMQRAL” sequence of S. rosetta CaVβ shown to be essential for the ability of this divergent subunit to regulate mammalian CaV2.3 channels in vitro (8). Consistent with the phylogenetic relationships, the Trichoplax CaVβ is more similar to homologues from the rat and Lymnaea compared to S. rosetta, sharing between 41.0 and 43.4% amino acid sequence identity on a multiple alignment (Fig. 2B). TCaVβ also more resembles the rat and Lymnaea subunits in bearing an extended N terminus upstream of the SH3 domain, but more resembles the S. rosetta homologue with its shorter C terminus downstream of the GK domain (Fig. S2). Interestingly, TCaVβ as well as the Lymnaea and S. rosetta homologues resemble rat CaVβ2 in possessing large sequence inserts within the HOOK region that interrupt the SH3 domain structure, compared to the much shorter inserts found in rat CaVβ1 to CaVβ3 subunits (Fig. S2). This is significant because this unique feature of the mammalian CaVβ2 subunit imposes a significant rightward shift in the inactivation properties of calcium channels (44, 45), and as such, TCaVβ might also exert such effects on CaVα1subunits.
In contrast to the single CaVβ subunit, we identified 4 α2δ and related proteins for Trichoplax and Hoilungia, two of which form a strongly supported clade with bona fide α2δ subunits from bilaterians and cnidarians (Fig. 2C). Because of their proximity to each other on the phylogenetic tree, the set of Trichoplax and Hoilungia α2δ homologues likely duplicated from a single parent gene uniquely within the Placozoa, similar to the independent duplication apparent for arthropods which gave rise to three subunits (i.e., Drosophila melanogaster and Apis melliferastraightjacket, Ma2/d, and CG4587 homologues). Notably, all invertebrate animals included in the analysis possess two α2δ homologues, while mammals possess four (e.g., rat α2δ1 to α2δ4), with unclear phylogenetic relationships because of low node support values distributed within the α2δ clade. Also with strong node support, Trichoplax and Hoilungia each possess single CACHD1 homologues, shown in vertebrates to interact with and regulate CaV3 channels (46, 47), as well as a single protein falling within an undescribed clade of α2δ-like homologues, also apparent in L. stagnalis, N. vectensis, and S. rosetta (Fig. 2C). Domain prediction analysis reveals that most α2δ and related proteins share a conserved N-terminal signal peptide, von Willebrand A-N (vWA-N) and vWA-A motifs, a calcium channel and chemotaxis receptors (Cache) domain (also known as Per-Arnt-Sim or PAS domains), and a C-terminal transmembrane helix. Most homologues also possess a conserved divalent cation binding site, called a metal-ion–dependent adhesion site (MIDAS), within the vWA-A domain (Figs. 2C and S3), consisting of five polar/charged amino acids that likely binds Mg2+ or Ca2+ in the endoplasmic reticulum to regulate trafficking of the α1 subunit to the cell membrane (48).
A global protein alignment of the two Trichoplax α2δ subunits with rat α2δ1 to α2δ4 homologues reveals conservation of a C-terminal cysteine residue just upstream of the predicted transmembrane helix (Fig. S3), which in the mammalian subunits is posttranslationally modified to form a glycosylphosphatidylinositol anchor that tethers the subunit to the outer leaflet of the cell membrane (49). Interestingly, the two Trichoplax subunits share only 28.3% sequence identity with each other, which is similar to the divergence between the two clades of rat homologues (i.e., α2δ1/α2δ2 versus α2δ3/α2δ4; Fig. 2D). Furthermore, the Trichoplax α2δB subunit is slightly more similar to the rat homologues than α2δA, sharing between 25.8 and 28.2% sequence identity, compared to 24.0 to 25.1%.
TCaV1 expresses in vitro and is expressed in Trichoplax dorsal epithelial and type II gland cells
With the intention of expressing the TCaV1 channel in human embryonic kidney cell (HEK)-293T cells for electrophysiological characterization, we synthesized the channel cDNA with codon optimization for enhanced expression in human cells. This cDNA was cloned into two mammalian expression vectors: pIRES2-EGFP and pEGFP-C1. This produced the vectors pTCaV1-IR-EGFP and pEGFP-TCaV1 (Fig. 3A), the former allowing bicistronic expression of the TCaV1 channel protein separately from enhanced green fluorescent protein (EGFP) and the latter producing a fusion protein of TCaV1 with EGFP at its N terminus. A qualitative Western blot of HEK-293T cell lysates after transfection with the pEGFP-TCaV1 vector, using anti-GFP antibodies, produced a band of ∼250 kDa that roughly corresponds to the sum molecular weights of the TCaV1 channel (207.6 kDa) plus EGFP (28.9 kDa; Fig. 3B). This band was absent in untransfected cells but can be observed in all lanes that contain pEGFP-TCaV1. Furthermore, the bands appear to increase in intensity upon cotransfection with the rat CaVβ1b and CaVα2δ1 ancillary subunits, consistent with previous reports that these mammalian subunits can be efficiently used for expressing invertebrate CaV1 and CaV2 channels in vitro (50, 51, 52). To ensure equal protein loading, we performed Ponceau staining of the Western blot membrane, revealing similar protein levels for all samples (Fig. 3B). The observed effect of CaVβ1band CaVα2δ1 co-expression on TCaV1 abundance resembles our previous observations for the cloned Trichoplax CaV2 and CaV3 channels, whose expression also significantly increased upon co-expression with the two rat ancillary subunits, most markedly for TCaV3 (5, 24). To quantify the effect of the subunits on pEGFP-TCaV1 abundance, EGFP fluorescence intensity of HEK-293T cells transfected with the pEGFP-TCaV1 vector was examined and showed an additive increase upon cotransfection with the rat CaVβ1b and CaVα2δ1 subunit cDNAs (p ≤ 0.021 with a Holm–Sidak test after one-way ANOVA; p < 0.001, F = 46.0; Table S1). The CaVβ1b and CaVα2δ1 subunits increased fluorescence intensity when cotransfected separately, but cotransfection with both subunit cDNAs produced the greatest EGFP-TCaV1 expression, with the pattern: no subunits < CaVα2δ1 ≤ CaVβ1b < CaVβ1b plus CaVα2δ1 (Fig. 3, C and D). This increase in fluorescence was not due to changes in cell confluency between the different conditions (untransfected = 70 ± 2%; pEGFP-TCaV1 = 65 ± 4%; pEGFP-TCaV1 + α2δ1 = 68 ± 3%; pEGFP-TCaV1 + β1b = 68 ± 1%; pEGFP-TCaV1 + α2δ1+ β1b = 68 ± 4%; one-way ANOVA p = 0.484). Thus, similar to other high-voltage–activated CaV channels, TCaV1 expression in vitro significantly increased upon co-expression with CaVβ and CaVα2δ ancillary subunits (53), presumably through conserved interactions with the AID and DI S1–S2 loop, respectively (Fig. 1, I and J). Of note, we made efforts to characterize the in vitro properties of the Trichoplax CaVβ subunit but were unable to detect the ectopically expressed protein on Western blots via a hemagglutinin tag (not shown). As such, analysis of the functional properties of the Trichoplaxancillary subunits will be presented in a future study, using codon optimization which has been shown to significantly improve ectopic expression of Trichoplax genes in mammalian cells (54).
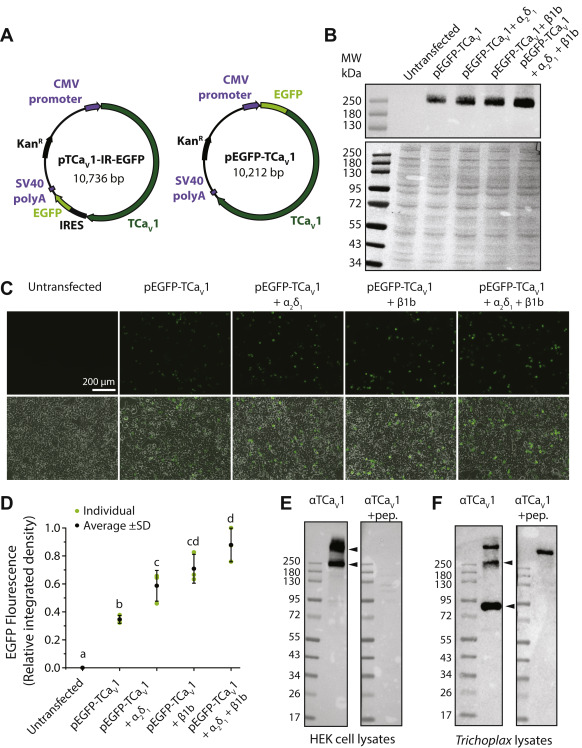
Expression of the TCaV1 protein in vitro and in vivo.
A, illustration of the pTCaV1-IR-EGFP and pEGFP-TCaV1 plasmid vectors for heterologous expression of the TCaV1 channel protein in human embryonic kidney (HEK)-293T cells. The pTCaV1-IR-EGFP vector permits bicistronic expression of TCaV1 and EGFP, whereas the pEGFP-TCaV1 vector fuses EGFP with the N terminus of TCaV1. B, top, qualitative Western blot of protein lysates from HEK-293T cells transfected with pEGFP-TCaV1 and various combinations of rat CaVβ1b and CaVα2δ1 ancillary subunits. Monoclonal anti-GFP antibodies reveal a band of ∼250 kDa, corresponding to the predicted molecular weight of ∼237 kDa for the full-length EGFP-TCaV1 fusion protein, which is absent from untransfected cells. The combination of both subunits appears to show the greatest intensity. Bottom, Ponceau stain of above Western blot showing equal protein content in each lane. C, fluorescence (top) and overlaid fluorescence and transmitted light images (bottom) of cultured HEK-293T cells transfected with pEGFP-TCaV1 with various combinations of accessory subunits. Intensity of the EGFP-TCaV1 fusion protein fluorescence increased upon cotransfection with the rat CaVβ1b and CaVα2δ1 ancillary subunits. D, plot of average EGFP fluorescence intensity ±S.D. (error bars) in micrographs of separately transfected HEK-293T cells (n = 3). Cotransfection of cells with both rat CaVβ1b and CaVα2δ1 ancillary subunits resulted in the greatest fluorescence intensity. Integrated density values were standardized to the maximal value across all experiments. Lower case letters denote significant differences (p ≤ 0.021) in integrated density as determined by a Holm-Sidak test (Table S1). E, Western blot of HEK-293T protein lysates expressing untagged TCaV1 protein from the pTCaV1-IR-EGFP vector. Custom rabbit polyclonal anti-TCaV1 antibodies (directed against 121 amino acids within the TCaV1 channel II–III linker) reveals strong ectopic expression of the TCaV1 channel when co-expressed with the rat CaVβ1b and CaVα2δ1 subunits. Two bands are visible on the blots, one at ∼250 kDa and a heavier band that did not migrate with the protein ladder, that disappeared after preadsorption of the anti-TCaV1 antibodies with recombinant peptide used to generate the antibodies (+pep.). F, Western blot of Trichoplax whole-animal protein lysates using the anti-TCaV1 polyclonal antibodies revealed three bands. A heavy molecular weight band that did not disappear with peptide preincubation and two bands with molecular masses of ∼90 and 260 kDa that did. EGFP, enhanced green fluorescent protein; TCaV, T. adhaerens voltage-gated calcium channel.
To enable studying the untagged TCaV1 protein, we generated rabbit polyclonal antibodies against a 121 amino acid recombinant peptide corresponding to the II-III linker (residues 730–850 of accession MW915585). These antibodies could detect a band corresponding to the untagged TCaV1 channel protein in Western blots of HEK-293T cell protein lysates after transfection with the pTCaV1-IR-EGFP vector, as well as a heavier band that did not migrate with the protein ladder (Fig. 3E). Both bands were absent in blots of untransfected cells (not shown). The specificity of the antibodies against the TCaV1 channel epitope was confirmed by preadsorption of the antibodies with excess recombinant II-II linker peptide, which caused both bands to disappear (Fig. 3E). Altogether, these data indicate that the TCaV1 channel is expressed as a full-length protein in HEK-293T cells and that a subset may be bound to other proteins, increasing its molecular weight.
The same polyclonal antibodies were then used to detect TCaV1 in Trichoplax whole animal protein lysates. Like the TCaV2 channel, the TCaV1 channel is present as an endogenous full-length protein but is also fragmented within the lysates (5). Here, anti-TCaV1 antibodies labeled bands at ∼90 and 260 kDa that disappeared with peptide preincubation, as well as a heavy molecular weight band that did not (Fig. 3F). The antibodies raised against the channel are specific to the II-III linker epitope sequence, and based on Basic Local Alignment Search Tool (BLAST) analysis of the Trichoplax genome and whole animal mRNA transcriptome (19, 20), they are unlikely to bind off target proteins in Trichoplax since the epitope does not produce significant alignments other than TCaV1. Thus, the heavy molecular weight band likely represents off-target binding by other antibodies present within the rabbit serum. The smaller 90 kDa band on the other hand is specifically targeted by the TCaV1 antibodies and may represent an endogenously expressed truncated variant of the channel, akin to CaV1.2 channels in the mammalian brain that become proteolytically cleaved at the DII-DIII linker, as a form of age-related regulation of channel activity (55). Overall, endogenous expression of TCaV1 is apparent, indicating an active role for the calcium channel in Trichoplax.
To examine the localization of the TCaV1 channel in Trichoplax, we performed whole-mount immunohistochemistry on fixed animals. The TCaV1 antibodies labeled two cell types: one along the outer edge that co-labeled with the cell-type marker wheat germ agglutinin (WGA) consistent with mucous secreting type II gland cells (56) and another more centrally, in a region dubbed the lipophil zone where digestive lipophil cells are expressed along the ventral/lower epithelium (Fig. 4, A–C) (56). Preadsorption of the TCaV1 antibodies with the II-III linker antigen caused the prominent fluorescence signal in the lipophil zone to completely disappear, whereas labeling of the type II gland cells was diminished but not abolished (Fig. 4D). Possibly, this residual nonspecific labeling corresponds to the large molecular weight protein that persisted on Western blots in the antibody preadsorption experiments (Fig. 3F). Thus, although the antibodies provide strong evidence for expression of TCaV1 within the lipophil zone, expression in gland cells was less conclusive. Three-dimensional reconstruction of the micrograph shown in Figure 4C reveals that TCaV1 is restricted mostly to the dorsal epithelium (Fig. 4, E–G), a region with cells that exhibit ultrafast contractions upon cytoplasmic Ca2+ influx (57). A single-cell transcriptome of Trichoplax also documented expression of TCaV1 in epithelial cells (metacell number 35) (58). This contrasts with the TCaV2 and TCaV3 channels, which we previously found to be expressed in gland cells (TCaV2 and TCaV3), but not within the dorsal or ventral epithelia (5, 24).
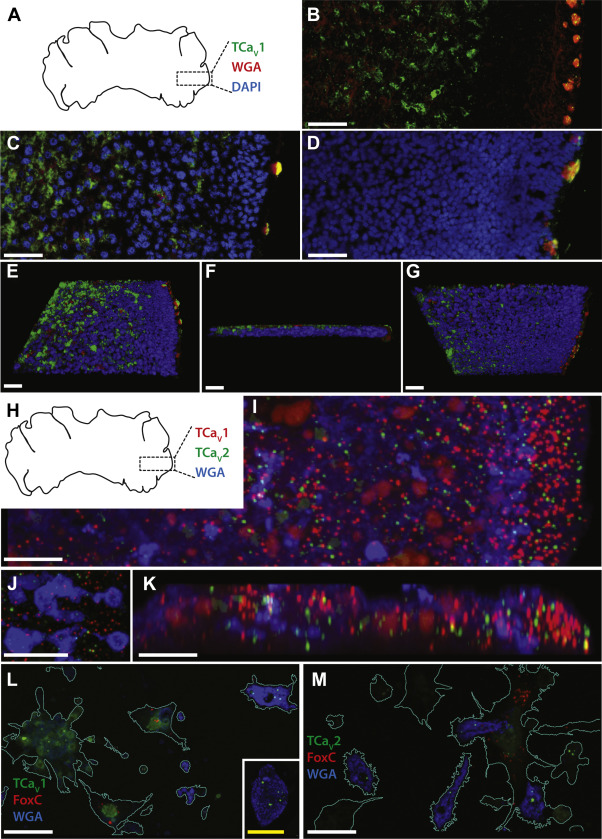
TCaV1 channels are expressed in dorsal cells within the central region and type II gland cells along the periphery of Trichoplax.
A, illustration of the dorsal view of Trichoplax adhaerens, indicating the relative area of animals imaged in panels B–G. Whole mount immunostaining using the rabbit anti-TCaV1 polyclonal antibody is in green, Type II gland cells stained using fluorophore-conjugated wheat germ agglutinin (WGA) are in red, and nuclei stained with DAPI are in blue. B, Z-projection fluorescence micrograph of a Trichoplax animal labeled with anti-TCaV1 and WGA reveals expression of the channel toward the center of the animal and in type II gland cells located along the periphery. C, fluorescence micrograph of a separate Trichoplax animal labeled with anti-TCaV1, WGA, and DAPI. D, control experiment where the TCaV1 antibody was preadsorbed with excess blocking peptide, revealing a complete loss of TCaV1 label along the interior but some residual labeling in type II gland cells. E, top-down view of a three-dimensional reconstruction of the micrograph Z-stack shown in C reveals expression of TCaV1 along the dorsal epithelium and within type II gland cells. F, side view of the three-dimensional reconstruction, with the dorsal epithelium oriented at the top and type II gland cells on the right. G, bottom view of the three-dimensional reconstruction showing reduced TCaV1 labeling along the ventral epithelium. H, illustration of the dorsal view of Trichoplax adhaerens, indicating the relative area of the animal imaged in panels I and J. Whole mount fluorescence in situ hybridization signal using RNAscope probes are red for TCaV1, green for TCaV2, and blue for type II gland cells labeled using fluorophore-conjugated WGA. I, Z-projection fluorescence micrograph (xy) of a Trichoplax animal reveals enriched expression of TCaV1 mRNA along the outer edge of the animal, including areas that overlap with WGA-positive type II gland cells and cells expressing the TCaV2 channel mRNA. J, enlarged view of type II gland cells as shown in panel I, revealing overlapping labeling of both TCaV1 and TCaV2. K, Z-projection fluorescence micrograph (xz) of a 5 μm wide strip of the image stack shown in panel I, revealing expression of TCaV1 mRNA along the outer edge and within interior regions. L, fluorescence micrograph of dissociated Trichoplax cells subjected to in situ hybridization for TCaV1 (green), the fiber cell marker FoxC (red), and WGA type II gland cell labeling (blue). TCaV1 mRNA was detected in type II gland cell that exhibit strong WGA labeling, in ventral epithelial cells (cell cluster near left), and in dorsal epithelial cells that exhibit weak, granular WGA staining (inset). No expression was observed in FoxC positive fiber cells. M, fluorescence micrograph of dissociated Trichoplax cells subjected to in situ hybridization for TCaV2 (green), the fiber cell marker FoxC (red), and WGA type II gland cell labeling (blue). TCaV2 mRNA was detected in type II gland cells, dorsal and ventral epithelial cells, and a subset of FoxC positive fiber cells. The white scale bar in all panels is 10 μm, and the yellow scale bar in the panel L inset is 5 μm. TCaV, T. adhaerens voltage-gated calcium channel.
The prospect that type II gland cells might resemble neuroendocrine cells in their co-expression of CaV1 to CaV3 channels (59) prompted us to explore co-expression of TCaV1 to TCaV3 mRNAs in this cell type via fluorescence in situhybridization (FISH; Fig. 3, H–M). Co-labeling with RNAscope probes complementary to the TCaV1 and TCaV2 mRNAs, and a fluorescent WGA probe (Fig. 4H), revealed enriched expression of TCaV1 and TCaV2 along the outer edge of Trichoplax, in regions harboring WGA-positive type II gland cells, as well as regions toward the interior (Fig. 4, I–K). We also performed FISH on dissociated Trichoplax cells, separately revealing expression of TCaV1 and TCaV2 in WGA-positive cells (Fig. 4, Land M). These data are consistent with our previous immunolocalization of the TCaV2 channel within type II gland cells (5), as well as the apparent immunolocalization of TCaV1 within these cells as noted above. Previously, immunolabeling experiments suggested that the TCaV2 channel is weakly expressed in fiber cells, which are located between the dorsal and ventral epithelia (5). We therefore co-labeled dissociated Trichoplax cells with RNAscope probes for the fiber cell marker FoxC (60), revealing an absence of labeling for TCaV1 (Fig. 4L) but weak labeling for TCaV2 in a subset of fiber cells (Fig. 4M). Expression of TCaV1 and TCaV2 mRNA was also observed in subsets of dorsal and ventral epithelial cells (Fig. 4, L and M). Lastly, in a separate set of FISH experiments on dissociated cells, we found that 57 ± 6.7% of dissociated type II gland cells (±standard deviation or SD) co-express all three TCaV channels (n = 99) and that 96.9 ± 3.1% express at least one of the three CaV channel mRNAs.
TCaV1 conducts high voltage–activated Ca2+currents with large window currents in vitro
To determine whether the recombinant TCaV1 channel could produce functional voltage-dependent calcium currents in vitro, we performed whole-cell patch voltage clamp recording of HEK-293T cells transfected with the pTCaV1-IR-EGFP plus pMT2 vectors for co-expressing the rat CaVβ1b and CaVα2δ1 ancillary subunits (61). Early in our experiments, we found that the transfected cells were generally unhealthy, and although we could record voltage-gated Ca2+ currents, these were quite small in amplitude. Based on preliminary analysis of the voltage properties of TCaV1, we noted large window currents and reasoned that constitutive Ca2+ influx was being toxic to the cells (detailed below). Hence, we included in our transfections a pcDNA3.1 plasmid expressing the mouse Kir2.1 inward rectifying potassium channel (i.e., pKir2.1-cDNA3) (62), to hyperpolarize the resting membrane potential below the TCaV1 window current (63). This approach greatly enhanced our ability to record TCaV1 currents in vitro, and hence, the Kir2.1 construct was cotransfected in all subsequent electrophysiological experiments.
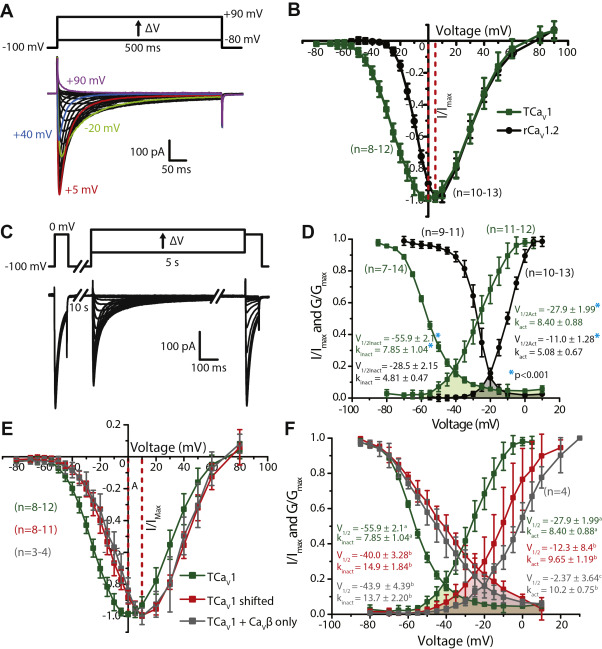
Depolarizing voltage steps from −100 mV to between −80 mV and +90 mV with an external recording solution containing 3 mM Ca2+ revealed inward Ca2+ currents that resemble T-type/CaV3 channels in their crossing over during the inactivation phase (Fig. 5A), indicative of accelerated channel inactivation upon stronger membrane depolarization. A normalized average current–voltage plot of the TCaV1 currents revealed a peak inward current at 0 mV, which is more depolarized than TCaV2 and TCaV3 with respective peak currents at −10 and −45 mV (Figs. S5B, S4A and Table 1). To compare the properties of TCaV1 with a well-studied vertebrate CaV1 channel homologue, we conducted parallel experiments with rat CaV1.2 (rCaV1.2) cotransfected with the same constructs and using the same recording solutions. Under these experimental conditions, the rat channel produced maximal inward currents at 5 mV, revealing a difference in current onset where the TCaV1 channel begins activating at more negative voltages.
TCaV1 channels conduct high-voltage–activated Ca2+ currents with large window currents in vitro.
A, sample macroscopic current traces recorded via whole-cell patch voltage clamp of HEK-293T cells transfected with pTCaV1-IR-EGFP, pKir2.1-cDNA3, rat CaVβ1b, and CaVα2δ1 subunits. The voltage-clamp protocol used to elicit the currents is depicted above, showing depolarizing voltage steps from −80 to +90 mV. B, standardized average peak macroscopic Ca2+ current ±SD (error bars) through TCaV1 (green) and rCaV1.2 (black) channels plotted over corresponding voltage steps reveals a hyperpolarized current-voltage relationship of the Trichoplaxchannel relative to rCaV1.2. C, voltage-clamp protocol used to assess inactivation of TCaV1 and rCaV1.2 channels (top) and sample currents recorded from the TCaV1 channel (bottom). Peak amplitudes of inward Ca2+currents elicited by a test pulse following a 5 s pulse to a range of inactivating voltages are compared to those elicited by a prepulse voltage step to 0 mV. D, plots of average inactivation and conductance ±SD reveal that TCaV1 channel properties are left shifted relative to rCaV1.2. The overlap between the inactivation and activation curves denotes window currents at voltages where a subset of channels are not inactivated and are able to become activated to constitutively conduct Ca2+ currents into the cell. The window current for TCaV1 (green fill) is 20 mV left shifted and spans a greater voltage range than the rCaV1.2 window current (gray fill). Average values for half-maximal activation and inactivation (V1⁄2Act and V1⁄2Inact) and the slope factors kact and kinact are shown and were calculated by fitting the activation and inactivation data with Boltzmann functions. Asterisks denote a significant difference (p < 0.001) between corresponding TCaV1 and rCaV1.2 V1/2 and k values as determined by a two-tailed t test. E, standardized average peak macroscopic Ca2+ current ±SD through TCaV1 channels co-expressed with the rat CaVα2δ1 and CaVβ1b subunits (green). Under the same conditions, certain cells produced currents that were right shifted with respect to their voltage dependence (red). These currents were replicated by cotransfecting TCaV1 with CaVβ1b and omitting the CaVα2δ1subunit (gray). F, plots of average steady-state inactivation and conductance ±SD reveal that compared to co-expression with CaVβ1b alone, the CaVα2δ1 subunit causes a leftward shift in the activation and inactivation curves of the TCaV1 channel. The overlap between the inactivation and activation curves denotes the window currents. The CaVα2δ1 subunit left shifts the window current (green fill) by 20 mV and reduces its magnitude. Average values for half-maximal activation and inactivation (V1⁄2) and the slope factors for activation (kact) and inactivation (kinact) are depicted and were calculated by fitting the activation and inactivation data with a Boltzmann function. Lowercase letters denote significant differences (p ≤ 0.015) between V1/2 and k values as determined by Holm–Sidak tests following one-way ANOVAs (Table S1). HEK, human embryonic kidney cell; rCaV, Rattus norvegicus voltage-gated calcium channel; TCaV, T. adhaerens voltage-gated calcium channel.
Table 1: Comparison of biophysical parameters of Trichoplax CaV1 to CaV3 channels and mammalian CaV1.2 and CaV2.1 channels
| Biophysical parameter | TCaV3a | TCaV1 | TCaV2b | rCaV1.2 | hCaV2.1b | TCaV1 versus TCaV2 | rCaV1.2 versus hCaV2.1 |
|---|---|---|---|---|---|---|---|
| Activation | |||||||
| Initial opening (mV) | −70 | −50 | −30 | −25 | −20 | Left shifted | Left shifted |
| Peak (mV) | −45 | 0 | −10 | 5 | 5 | Right shifted | Similar |
| V1/2 (mV) | −59.32 ± 0.9 | −27.9 ± 2.0 | −17.7 ± 2.2 | −11.0 ± 1.3 | −4.4 ± 2.8 | Left shifted | Left shifted |
| Slope factor (k, mV) | 4.5 ± 0.3 | 8.4 ± 0.9 | 3.8 ± 0.7 | 5.1 ± 0.7 | 3.8 ± 0.4 | Larger | Larger |
| Inactivation | |||||||
| V1/2 (mV) | −74.2 ± 0.9 | −55.9 ± 2.1 | −28.7 ±1.8 | −28.5 ± 2.2 | −34.3 ± 1.5 | Left shifted | Right shifted |
| Slope factor (k, mV) | 2.7 ± 0.1 | 7.9 ± 1.0 | 3.9 ± 0.5 | 4.8 ± 0.47 | 6.7 ± 1.0 | Larger | Smaller |
| Window current | |||||||
| Conductance and inactivation intersect (mV) | −68 | −40 | −22 | −20 | −15 | Left shifted | Left shifted |
| IWindow size at intersect (%) | 1.8 | 3.1 | 4.3 | 2.0 | 0.5 | Smaller | Larger |
| Recovery from inactivation | |||||||
| τ1 (s) | 1275.1±54.4 | 0.5 ± 0.1 | 1.6 ± 0.8 | 0.4 ± 0.2 | 0.7 ± 0.3 | Faster | Similar |
| τ 2 (s) | 8.6 ± 1.9 | 40 ± 6.1 | 7.1 ± 3.3 | 7.5 ± 3.5 | Faster | Similar | |
| Activation kinetics | |||||||
| τ at 0 mV (ms) | 11.3 ±1.3 | 2.6 ±0.7 | 10.5 ±1.5 | 2.1 ±0.2 | 2.6 ±0.3 | Faster | Faster |
| τ at +50 mV (−50 mV for TCaV3; ms) | 35.3 ± 4.6 | 1.3 ± 0.2 | 3.8 ± 0.4 | 0.8 ± 0.2 | 0.5 ±0.1 | Faster | Slower |
| Fold-change (0 to +50, or −50 to 0 mV) | 3.1 | 1.8 | 2.9 | 2.1 | 5.2 | Smaller | Smaller |
| Inactivation kinetics | |||||||
| τ at 0 mV (ms) | 52.8 ±4.8 | 178.8 ± 32.0b | 144.6 ± 31.0 | 188.8 ± 33b | 129.3 ± 19.5 | Slower | Slower |
| τ at +40 mV (−40 for TCaV3; ms) | 59.0 ±7.2 | 169.3 ± 29.0b | 185.2 ± 27.0 | 227.7 ± 45c | 206.1 ± 39.2 | Similar | Similar |
| Fold-change (0 to +40, or −40 to 0 mV) | 1.1 | 1.1 | 1.3 | 1.2 | 1.6 | Smaller | Smaller |
| Curve fitting | Mono-exp. | Bi-exp. | Mono-exp. | Bi-exp. | Mono-exp. | Bi-mono | Bi-mono |
| Deactivation kinetics | |||||||
| τ at −120 mV (−110 mV for TCaV3; ms) | 1.2 ± 0.2 | 1.1 ± 0.2d | 0.5 ± 0.2 | 0.5 ± 0.1 | 0.5 ± 0.05 | Slower | Similar |
| τ at −40 mV (ms) | 57.2 ± 8.8 | 2.1 ± 0.7d | 4.0 ± 0.7 | 0.7 ± 0.03 | 0.7 ± 0.1 | Faster | Similar |
| Fold-change (−120 to −40, or −110 to −40 mV) | 47.7 | 1.9 | 8.0 | 1.4 | 1.4 | Smaller | Similar |
| Curve fitting | Mono-exp. | Bi-exp. | Mono-exp. | Mono-exp. | Mono-exp. | Bi-mono | Mono-mono |
a Data for the TCaV3 channel were obtained previously using different recording solutions (i.e., 2 mM external Ca2+) (23).
b Data for TCaV2 and hCaV2.1 are from a previous publication (5).
c slow τ.
d fast τ.
To remove the effect of driving force and visualize the macroscopic conductance of the channel population in response to depolarization, peak inward Ca2+ currents were transformed into conductance values using Ohm’s law and fit with the Boltzmann function. This revealed that TCaV1 is half-maximally activated (V1/2) at −27.9 ± 1.99 mV compared to −11.0 ± 1.28 mV for rCaV1.2 (Fig. 5D). The rates of activation of TCaV1 and rCaV1.2 in response to depolarization, represented by the conductance slope factor (kact), were 8.40 ± 0.88 and 5.08 ± 0.67 mV, respectively. Both the 16.9 mV difference in V1/2values and the 3.32 mV difference in slope factors were significantly different between these two channels (p < 0.001, two-tailed t test). Thus, in addition to a hyperpolarized activation range, TCaV1 also exhibited reduced voltage sensitivity for activation compared to rCaV1.2. Next, we compared the voltage-dependent inactivation (VDI) properties of TCaV1 and rCaV1.2 to approximate the fraction of channels within a population that would be available for activation at different resting membrane potentials. A 0 mV depolarization step (“prepulse”) was used to determine the peak amplitude of macroscopic Ca2+ currents before inactivation (Fig. 5C). This was followed by prolonged (5 s duration) inactivating voltage steps between −80 and +10 mV and a test pulse to 0 mV to measure the decline in inward current relative to the prepulse that resulted from the inactivating voltages. Plotting the test pulse/prepulse current amplitude ratio as a function of inactivating voltage resulted in an inactivation curve for TCaV1 with a V1/2 of −55.9 ± 2.1 mV and a slope factor (kinact) of 7.85 ± 1.04 mV (Fig. 5D). Like activation, TCaV1 inactivation was significantly left shifted and less voltage sensitive than rCaV1.2, the latter having a V1/2value of −28.5 ± 2.15 mV and a kinact of 4.81 ± 0.47 mV (p < 0.001, two-tailed t test). Notably, the TCaV1 channel population did not fully inactivate, even at very depolarized voltages (Fig. 5D).
An important feature of calcium channels is their ability to conduct Ca2+ leak currents across a small range or “window” of resting voltages, where steady-state inactivation of the channel population is not complete, and a subset of channels can become activated. Window currents for example can contribute to the regulation of resting membrane potential, where tonic Ca2+ influx serves to draw the membrane voltage into the window current range (64). The overlap in the TCaV1 activation and inactivation curves reveals that the Trichoplax channel produces a prominent window current in the voltage range between −60 and +10 mV (Fig. 4D, green fill), with a projected maximum that is 20 mV left shifted compared to rCaV1.2 (Fig. 4D, gray fill). This is consistent with the difficulty we initially had in recording TCaV1 in HEK-293T cells, which have a resting voltage of roughly −25 mV (63). At −25 mV, roughly 7.2 ±1.6% of the TCaV1 channel population would be in an activatable state, of which 55.7 ±8.7% could become activated, compared to 34.9 ±9.0% and 6.7 ±2.4% for rCaV1.2, respectively. The product of these two values estimates the fraction of channels that would constitutively conduct calcium into the cell, which is 4.0% for TCaV1, compared to only 2.3% for rCaV1.2. Altogether, when comparing the activation and inactivation properties of the three Trichoplax CaV channels, it is apparent that TCaV1 operates in a voltage range that is between TCaV3 and TCaV2 channels (Fig. S4B) (5, 24). Furthermore, all three TrichoplaxCaV channels, and especially TCaV1, produce prominent window currents in vitro that would permit Ca2+ influx across a broad range of resting voltages (Fig. S4B).
Interestingly, a subset of cells expressing the TCaV1 channel produced currents with right shifted current–voltage properties compared to the more typical recordings (Fig. 5E). This population of channels exhibited half-maximal (V1/2) activation at −12.3 ± 8.4 mV and half-maximal inactivation at −40.0 ± 3.28 mV (Fig. 5F), both of which were significantly different from the standard currents reported above (p < 0.001 with Holm–Sidak tests after one-way ANOVAs; p < 0.001, F ≥ 36.6 for all comparisons; Table S1). The slope factors kact (9.65 ± 1.19 mV) and kinact (14.9 ± 1.84 mV) were also significantly larger, indicative of reduced voltage sensitivity (p < 0.001 with Holm–Sidak tests after one-way ANOVAs; p ≤ 0.015, F ≥ 6.9 for all comparisons; Table S1). Compared to the more typical currents, these cells exhibited an even larger window current, with an estimated 6.3% of channels conducting calcium ions at a resting voltage of −25 mV, compared to 4.0% for most other cells. Given the relative infrequency of these atypical currents and the knowledge that CaVβ and CaVα2δ subunits can significantly impact channel expression and gating, we reasoned that perhaps one or both subunits were not expressed in these cells or expressed at a lower level and hence not interacting with a subset of channels, accounting for the altered biophysical properties. Thus, we tried recreating these currents by recording cells in which either CaVβ1b, CaVα2δ1, or both subunits were excluded in the transfection. Interestingly, omission of both subunits, or just CaVβ1b, did not result in recordable TCaV1 currents. However, omission of just CaVα2δ1 produced currents with voltage properties that were very similar to the atypical currents, with a peak inward current at +10 mV and a statistically indistinguishable inactivation curve with a V1/2 value of −43.9 ± 4.39 mV and a kinact value of 13.7 ± 2.20 (Fig. 5E and F). In the absence of co-expressed CaVα2δ1, the activation curve was also similar with a statistically indistinguishable kinactvalue of 10.2 ± 0.75 and an even more right-shifted V1/2 value of −2.37 ± 3.64 (Fig. 5F). Altogether, the CaVα2δ1 subunit has a net hyperpolarizing influence on TCaV1 voltage properties and increases its sensitivity to changes in voltage. Surprisingly, even though CaVα2δ1 increased pEGFP-TCaV1 expression (Fig. 3, Cand D), there was no significant difference in peak current density between TCaV1 channels co-expressed with both subunits (−6.9 ± 4.0 pA/pF) and in the absence of CaVα2δ1(−3.1 ± 2.1 pA/pF), although the difference was trending on significant (p = 0.07, two-tailed t test). Furthermore, our inability to record TCaV1 currents in the absence of the CaVβ subunit suggests that even though both subunits promote similar increases in total channel protein expression (Fig. 3, C and D), the CaVβ subunit plays a more crucial role in targeting TCaV1 to the plasma membrane.
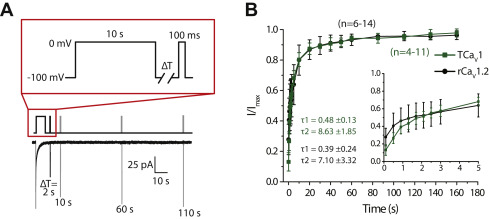
Another biophysical property that was examined was the recovery from inactivation. CaV channels with fast recovery from inactivation tend to remain active through prolonged bouts of excitation (e.g., AP burst firing), allowing for consistent levels of cytoplasmic Ca2+ influx. In contrast, channel populations with slow recovery are expected to accumulate inactivation and hence contribute less and less Ca2+ with prolonged excitation (65). To compare the recovery from inactivation for TCaV1 and rCaV1.2, we subjected the channels to a 10-s inactivating pulse and determined the peak current that could be elicited by a 0 mV step at different time intervals after inactivation (Fig. 6A). Consistent with previous reports (66, 67), the time course for recovery of rCaV1.2 was fitted by two time constants, with respective fast and slow components for the recovery process of 0.39 ± 0.24 ms (τ1) and 7.10 ± 3.32 ms (τ2; Fig. 6B). The TCaV1 channel population also exhibited bimodal recovery from inactivation and had statistically indistinguishable time constants of τ1 = 0.48 ± 0.13 ms (p = 0.441, two-tailed t test) and τ2 = 8.63 ± 1.85 ms (p = 0.424, two-tailed t test). Notably, TCaV1 recovery from inactivation falls between that of TCaV2, which recovers more slowly, and TCaV3, which recovers more quickly (Fig. S4C). In this respect, TCaV1 more resembles rCaV1.2 than its two Trichoplax paralogues.
TCaV1 and rCaV1.2 exhibit similar bimodal recovery from inactivation.
A, voltage-clamp protocol used to assess recovery from inactivation of TCaV1 and rCaV1.2 channels (top) and sample current traces recorded for the TCaV1 channel (bottom). Peak amplitudes of inward Ca2+currents elicited by a test pulse were measured at various intervals after a 10 s inactivating pulse. B, plots of average recovery from inactivation ±SD (error bars) of TCaV1 and rCaV1.2 channels. Inset, current amplitude recovery data for the first 5 s, with inflections in the curves indicative of two component recovery from inactivation for both channels. Biexponential curve fitting over the data produced similar τ1 and τ2 values for TCaV1 and rCaV1.2. rCaV, Rattus norvegicus voltage-gated calcium channel; TCaV, T. adhaerens voltage-gated calcium channel.
TCaV1 exhibits slower kinetics than rCaV1.2, with similar voltage dependencies
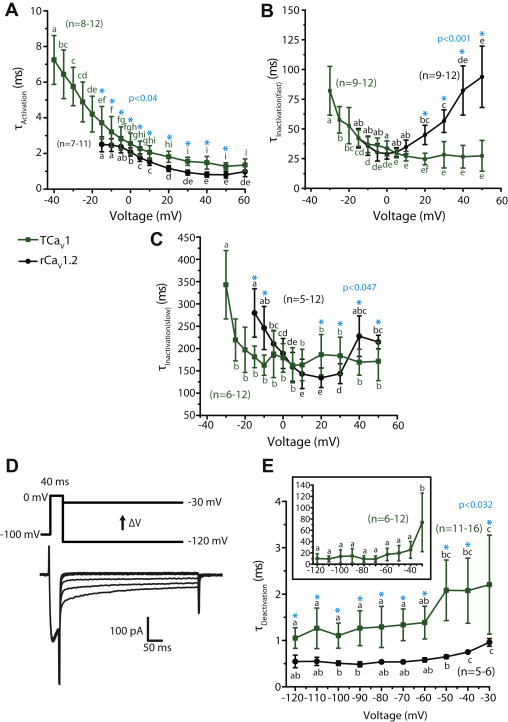
To compare the kinetic properties of TCaV1 and rCaV1.2 channel activation and inactivation, we fitted monoexponential or biexponential curves over the rise and decay phases of macroscopic TCaV1 and rCaV1.2 currents, producing respective time constants (Fig. 7, A–C). With increasing depolarization, both channels exhibited accelerating single component τactivationvalues (Fig. 7A), decreasing ∼2.6 fold from −15 mV to +60 mV (p < 0.05 for Holm–Sidak tests after one-way repeated measures ANOVAs; p < 0.001 and F ≥ 68.9 for all comparisons; Table S1). Because TCaV1 channels started activating at more hyperpolarized voltages compared to rCaV1.2, we could reliably curve-fit and quantify TCaV1 activation and inactivation kinetics to −40 mV, showing an extended trend of accelerating kinetics with stronger depolarization. Despite the similar trend, the activation of TCaV1 was slightly slower than rCaV1.2, with respective τactivation values of 3.7 ± 1.1 ms and 2.5 ± 0.4 ms at −15 mV and 1.3 ± 0.2 ms and 0.8 ± 0.2 ms at +50 mV (p ≤ 0.02 for a Holm–Sidak test after two-way ANOVA; p < 0.001 and F ≥ 9.1 for all comparisons; Table S1). Among TCaV channels, TCaV1 activation kinetics are very similar to those of TCaV3, and both are considerably faster than TCaV2 (Fig. S4D) (5, 24).
The activation and deactivation kinetics of TCaV1 macroscopic currents resemble those of rCaV1.2 in their voltage dependence, but the inactivation kinetics do not.
A, plot of average τActivation values ±SD (error bars) over depolarizing voltages. τActivation values were obtained by monoexponential curve fitting of the activation phase of macroscopic Ca2+currents. Both TCaV1 and rCaV1.2 exhibited accelerating activation with stronger depolarization, indicated by their decreasing τActivation values, with TCaV1 activating significantly slower at all corresponding depolarizing voltages. B, plot of average fast component τInactivation values ±S.D. obtained by biexponential curve fitting over the inactivation phase of macroscopic Ca2+ currents elicited by different depolarizing voltages. TCaV1 exhibited decreasing τInactivation(fast) values, whereas rCaV1.2 exhibited increasing values with stronger depolarization. C, plot of average slow component τInactivation values ±SD obtained by biexponential curve fitting over the inactivation phase of macroscopic Ca2+ currents. TCaV1 exhibited similar τInactivation(slow) values at most voltages, whereas the rCaV1.2 data were U-shaped. D, protocol used to assess deactivation kinetics (top), with a brief step to 0 mV followed by hyperpolarizing pulses to varying voltages. Sample TCaV1 tail current traces are shown below. E, plot of average τDeactivation ±SD for rCaV1.2, and the fast τDeactivation ± SD component for TCaV1 channels, revealing accelerating deactivation upon stronger hyperpolarization for both channels. The rCaV1.2 τDeactivation values were obtained by monoexponential curve fitting of the tail currents, whereas TCaV1 tail currents required biexponential curve fitting, producing fast and slow τDeactivation components. Inset, plot of the slow TCaV1 τDeactivation values ±SD. Across all voltages, the fast TCaV1 τDeactivation exhibits slower deactivation kinetics than rCaV1.2. In panels A, B, C, and E, different letters above data points denote statistically significant differences (p < 0.05) using a Holm–Sidak test after respective one-way repeated measures ANOVAs for TCaV1 and rCaV1.2 τ values. Asterisks denote statistically significant differences (p < 0.05) for paired comparisons of TCaV1 versus rCaV1.2 current τ values at different voltages using Holm–Sidak tests after two-way ANOVAs (Table S1). rCaV, Rattus norvegicus voltage-gated calcium channel; TCaV, T. adhaerens voltage-gated calcium channel.
The inactivation kinetics of both TCaV1 and rCaV1.2 had two components, τinactivation(fast) and τinactivation(slow), and both components were voltage dependent (Fig. 7, B and C). CaV1.2 channels were previously reported to also inactivate with two time constants (66, 67), with a fast component that decelerates with increasing membrane depolarization and a U-shaped slow component (67). In the present study, similar statistically significant trends were observed for the rCaV1.2 channel (p ≤ 0.04 for Holm–Sidak tests after one-way repeated measures ANOVAs; p < 0.001 and F ≥ 18.8 for all comparisons; Table S1). In contrast, the TCaV1 τinactivation(fast) kinetics accelerated with increasing voltage steps, whereas τinactivation(slow) accelerated from −30 mV to −25 mV then remained stable for all successive voltage steps (p ≤ 0.03 for Holm–Sidak tests after one-way repeated measures ANOVAs; p < 0.001 and F ≥ 11.0 for all comparisons; Table S1). As a result, at voltage steps to +20 mV or greater, both the fast and slow components of inactivation were significantly different between TCaV1 and rCaV1.2 channels (p < 0.05 for Holm–Sidak tests after two-way ANOVAs; p < 0.001 and F ≥ 8.9 for all comparisons; Table S1). Despite the differences, TCaV1 and rCaV1.2 resemble each other because both exhibit two-component inactivation, with fast and slow inactivating components that roughly fall within the same timescales. Compared to the other Trichoplax CaV channels, both of which inactivated with a single time constant (5, 24), it is notable that the fast inactivation component for TCaV1 resembles that of TCaV3, while the slow inactivation component resembles that of TCaV2 (Fig. S4E).
Finally, we examined the deactivation kinetics of the TCaV1 and rCaV1.2 channels. This property reflects how quickly channels transition from an open state to a closed, activatable state upon membrane hyperpolarization. CaV channels with slow deactivation remain open longer, thus conducting larger Ca2+currents during AP repolarization (i.e., tail currents) (68). TCaV1 and rCaV1.2 differ in that rCaV1.2 deactivation is a single component process, whereas TCaV1 deactivation is a double component process. Monoexponential curves were fitted over the tail currents elicited through open rCaV1.2 channels upon hyperpolarization to voltages between −120 mV and −30 mV, whereas biexponential curves were fitted over the TCaV1 tail currents (Fig. 7D). For both channels, τdeactivation exhibited voltage-dependent deceleration (Fig. 7E). Both TCaV1 τdeactivation(fast) and rCaV1.2 τdeactivation increased ∼2 fold, from 1.1 ± 0.2 ms at −120 mV to 2.2 ± 1.1 ms at −30 mV for TCaV1 and from 0.5 ± 0.1 ms at −120 mV to 1.0 ± 0.1 ms at −30 mV for rCaV1.2 (p ≤ 0.04 for Holm–Sidak tests after one-way repeated measures ANOVAs; p < 0.001 and F ≥ 8.7 for all comparisons; Table S1). On the other hand, TCaV1 τdeactivation(slow) was similar at most voltages, except at −30 mV, where the τ value increased to 73.9 ± 52.0 ms (Fig. 7E, inset; p < 0.001 for Holm–Sidak tests after a one-way repeated measures ANOVA; p < 0.001 and F = 10.0 for all comparisons; Table S1). At the more depolarized voltages of −40 to −30 mV, there is a possibility that channel inactivation is contributing to the current decay because the TCaV1 channel undergoes activation and inactivation at these voltages. This suggests that the deactivation time may be even slower at these voltages. At all voltages, the fast deactivation component of TCaV1 was slightly slower than rCaV1.2 deactivation (p ≤ 0.03 for Holm–Sidak test after two-way ANOVA; p ≤ 0.042 and F ≥ 2 for all comparisons; Table S1), although both remained within a similar timescale across all voltages. Lastly, the classic distinction that CaV3 channels tend to have slower deactivation kinetics than CaV1 and CaV2 channels (69) seems to hold true for the Trichoplax homologues, at least when considering the fast deactivation component of TCaV1 (Fig. S4F).
Brief, repetitive depolarization elicits similar responses from TCaV1 and TCaV2 channels
T. adhaerens and H. hongkongensis cells were recently shown to exhibit APs (21). Extracellular recordings of Hoilungia crystal cells, which are identified as gravity sensors in the Placozoa (70), revealed APs ranging in duration from 1 to 3 ms and with a frequency of ∼130 Hz (21). In accordance with these observations, placozoans express an array of genes required for establishing resting membrane potential and generating graded and APs (19, 20, 30), including a unique expansion of NaVchannels (21) and a complete repertoire of Shab, Shal, Shaw, and Shaker voltage-gated potassium channels (71). Thus, we sought to explore how TCaV1 and TCaV2 channels will respond to simulated conditions of repeated excitation. We therefore applied a series of short depolarizing square pulses from −70 mV to +30 mV with a duration of 1, 2, or 3 ms to mimic APs of varying duration and frequency over the course of 1 s (Fig. 8A). At 100 Hz, as the duration of stimulation increased, the initial inward current amplitude increased with the pattern 3 ms > 2 ms > 1 ms, likely because more channels were able to activate when the depolarizations were longer, producing larger tail currents in response to membrane repolarization after each pulse (Fig. 8B). However, even though the initial current amplitude increased with pulse duration, the tail current amplitude decayed more rapidly over the course of 1 s. This suggests that at a frequency of 100 Hz, 2 and 3 ms-long pulses build up channel inactivation, whereas 1 ms depolarizations do not; a trend that can be seen for both TCaV1 and TCaV2 channels. Interestingly, when the pulses were 2 and 3 ms long, TCaV1 channels conducted Ca2+ as a combination of inward currents upon channel activation and tail currents, whereas Ca2+ influx through TCaV2 channels could only be observed as tail currents (Fig. 8B). This is likely due to the faster activation kinetics of TCaV1 channels compared to TCaV2 (Fig. S4). To determine if the differences in current amplitude reflect differences in cumulative Ca2+ influx, we examined the area of the inward Ca2+ currents elicited by 1, 2, and 3 ms depolarization pulses at 100 Hz over 1 s (Fig. 8C). To control for differences in channel expression levels between cells, we normalized the cumulative area of the Ca2+ currents to the peak amplitude of a voltage step that elicited maximal channel activation (see Experimental procedures). For both TCaV1 and TCaV2 channels, the cumulative integrated Ca2+ current was lowest with a 1 ms depolarization protocol (32.5 ± 18.3 pC/pA for TCaV1, 26 ± 5.8 pC/pA for TCaV2) and higher when the pulses were 2 ms (67.5 ± 9 pC/pA for TCaV1, 70.5 ± 17.3 pC/pA for TCaV2) or 3 ms long (88 ± 10.9 pC/pA for TCaV1, 106 ± 33.8 pC/pA for TCaV2; p < 0.01 with a Holm–Sidak test after a two-way ANOVA; p < 0.001 and F = 30 for all comparisons; Table S1). Finally, we examined the effect of varying depolarization pulse frequency on the peak Ca2+ current decay. We compared peak inward Ca2+ current amplitudes elicited by TCaV1 and TCaV2 channels with 1, 2, and 3 ms depolarization pulses that had a frequency of 20, 100, and 250 Hz (Fig. 8, Aand D). As the duration and frequency of the depolarization steps increased, there was a greater decay in current amplitude for both TCaV1 and TCaV2. At 250 Hz, the current amplitudes increased for the first few depolarization steps and then began to decay. The only condition that produced a difference in current decay between TCaV1 and TCaV2 channels was 3 ms pulses at 100 Hz, where TCaV1 exhibited faster decay with a τ value of 195 ±32 ms, compared to 264 ±39 ms for TCaV2 (Fig. 8D; p = 0.004 for two-tailed t test). Altogether, under the experimental conditions tested, TCaV1 and TCaV2 channels conduct similar levels of Ca2+ into the cytoplasm in response to a wide range of high-frequency stimulations.
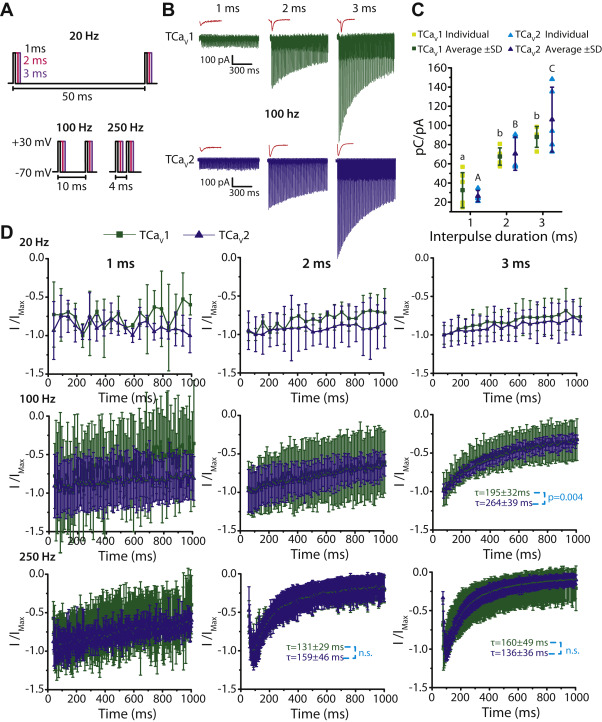
TCaV1 and TCaV2 channels respond similarly to short, repetitive depolarizing pulses.
A, depolarization steps from −70 mV to +30 mV lasting 1 ms (black), 2 ms (pink), or 3 ms (purple) at frequencies of 20, 100, or 250 Hz were used to elicit macroscopic Ca2+ currents through TCaV1 and TCaV2 channels. The time from the start of one depolarizing pulse to another is depicted below the voltage-protocol illustrations. B, sample macroscopic Ca2+ currents through TCaV1 (green) and TCaV2 (blue) channels in response to repetitive 1, 2, or 3 ms depolarizing steps for 1 s at a frequency of 100 Hz. The current resulting from the first pulse of each train is expanded and depicted in red (not to scale). C, average integrated Ca2+ current mediated by the TCaV1 and TCaV2 channels ±SD (error bars) at 100 Hz. Each dataset was obtained by integrating the total Ca2+ current in response to 1, 2, or 3 ms depolarizing pulses (pC units) and then normalizing to the peak current response (pA units) of a preceding 500 ms step depolarization to 0 mV. Cumulative Ca2+ influx was significantly lower when the depolarizing pulses were 1 ms long compared to 2 or 3 ms for both channels, but there was no difference in cumulative current between TCaV1 and TCaV2 channels. Uppercase letters denote significant differences between average TCaV2 values and lowercase letters denote significant differences between average TCaV1 values (p ≤ 0.01) as determined by a Holm–Sidak test after a two-way ANOVA (Table S1). D, plots of peak current amplitudes ±SD mediated by the TCaV1 and TCaV2 channels over the course of 1 s in response to repetitive 1, 2, or 3 ms depolarizing pulses at frequencies of 20, 100, or 250 Hz. To compare the decay of current over time from the TCaV1 and TCaV2 channels, current amplitudes were normalized to a maximal inward current value within the 1 s depolarization train, and these were curve fitted with a monoexponential decay function starting from the maximum inward current to determine average time constants (τ) for the decay process. The probability value reflects a statistically significant difference (p = 0.004) in average τ values between TCaV1 and TCaV2 using a two-tailed t test. TCaV, T. adhaerens voltage-gated calcium channel.
TCaV1 resembles rCaV1.2 in its sensitivity to the cation channel blocker Cd2+ but is insensitive to DHPs
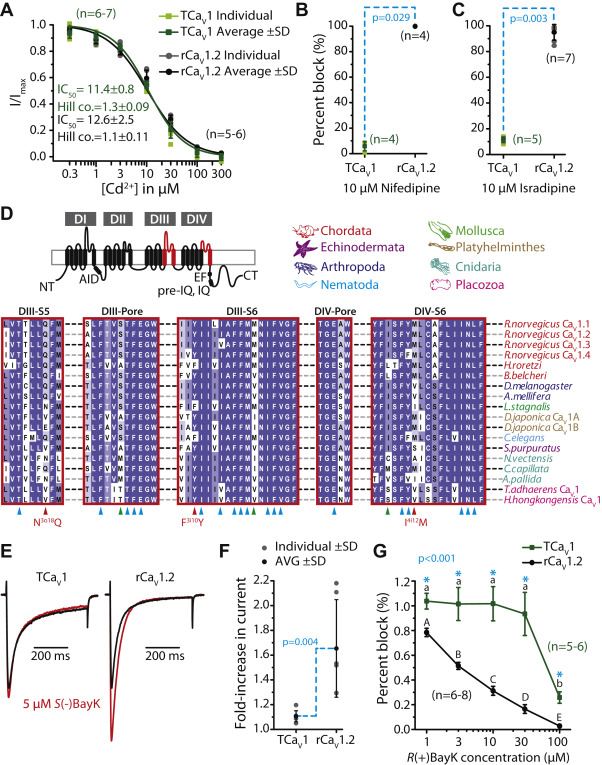
In vertebrates, the divalent cation cadmium (Cd2+) is considered a general blocker of high-voltage–activated CaV channels 72). Previously, we found the TCaV2 channel to have a Cd2+ block IC50 of 20.6 ± 2.8 μM, which was considerably less sensitive than human CaV2.1 with an IC50 of 1.0 ± 0.2 μM ((5). Perfusion of external Cd2+ at increasing concentrations blocked TCaV1 and rCaV1.2 channels with a similar affinity as TCaV2, with respective IC50 values of 11.4 ± 0.8 μM and 12.6 ± 2.5 μM that did not significantly differ from one another (Fig. 9A; p = 0.317 after a two-tailed t test). Thus, Cd2+ blocked the TCaV1 and TCaV2 channels with a lower affinity than the more sensitive hCaV2.1 channel.
The TCaV1 channel has similar sensitivity to cadmium (Cd2+) block as the rCaV1.2 channel but is relatively insensitive to dihydropyridines.
A, dose–response curve for block of average TCaV1 and rCaV1.2 peak macroscopic currents ±SD (error bars) with increasing concentrations of perfused external Cd2+ ions. IC50 and Hill coefficients ±SD are shown and were statistically indistinguishable between the two channels. B, plot of average percent block ±SD of peak macroscopic currents elicited by voltage steps to 0 mV for TCaV1 and rCaV1.2 upon external perfusion of 10 μM nifedipine, revealing complete block (99.7 ± 0.1%) for the rCaV1.2 channel, as opposed to only 5.8 ± 3.6% block for TCaV1 (p = 0.029 using a two-tailed ttest). C, plot of average percent block ±SD of peak macroscopic currents at 0 mV for TCaV1 and rCaV1.2 by external perfusion of 10 μM isradipine, revealing nearly complete block (95.0 ± 6.1%) for the rCaV1.2 channel, as opposed to only 11.5 ± 2.2% block for TCaV1 (p = 0.003 using a two-tailed ttest). D, top left, illustration of CaV1 channel protein highlighting regions that bear residues associated with high-affinity dihydropyridine binding (red). Top right, color-coding of phyla corresponding to the aligned CaV1 channel protein sequences shown below. Bottom, protein alignment of the DIII-S5, DIII pore-loop, DIII-S6, DIV pore-loop, and DIV-S6 regions of various CaV1 channels reveals presence/absence of key residues important for dihydropyridine binding. Blue and red chevrons reflect positions determined to be important for dihydropyridine block of mammalian and Lymnaea stagnalis channels, whereas green chevrons denote positions where TCaV1 and cnidarian CaV1 channels differ from the mammalian and Lymnaeahomologues. E, sample TCaV1 and rCaV1.2 current traces elicited by a voltage step from −100 mV to 0 mV with extracellular perfusion of 0 (black) or 5 μM S(-)BayK 8644 (red). F, plot of average fold-increase in current amplitude ±SD for TCaV1 and rCaV1.2 channels after application of 5 μM extracellular S(-)BayK 8644 agonist. Current amplitudes with 5 μM S(-)BayK 8644 were normalized to currents from the same cell prior to addition of the drug. Application of S(-)BayK 8644 caused a significantly greater increase in current for rCaV1.2 compared to TCaV1 (p = 0.004 for two-tailed t test). G, dose–response curve for change in mean TCaV1 and rCaV1.2 peak macroscopic currents ±SD with increasing concentrations of R(+)BayK 8644, revealing that TCaV1 is only blocked by this stereoisomer at high concentrations. Current amplitudes with R(+)BayK perfusion were normalized to currents from the same cell perfused with external solution lacking R(+)BayK. Uppercase and lowercase letters denote within-group significant differences (p ≤ 0.003) and asterisks denote between-group (i.e., TCaV1 versus rCaV1.2) significant differences (p ≤ 0.001) as determined by Holm–Sidak tests after a two-way ANOVA (Table S1). For all experiments, the holding potential was −100 mV. DI to DIV, domains I to IV; rCaV, Rattus norvegicus voltage-gated calcium channel; TCaV, T. adhaerens voltage-gated calcium channel.
We next examined the effects of the DHPs, nifedipine and isradipine, which are selective blockers of mammalian CaV1 channels (73). As expected, the rCaV1.2 channel was completely blocked by 10 μM of nifedipine and isradipine (99.7 ± 0.001% and 94.9 ± 0.06% block, respectively). In contrast, TCaV1 was relatively insensitive exhibiting a 5.7 ± 0.04% block by 10 μM nifedipine and a 11.5 ± 0.02% block by 10 μM isradipine (Fig. 9, B and C). The Trichoplax channel is therefore slightly less sensitive to DHP block than the CaV1 channel from the jellyfish C. capillata, where 10 μM nifedipine blocked peak current by roughly 25%, and 100 μM isradipine caused 36% block (31). The most studied invertebrate CaV1 channel with respect to DHP sensitivity is the homologue from Lymnaea(LCaV1), which unlike TCaV1 is fully blocked by 10 μM nifedipine (50). Nevertheless, side-by-side comparison of the snail channel with rCaV1.2 revealed a reduced sensitivity to DHP block, where isradipine produced an IC50 value of 632 nM for LCaV1 versus 43 nM for rCaV1.2 (74). In this particular study, comparison of known amino acids for DHP binding that are distributed within the CaV1 channel DIII S5–S6 helices and the DIV P-loop and S6 helices (74, 75, 76, 77, 78, 79, 80), combined with structural modeling, identified three key amino acids that differed in the Lymnaea homologue compared to rCaV1.2 (i.e., asparagine3o18, phenylalanine3i10, and isoluecine4i12; Fig. 9D). Mutation of these residues in LCaV1 to match those of rCaV1.2 (i.e., N3o18Q, F3i10Y, and I4i12 M) increased the channel’s sensitivity to isradipine to a level that resembled the rat channel, reducing the IC50 by an order of magnitude to 64.5 nM (74). Analysis of the TCaV1 channel protein sequence revealed that like LCaV1, it lacks the 3o18 glutamine (N) and 4i12 methionine (M) residues but contains a tyrosine (Y) in position 3i10 (Fig. 9D). This is also the case for the CaV1 channels from the cnidarians N. vectensis and Aiptasia pallida, but interestingly, the C. capillata homologue, noted as less sensitive to DHP block than mammalian CaV1 channels (31), contains the same residues in these key positions as rCaV1.2. The Trichoplax and cnidarian CaV1 channels also differ at additional positions from the vertebrate and Lymnaea homologues (Fig. 9D), and it may be that the lowered sensitivity for the Cyanea homologue is attributable to these divergent sites.
Lastly, we tested the effects of the DHP stereoisomers S(-)-BayK 8644 and R(+)BayK 8644, which respectively enhance and block macroscopic currents through mammalian CaV1 channels (81, 82). When applied extracellularly to the TCaV1 channel, 5 μM of the S(-) isomer increased the macroscopic currents elicited from a voltage step from −100 to 0 mV, but not to the same extent as rCaV1.2 (Fig. 8E). This resulted in a 1.11 ± 0.024-fold increase in peak current for TCaV1 versus1.64 ± 0.32-fold increase for rCav1.2 (Fig. 9F; p = 0.004 for a two-tailed t test). The R(+) isomer blocked TCaV1 channel currents (74.2 ± 0.05% block), but only at the highest concentration of 100 μM, whereas the rCaV1.2 channel was blocked by 97.3 ± 0.01% (Fig. 9G; p < 0.001 for a Holm–Sidak test after a two-way ANOVA; p < 0.001 and F ≥ 29.3 for all comparisons; Table S1). Altogether, TCaV1 is much less sensitive to DHPs compared to mammalian orthologues.
TCaV1 and TCaV2 exhibit differential regulation by CaM, like bilaterian channels
As noted, the Trichoplax CaV1 and CaV2 channels both possess conserved C-terminal EF-hand, pre-IQ, and IQ domains where the cytoplasmic Ca2+ sensor protein binds and generally promotes CDI (Figs. 1F and 10A) (10). Alignment of various calcium channel protein sequences reveals the conserved nature of the EF-hand, pre-IQ, and IQ domains in CaV1 and placozoan CaV2 channels (Fig. 10B). We note that key amino acids for preassociation of Ca2+−free CaM (ApoCaM), identified in CaV1.3 channels within the EF-hand and IQ regions (83), as well as aromatic amino acids in the IQ domains of CaV1.2 and CaV2.1/CaV2.3 channels that anchor Ca2+−bound CaM in X-ray crystallography structures (84, 85, 86), are broadly conserved (Fig. 10B). Notable is that the placozoan CaV1 and CaV2 channels bear several amino acid differences in these regions, more so than the early diverging homologues from cnidarians (Fig. 10B). Also notable is that amino acids that are deterministic for C-lobe regulation (i.e., C-lobe effector sites), which underlie the unique regulation of CaV1 channels by CaM (83), are not necessarily more similar between TCaV1 and other CaV1 channels, compared to TCaV2. Specifically, each Trichoplax channel type differs at six of these marked positions, occurring differentially within the EF-hand and pre-IQ domain structures (Fig. 10B).
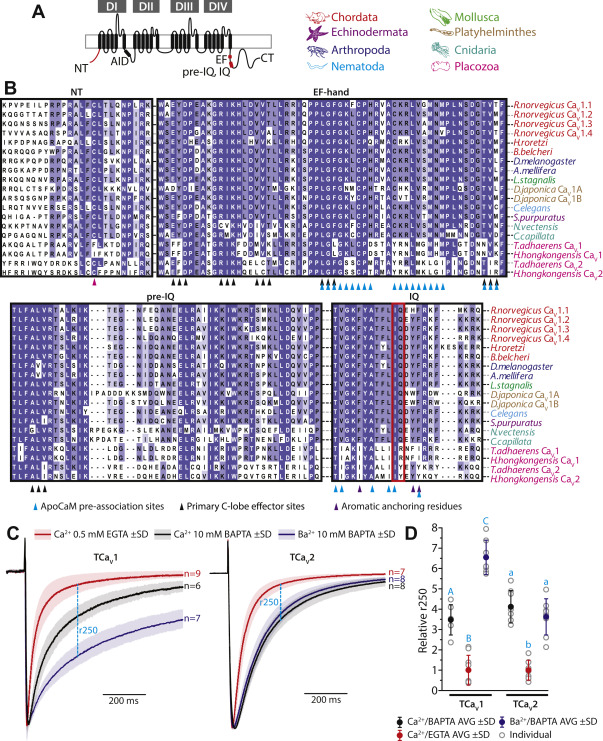
TCaV1 and TCaV2 channels undergo Ca2+/calmodulin-dependent inactivation.
A, left, illustration of the CaV1 channel protein highlighting regions that bear key residues for calmodulin regulation (red). Right, color-coding of phyla corresponding to the aligned CaV channel protein sequences shown in panel B. B, protein alignments of the N-terminal calcium-binding protein (CaBP) region and C-terminal EF hand domain, pre-IQ motif, and IQ motif from various CaV1 channel homologues, as well as the T. adhaerensand H. hongkongensis CaV2 channels. The pink chevron denotes a conserved cysteine residue within the CaBP region involved in N-lobe Ca2+/calmodulin-dependent inactivation of CaV1.2 channels (14). Bluechevrons denote amino acid positions required for preassociation of apocalmodulin (ApoCaM) to CaV1.3 channels (83), black chevrons denote amino acid positions determined to be effector sites for calmodulin C-lobe dependent inactivation of CaV1.3 channels (83), and purple chevrons denote conserved aromatic amino acids in the IQ regions of CaV1.2 and CaV2.1/CaV2.3 channels identified as anchor points for calmodulin binding in X-ray crystallography studies (84, 85, 86). The red box delineates the namesake IQ motif present in the IQ region of most CaV1 channels. C, average normalized macroscopic Ca2+ and Ba2+ currents of TCaV1 and TCaV2 channels (±SD), with either 0.5 mM EGTA or 10 mM BAPTA in the internal solution. Both TCaV1 and TCaV2 exhibited CDI with 0.5 mM EGTA that was disrupted with 10 mM BAPTA, but only TCaV1 channels retained an additional buffer-resistant CDI that became evident after replacing external Ca2+ with Ba2+. The location of residual current at 250 ms into the voltage step (r250) is indicated by the cyan-colored dashed lines. D, average relative r250 values ±SD (error bars) of TCaV1 and TCaV2 channels in response to three different conditions: 5 mM external Ca2+ and 10 mM internal BAPTA (black), 5 mM external Ca2+ and 0.5 mM internal EGTA (red), or 5 mM external Ba2+ and 10 mM BAPTA (purple). Values were normalized against the average r250 observed using 0.5 mM internal EGTA and 5 mM external Ca2+ for each channel. Uppercase and lowercase letters denote within-group significant differences (p ≤ 0.001) as determined by Holm–Sidak tests after one-way ANOVAs (Table S1). AID, alpha interaction domain; CT, C terminus; DI to DIV, domains I to IV; NT, N terminus; TCaV, T. adhaerens voltage-gated calcium channel.
Also noted earlier, CaV1.2 and CaV1.3 channels bear NSCaTE motifs at their N termini, which convert N-lobe mediated CDI into a local, buffer-resistant process (13). This motif is absent in vertebrate CaV1.1 and CaV1.4 channels, conserved in bilaterian invertebrate CaV1 channels, but absent in more early diverging CaV1 channels from cnidarians and placozoans (15). Thus, NSCaTE appears to be a bilaterian innovation. However, alignment of an N-terminal region just downstream of the NSCaTE motif (Fig. 10, A and B) reveals deep conservation of second motif, termed NATE, that contributes to N-lobe conversion mediated by NSCaTE (14). We note the presence of a deterministic cysteine residue in all included bilaterian and cnidarian CaV1 channels and placozoan CaV2 channels, identified as a secondary binding site for CaM within the NATE motif. Notably however, placozoan CaV1 channels lack this cysteine but, like most CaV1 channels, bear conserved proline (P) residues that flank this particular amino acid position, which would similarly impact the local secondary structure (Fig. 10B).
We sought to determine whether the TCaV1 and TCaV2 channels are regulated by CaM and if they differ in their regulation, like their bilaterian orthologues. In the presence of low intracellular Ca2+ buffering (i.e., 0.5 mM EGTA) with 3 mM Ca2+ as the permeating cation, voltage steps from −100 to 0 mV produce relatively fast inactivating currents for both TCaV1 and TCaV2 (Fig. 10C). Similar experiments, but with strong intracellular buffering that would selectively disrupt N-lobe modulation, resulted in decreased TCaV1 and TCaV2 channel inactivation consistent with a loss of CDI (Fig. 10C). The decrease in channel inactivation was quantified by determining the amplitude of residual current relative to peak at 250 ms into the voltage step (r250), normalized against the average r250 observed using 0.5 mM internal EGTA and 5 mM external Ca2+for each channel (Fig. 10D). Compared to 0.5 mM EGTA, 10 mM BAPTA caused the average r250 values of TCaV1 and TCaV2 to increase from 1.0 ± 0.7 and 1.0 ± 0.5 to 3.5 ±0.7 and 4.1 ±0.8, respectively (Fig. 10D; p ≤ 0.001 for Holm–Sidak tests after one-way ANOVAs; p ≤ 0.001 and F ≥ 35.9 for all comparisons; Table S1). Subsequently, switching external Ca2+with equimolar Ba2+ caused a significant slowing of TCaV1 current inactivation, with the average relative r250 value increasing to 6.6 ± 0.8 (p ≤ 0.001 for Holm–Sidak tests after one-way ANOVA), while TCaV2 showed no difference, with an r250 value of 3.6 ± 0.9. Notably, switching from Ca2+ to Ba2+ did not impact the activation properties of TCaV1, with the current–voltage relationship showing a similar peak at 0 mV (not shown). The loss of this additional CDI component in the presence of Ba2+ indicates that the TCaV1 channel is uniquely subject to buffer-resistant CDI, which given the absence of NSCaTE and NATE motifs is most likely due to C-lobe regulation. Thus, like in bilaterians, the TCaV1 and TCaV2 channels exhibit differential regulation by CaM, indicating that this divergence in modulatory control most likely evolved in the common ancestor of placozoans, cnidarians, and bilaterians, shortly after the emergence of these two channel types in early animals.
To confirm that the observed CDI processes were indeed mediated by CaM, we conducted a series of experiments employing a mutant CaM (CaM1234), which lacks the ability to bind Ca2+ (12). Previously, it has been documented that HEK-293T cells endogenously express CaM and that overexpression of this mutant form outcompetes the WT protein to prevent its regulation of CaV channels, disrupting the CDI process (83). For these experiments, we employed a classical approach that compares the amplitude of currents elicited by a test pulse as a function of various prepulses to different depolarizing voltages (87). Thus, the membrane was depolarized to various voltages ranging from −50 mV to +90 mV (i.e., the prepulses), and after a brief repolarization to −100 mV, a subsequent test pulse was taken to +5 mV (Fig. 11A). For TCaV1, TCaV2, and rCaV1.2 channels, the depolarizing prepulses elicited increasing amounts of Ca2+ to enter the cell, as more channels became activated, subsequently declining with a loss of driving force for Ca2+ influx and saturation of channel activation (Fig. 11, B, Dand F). In the presence of endogenous (wt) CaM, the peak current amplitude elicited by test pulses produced classic U-shaped relationships when plotted as a function of prepulse voltages (Fig. 11, C, E and G), attributable to a combination of CDI caused by Ca2+ influx and VDI that increases with stronger depolarization. At more depolarized voltages where Ca2+ influx began to decline, test-pulse current amplitudes recovered, attributable to a loss of the CDI effect. The smallest test pulse currents occurred after prepulses of +20 mV for TCaV1, 0 mV for TCaV2, and +10 mV for rCaV1.2, where the average current amplitudes decayed to 23.5 ± 0.1%, 22 ± 0.1%, and 27 ± 0.1% of the initial maximum current, respectively. Importantly, cotransfection of mutant CaM1234 completely disrupted CDI for all channels, isolating the VDI component (Fig. 11, C, E and G). Here, the currents only decayed to 59 ± 0.01% for TCav1, 58 ± 0.1% for TCaV2, and 79 ± 0.1% of the initial current at the noted peak prepulse voltages. In general, the current decay was significantly greater at most voltages in the presence of WT CaM compared to CaM1234 (p ≤ 0.025 for Holm–Sidak tests after two-way ANOVAs; p < 0.001 and F ≥ 7.0 for all comparisons; Table S1). Only when the voltage steps reached +50 to +70 mV was the difference between mutant and WT CaM not significant, where only VDI is apparent. This indicates that CaM can modulate the inactivation of all three channels in a Ca2+−dependent manner.
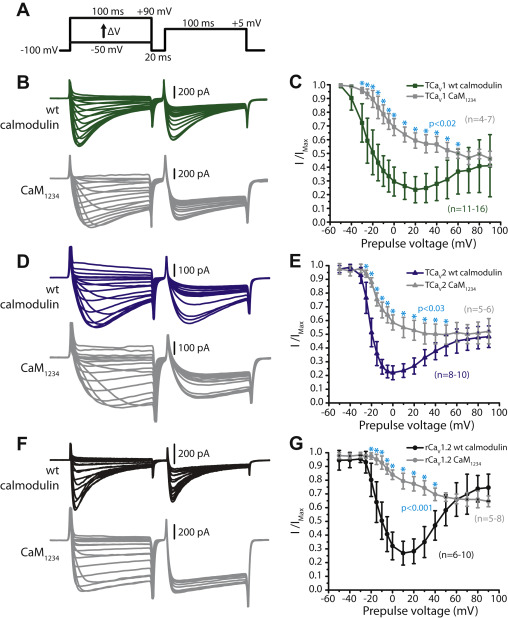
Voltage-dependent and calcium-dependent inactivation are two separate processes in TCaV1, TCaV2, and rCaV1.2 channels.
A, protocol used to examine calcium-dependent inactivation. Prepulse voltage steps from −50 mV to +90 mV caused an influx of varying amounts of Ca2+ into the cell, after which test pulses to +5 mV were used to measure the effect of Ca2+influx on peak current amplitude. B, top, sample macroscopic Ca2+ current traces from TCaV1 with endogenous, wildtype (wt) calmodulin, or bottom, co-expressed with mutant CaM (CaM1234). C, plot of average TCaV1 current amplitudes ±SD (error bars) elicited by the test pulse expressed relative to the prepulse voltage. D, sample current traces illustrating the effect of wt calmodulin (top) and CaM1234 (bottom) on peak inward TCaV2 Ca2+ currents. E, plot of average TCaV2 current amplitudes ±SD elicited by the test pulse over the prepulse voltage. F, sample current traces illustrating the effect of wt calmodulin (top) and CaM1234 (bottom) on peak inward rCaV1.2 Ca2+currents. G, plot of average rCaV1.2 current amplitudes ±SD elicited by the test pulse over the prepulse voltage. For all plots, asterisks denote significant differences (p < 0.03) between TCaV1, TCaV2, or rCaV1.2 current amplitudes as determined by Holm–Sidak tests after a two-way ANOVAs (Table S1). rCaV, Rattus norvegicus voltage-gated calcium channel; TCaV, T. adhaerens voltage-gated calcium channel.
In addition to modulating inactivation, CaM was also able to alter TCaV channel current density. Whereas the rCaV1.2 channel current density was not significantly different with WT CaM (−9.3 ± 4.7 pA/pF) and CaM1234 (−6.2 ± 5.1; p = 0.233 with a two-tailed t test), TCaV1 current density increased when CaM1234 was overexpressed (WT CaM = −5.9 ± 4.0 pA/pF; CaM1234 = −19.4 ± 10.2 pA/pF; p < 0.001 after a two-tailed t test), whereas TCaV2 current density decreased with CaM1234(WT CaM = −14 ± 5.0 pA/pF; CaM1234 = −4.5 ± 3.9 pA/pF; p = 0.002 after a two-tailed t test). The effect of CaM on TCaV2 current density has been reported previously for other channels (88, 89), but its effect on TCaV1, to our knowledge, has not been observed. Whether the increased current density with CaM1234is due to a change in TCaV1 cell surface expression or channel open probability will have to be followed up in a future study.
TCaV1 is not subject to direct regulation by G proteins in vitro
Previously, we documented that the TCaV2 channel lacks a key functional feature that is unique to its bilaterian CaV2 orthologues, namely direct inhibition by G protein βγ proteins (5). G protein regulation of CaV2 channels permits control of Ca2+ influx at synapses and other cellular compartments through G protein–coupled receptors and their neuromodulatory ligands (90). Interestingly, the cloned Trichoplax Gβγ proteins inhibit the human CaV2.1 channel in vitro, indicating that the absence of regulation for TCaV2 is likely due to structural features of the α1 subunit and not the G proteins. Here, we sought to rule out G protein regulation of the TCaV1 channel, by conducting a similar set of in vitro experiments as done previously for TCaV2. We find no evidence for direct Gβγ inhibition of TCaV1 (Fig. S5), suggesting that this unique form of regulation evolved strictly in bilaterians.
Discussion
On the phylogeny and evolution of CaV channel α1subunits
In this study, we complete the initial characterization of CaVchannel α1 subunits from T. adhaerens from the most early diverging phylum where CaV1, CaV2, and CaV3 channels co-exist. Trichoplax is only the third invertebrate species for which this has been done, the other two being the mollusc snail L. stagnalis (16, 50, 91) and the arthropod honeybee Apis melifera (92). The two most early diverging animal phyla, Porifera (sponges) and Ctenophora (comb jellies) (Fig. 1C), independently lost CaV3 channels and lack CaV1 channels (ctenophores and sponges) and CaV2 channels (sponges) (4, 5). Sponges are therefore unique among animals in that they lack CaV1 to CaV3 channels, possessing instead a CaV1/2 channel also found in premetazoan single-celled choanoflagellates like Salpingoeca rosetta (4). Because of its phylogenetic sister relationship and shared structural features with CaV1 and CaV2 channels (Fig. S1) and apparent premetazoan origin, the CaV1/2 type channel is proposed to have given rise to CaV1 and CaV2 channel types via one or more gene duplication events, early on in animal evolution (4, 5). Nevertheless, we lack an understanding of precisely when and in which animal lineages these evolutionary events took place. Confounding the matter is the unresolved placement of either sponges or ctenophores as the most early diverging animals on the metazoan phylogenetic tree. That is, whereas numerous phylogenomic studies suggest that ctenophores are the most early diverging (28, 93, 94), others support the classic morphology-based view that sponges are (95, 96). Perhaps, the most parsimonious explanation for CaV channel evolution in animals comes about if we consider sponges as the most early diverging. Here, the duplication of a CaV1/2 channel gene that gave rise to CaV1 and CaV2 channels could have occurred after sponges diverged, in the common ancestor of ctenophores, placozoans, cnidarians, and bilaterians (Fig. 1C). Since ctenophores lack CaV1 channels, they would have lost this gene (in addition to CaV3 channels), retaining only a single CaV2 channel orthologue, while placozoans, cnidarians, and bilaterians all retained CaV1 to CaV3 channels.
Our analysis of the TCaV1 protein sequence revealed deep conservation of hallmark structural features conserved among CaV1, CaV2, and CaV1/2 channels (Figs. 1, 10 and S1). This includes ion selectivity filter motifs of EEEE (EDEE for the S. rosetta CaV1/2), voltage sensor S4 helices with positively charged lysine and arginine amino acids, and structures for interacting with the CaVβ (AID) and CaVα2δ subunits (domain 1 S1–S2 loop). Indeed, although transmembrane regions tend to be well conserved when comparing CaV1 channels across phyla, most of the cytoplasmic linkers and N and C termini are extremely divergent (Fig. 1F), and this is also the case for CaV2 and CaV3 channels (5). This is significant because these cytoplasmic regions, which are generally devoid of secondary structure, are often sites for unique modulation of the α1 subunit by cytoplasmic factors including interacting proteins and kinases (97, 98, 99, 100). Thus, modulation at these divergent loci might be very different among channel orthologues from different phyla. Still, there is evidence that stretches of intrinsically disordered, highly divergent protein sequences might nevertheless harbor conserved functional short linear motifs that are difficult to identify via sequence alignment (101), or cryptic molecular signatures that are not apparent in sequence alignments at all (e.g., length, amino acid composition, net charge) (102).
We also found the C-terminal EF-hand, pre-IQ, and IQ domain structures to be present in the TCaV1 channel protein (Figs. 10Band S1), indicative of regulation by the Ca2+ sensor protein CaM. These structures are also found in CaV2 channels (5) and CaV1/2 channels from S. rosetta (Fig. S1) and the sponge species Amphimedon queenslandica, Haliclona tubifera, and Haliclona ambioensis (not shown) (103, 104). Indeed, the IQ domain is fairly ubiquitous among eukaryotic four-domain channels, with few exceptions (e.g., CaV3 and sodium leak channels) (1), suggesting that CaM regulation and/or signaling is an ancient invention of broad physiological significance. Early diverging CaV1 channels from nonbilaterians, including TCaV1, lack an NSCaTE motif (Fig. S1), a noted secondary binding locus for CaM shared among vertebrate and bilaterian invertebrate CaV1 channels (15). TCaV1 also lacks a key a cysteine residue in the reported NATE motif (13), just downstream of NSCaTE, that independently mediates interactions with CaM (Fig. 10B) (14). On the other hand, the cnidarian homologues possess a NATE-like motif and so do placozoan CaV2 channels despite some divergence a few amino acids positions upstream (Fig. 10B). Whether CaM binds to the NATE region in invertebrate channels has not been determined, so the significance of this apparent conservation is unclear.
TCaV1 sheds light on the distinguishing biophysical features of CaV1 to CaV3 channels
Altogether, the functional properties of the TCaV1 to TCaV3 channels point to an early establishment of several unique biophysical features that distinguish these three calcium channel types from each other, the most obvious being activation voltages where TCaV3 classifies as an low-voltage–activated channel (24) and TCaV1 and TCaV2 as HVA channels (Fig. S4, A and B) (5). Within the literature, reported biophysical parameters of vertebrate CaV channels come from a multitude of studies, each employing different recording solutions and conditions, channels cloned from different tissues and subject to alternative splicing, and co-expressed with different CaVβ and CaVα2δ subunits (vertebrates possess four of each (105)), all of which can significantly impact biophysical properties. Hence, a broad phylogenetic comparison of reported parameters cannot be done with confidence. However, because our characterization of TCaV1 and TCaV2 was done alongside rat CaV1.2 and human CaV2.1 channels, using the same subunits and recording conditions, we can compare these channels to each other with more confidence. Table 1 is a summary of the biophysical properties of the four channels, revealing that comparisons between TCaV1 versus TCaV2 and rCaV1.2 versushCaV2.1 are similar for most parameters, except for steady-state inactivation and deactivation. Thus, when considering only these four homologues, it appears as though some core biophysical distinctions between the mammalian CaV1 and CaV2 channels hold true for the Trichoplax homologues, although they are by no means striking.
In general, the most striking functional divergence of the three Trichoplax CaV channels pertains to their voltage sensitivity, where all three exhibit hyperpolarized voltages for activation and inactivation compared to their mammalian orthologues (5, 24). Thus, it is important to consider putative structural features that might account for these differences. For mammalian CaV1.1 to CaV1.4 channels, several disease-causing point mutations have been identified that cause left-shifted voltage properties (reviewed in (106)); however, TCaV1 does not possess any sequence differences at these positions (Fig. S1). TCaV1 also bears a conserved signature of two glutamate and one aspartate residues within the AID structure, which when mutated in CaV1.2 causes hyperpolarized gating properties (107) (Fig. S1). Notably, TCaV1 lacks an optional exon equivalent to conserved exons 29, 33, and 32 in CaV1.1 to CaV1.3 channels, respectively, that encode small inserts in the DIV extracellular S3–S4 loop (Figs. S1 and S6). For all three of these mammalian channels, exclusion of this optional exon imposes left-shifted voltage sensitivity (108, 109, 110), for example, hyperpolarizing the activation and inactivation of CaV1.2 by more than 10 mV. Because the TCaV1 channel resembles the Δ exon 33 variant of rCaV1.2, the noted differences in gating could perhaps be in part attributable to this particular structural difference, given that the rCaV1.2 channel used in our electrophysiology experiments possessed exon 33.
Clearly, an important next step will be to explore how the single Trichoplax CaVβ and two CaVα2δ subunits impact the functional properties of the Trichoplax CaV channels and furthermore, to determine whether the CACHD1 and α2δ-like proteins also play a role in regulating the α1 subunits (Fig. 2). Indeed, ancillary subunits can impose striking deviations from canonical ion conducing properties, in lieu of structural or functional alterations to the α1 subunit. For example, in vitro expression of the CaV2a channel from the sea anemone N. vectensis with its native CaVβ subunit produces highly atypical macroscopic currents with extremely left-shifted steady-state inactivation properties, such that the channel population is completely inactivated at a typical resting membrane potential of −60 mV (111). Because the Nematostella CaVβ subunit exerts the same effect on human CaV2.1, the observed adaptation must have occurred via structural changes in the ancillary subunit. Similarly, the CaVβB subunit from the parasitic flatworm Schistosoma mansoni imposes a hyperpolarizing shift in the steady-state inactivation of the human CaV2.3 channel (112), coupled with significant rundown of macroscopic current amplitude (113). Given these and other similar observations, the biophysical properties of the TCaV1 channel reported here should be interpreted with caution, until the effects of cognate ancillary subunits are determined.
Here, as we did previously for TCaV2 (5), we have shown that TCaV1 channel protein expression is significantly increased upon co-expression with the rat CaVβ1b and CaVα2δ1 subunits in vitro (Fig. 3, B–D), like vertebrate and bilaterian invertebrate HVA channels (50, 51, 53). Given our inability to record TCaV1 currents in vitro without the co-expressed CaVβ1b subunit and the ability to do so when CaVα2δ1 was excluded, it appears as though the CaVα2δ subunit plays a small role in membrane trafficking of the Trichoplax channel. This is in contrast to vertebrate CaV channels, where CaVα2δ significantly enhances membrane expression (53). Perhaps, this could be due to a structural divergence between the rat and Trichoplax proteins, such that the rat CaVα2δ1 subunit has a low affinity for the TCaV1 channel. In accordance, we found that in some cells, the TCaV1 currents were considerably right shifted in their voltage properties, resembling those conditions when the rat CaVα2δ1was excluded from the transfections (Fig. 5, E and F). Although less common, the occurrence of these events might suggest that the affinity between the channel and the subunit is weak, such that cells co-expressing low levels of CaVα2δ1 would be enriched with membrane channels lacking this subunit. Nevertheless, comparing TCaV1 channel currents with and without rat CaVα2δ1 revealed that the subunit caused a hyperpolarizing shift in voltage properties and increased sensitivity to voltage changes, as is observed for vertebrate CaVchannels (53). Clearly, a more complete picture about the comparative properties of the Trichoplax CaV channels will emerge once the biophysical properties of the different endogenous CaV channel complexes are known.
On the divergent modulation of CaV1 and CaV2 channels by CaM
One key distinguishing feature of bilaterian CaV1 and CaV2 channels is their differential regulation by CaM, where only CaV1 channels exhibit fast, buffer-resistant CDI that becomes apparent when the permeating ion is switched from Ca2+ to Ba2+. Here, we sought to explore whether the TCaV1 and TCaV2 channels are subject to CaM regulation and whether they exhibit the same functional distinction. Indeed, both channels were found to exhibit CDI, evident in the slowing of current inactivation when the intracellular recording solution was switched from one containing 0.5 mM EGTA, a permissive condition that does not disrupt CaM Ca2+ binding, to 10 mM BAPTA, a strong buffering condition that selectively disrupts Ca2+ binding at the N-lobe, but not the C-lobe of CaM (Fig. 10C). A direct role for CaM was established by co-expression of a mutant CaM lacking the ability to bind Ca2+, which completely abrogated the CDI process for the TrichoplaxCaV1 and CaV2 channels, as well as the rCaV1.2 channel (Fig. 11). Thus, CaM regulation of HVA CaV channels is likely an ancestral feature, inherited from the parental CaV1/2 channel that gave rise to these two channel types and consistent with the noted ubiquity of IQ domain structures among eukaryotic four-domain channels, including the more distantly related NaVchannels which are subject to CaM regulation and CDI (114).
Interestingly, switching the permeating cation from Ca2+ to Ba2+cased a dramatic reduction in TCaV1 inactivation, with no effect on TCaV2 (Fig. 10C), consistent with exclusive buffer-resistant CDI for the placozoan L-type channel. Given the noted absence of NSCaTE and NATE motifs in the TCaV1 N terminus (Figs. 10B and S1), the most likely explanation is that this unique component of the CDI process is mediated by the C-lobe of CaM. In the presence of Ba2+, the TCaV1 channel inactivation is dramatically slowed, suggesting that at least for a voltage step to 0 mV, CDI accounts for a large portion of channel inactivation, with a diminished contribution from VDI compared to TCaV2. Thus, TCaV1 distinguishes itself from TCaV2 in being less susceptible to VDI, rendering the channel population more sensitive to Ca2+ levels in the cytoplasm, rather than alterations in membrane voltage. Perhaps, this key distinction between CaV1 and CaV2 channels, conserved in placozoans, played a central role in their differential adaptation for different Ca2+signaling roles in the evolving neuromuscular system. Going forward, future studies on CaV1/2 channels from choanoflagellates and sponges might reveal whether the unique regulation of CaV1 channels by CaM preceded the emergence of CaV1 and CaV2 channels and was subsequently lost in CaV2 channels, or rather, is a unique adaptation of CaV1 channels.
Physiological functions of CaV channels in the placozoa
In vertebrates, the different CaV channel types exhibit notable differences in their tissue/cell-type expression patterns. Generally, CaV2 channels are restricted to neurons and neuroendocrine cells, while CaV1 and CaV3 channels are expressed more broadly, also found in smooth and cardiac muscle (CaV1 and CaV3) and skeletal muscle (CaV1) (2, 105, 115). In Lymnaea, similar patterns are apparent where CaV2 channel expression is restricted to the nervous system and neuroendocrine glands, while CaV1 and CaV3 channels are additionally expressed in the heart, as well as muscular structures of the mouth and foot (7, 116). Thus, another feature of bilaterian CaV channel orthologues that appears to be deeply conserved is their differential tissue/cell-type expression. Using a custom antibody, we show here that the TCaV1 channel is expressed in dorsal epithelial cells within the interior of the animal (i.e., the lipophil zone) (Fig. 4). Although Trichoplax lacks true muscle (18), their dorsal epithelium is made up of fast-contracting cells that require cytoplasmic Ca2+ influx for contraction, akin to myocytes (57). Accordingly, placozoans possess most genes necessary for driving Ca2+-dependent actin–myosin contractions in other animals (117). Given the uncovered expression of TCaV1 in these cells, it may be that the channel contributes to excitation–contraction coupling, similar to its bilaterian counterparts. Similarly, we show here that, similar to vertebrates and the snail, all three CaV channels are co-expressed in neuroendocrine-like type II gland cells (Fig. 4), which express the molecular machinery required for regulated exocytosis (e.g., SNAP-25, synapsin, and complexin) (18, 56) and a small endomorphin-like peptide that is secreted by these cells to control ciliary locomotion (56, 118). Additionally, gland cells are teardrop/hourglass shaped (56), oriented longitudinally toward the outside edge of the animal, perhaps indicative of cellular polarity with a region specialized for vesicle exocytosis. This is certainly suggested by the immunolocalization of TCaV2 channel along the outward facing edge of these cells (5). We also previously documented weak expression of TCaV2 in fiber cells, which are situated between the dorsal and ventral epithelium of the animals, although this was not observed in all preparations. Here, using fluorescent probes, we also detected the TCaV2 mRNA in fiber cells (5), and not TCaV1 (Fig. 4, L and M). However, this labeling was weak and infrequent, and altogether, it is difficult to state with certainty that TCaV2 is significantly expressed in fiber cells. Recently, fiber cells were shown to mediate innate immunity and wound healing and to express gene markers homologous to macrophage cells (60). Lastly, immunofluorescence and in situ hybridization experiments indicate that TCaV1 is expressed in both dorsal and ventral epithelial cells (Fig. 4, E, F and I–K); however, antibody staining suggests the protein is more abundant in the dorsal epithelium. We note that the antibody labeling was completely blocked after preadsorption with the corresponding protein epitope (Fig. 4D), which was consistent with our Western blotting experiments (Fig. 3F), indicative of specific labeling of the TCaV1 protein. In summary, although the expression patterns of the Trichoplax CaV channels are suggestive of cellular transcriptional homology, more work needs to be done to better understand the evolutionary relationship of Trichoplaxcells to those of other animals and on the transcriptional programs that controls the expression of the Trichoplaxchannels in different cell types.
A key question of course is how membrane excitation and electrical signaling serves to recruit Trichoplax CaV channel activity and in turn influence their contributions to cellular physiology. Placozoans have recently been demonstrated to fire rapid, Na+-based APs lasting 1 to 3 ms at a frequency of ∼130 Hz (21). These recordings were performed using extracellular electrodes on immobilized whole animals and isolated gravity-sensing crystal cells (21), indicating that there is at least one type of excitable cell in the animal. These findings suggest that Trichoplax CaV channels may experience, and open in response to, high-frequency APs. Mammalian CaV1 and CaV2 channels differ in their response to high-frequency depolarizations (119). In vitro recordings applying voltage waveforms that resembled hippocampal neuron APs showed that CaV2.1 channels caused less cumulative Ca2+ entry into the cell and greater current decay over time compared to CaV1.2 channels (120). Thus, in mammals, there is a clear difference in response of CaV1 and CaV2 channels to the same repetitive AP stimulus. Here, we wanted to determine if the TCaV1 and TCaV2 channels also differ in this respect. Applying short, repetitive depolarizations to both channels revealed surprisingly little difference (Fig. 8). Both the cumulative Ca2+ entering the cell and the activity-dependent decay in peak current after 1 s of 100 Hz stimulation were similar between TCaV1 and TCaV2. Therefore, the differences in biophysical properties and kinetics seen between TCaV1 and TCaV2 channels with prolonged depolarizations (>100 ms) did not translate to differences in Ca2+ influx with short, repetitive depolarizations. Even though placozoan APs were reported to fire at a frequency of ∼130 Hz, it is possible for APs to be modulated to become slower or faster (121). Therefore, we next examined the combined effects of different depolarization lengths and frequencies on the TCaV1 and TCaV2 channels. With increased depolarization frequency, both channels exhibited a decay in current amplitude, but there was very little difference between TCaV1 and TCaV2. The only difference in current decay that could be observed was at 100 Hz with 3 ms-long pulses. Perhaps, more striking differences would emerge in experiments using varying baseline holding voltages. Indeed, the left-shifted inactivation curve of TCaV1 relative to TCaV2 (Fig. S4B) suggests that this channel contributes minimally to excitation-induced Ca2+ influx when the resting voltage is more positive than −50 mV. In this respect, the population of available TCaV1 channels in a cell could be dynamically regulated by altering resting membrane voltage. For example, if co-expressed with TCaV2, the TCaV1 channel population could be utilized as a reserve pool that only becomes available after a bout of membrane hyperpolarization, in a process akin to postinhibitory rebound excitation. Future studies examining the excitability of cell types expressing TCaV1 and TCaV2 channels would help identify the voltage changes that these channels are experiencing.
Conclusions
Duplication of an ancestral CaV1/2 channel into separate CaV1 and CaV2 channels allowed them to acquire variations in sequence and diverge in their biophysical properties and protein interactions. Differences in biophysical properties may have made these channels better suited for activating certain Ca2+signaling pathways, whereas the expansion of CaV channel protein interactions may have facilitated the distinct modulation and subcellular localization of CaV1 and CaV2 channels. Collectively, these changes likely resulted in CaV channels taking on conserved yet distinct roles across many extant animal phyla. Trichoplax CaV1 and CaV2 channels may represent a more ancestral form of these channels seeing as they have some, but not all, of the features present in CaVchannels of more derived animals. Differences in their cellular expression, biophysical properties, and modulation suggests that they play different roles in the animal. However, whether they have distinct excitation-secretion or excitation-transcription/excitation-contraction coupling capabilities as seen in other animals will need to be investigated further. Future work on the functions of these channels in vivo (e.g., through knockdown and behavioral assays) could help reveal the roles of TCaV1 and TCaV2 channels in Trichoplax cells.