
Brain-derived tau: a novel blood-based biomarker for Alzheimer’s disease-type neurodegeneration
By Fernando Gonzalez-Ortiz, Michael Turton, Przemysław R Kac, Denis Smirnov, Enrico Premi, Roberta Ghidoni, Luisa Benussi, Valentina Cantoni, Claudia Saraceno, Jasmine Rivolta, Nicholas J Ashton, Barbara Borroni, Douglas Galasko, Peter Harrison, Henrik Zetterberg, Kaj Blennow, and Thomas K Karikari
Excerpt from the article published in Brain, 27 December 2022; awac407, DOI: https://doi.org/10.1093/brain/awac407
Editor’s Highlights
- A blood-based t-tau biomarker, plasma BD-tau, was shown to be an Alzheimer’s disease-type neurodegeneration biomarker that can discriminate between autopsy-verified Alzheimer’s disease from other neurodegenerative diseases, and in addition is associated with clinical severity of disease in the Neuropathology cohort.
- Combining plasma BD-tau with p-tau and possibly Aβ42/Aβ40 will increase the accuracy of a blood biomarker-based diagnosis of Alzheimer’s disease by increasing its agreement with results obtained at autopsy or by using CSF or neuroimaging biomarkers.
Abstract
Blood-based biomarkers for amyloid beta and phosphorylated tau show good diagnostic accuracies and agreements with their corresponding CSF and neuroimaging biomarkers in the amyloid/tau/neurodegeneration [A/T/(N)] framework for Alzheimer’s disease. However, the blood-based neurodegeneration marker neurofilament light is not specific to Alzheimer’s disease while total-tau shows lack of correlation with CSF total-tau. Recent studies suggest that blood total-tau originates principally from peripheral, non-brain sources.
We sought to address this challenge by generating an anti-tau antibody that selectively binds brain-derived tau and avoids the peripherally expressed ‘big tau’ isoform. We applied this antibody to develop an ultrasensitive blood-based assay for brain-derived tau, and validated it in five independent cohorts (n = 609) including a blood-to-autopsy cohort, CSF biomarker-classified cohorts and memory clinic cohorts.
In paired samples, serum and CSF brain-derived tau were significantly correlated (rho = 0.85, P < 0.0001), while serum and CSF total-tau were not (rho = 0.23, P = 0.3364). Blood-based brain-derived tau showed equivalent diagnostic performance as CSF total-tau and CSF brain-derived tau to separate biomarker-positive Alzheimer’s disease participants from biomarker-negative controls. Furthermore, plasma brain-derived tau accurately distinguished autopsy-confirmed Alzheimer’s disease from other neurodegenerative diseases (area under the curve = 86.4%) while neurofilament light did not (area under the curve = 54.3%). These performances were independent of the presence of concomitant pathologies. Plasma brain-derived tau (rho = 0.52–0.67, P = 0.003), but not neurofilament light (rho = −0.14–0.17, P = 0.501), was associated with global and regional amyloid plaque and neurofibrillary tangle counts. These results were further verified in two memory clinic cohorts where serum brain-derived tau differentiated Alzheimer’s disease from a range of other neurodegenerative disorders, including frontotemporal lobar degeneration and atypical parkinsonian disorders (area under the curve up to 99.6%). Notably, plasma/serum brain-derived tau correlated with neurofilament light only in Alzheimer’s disease but not in the other neurodegenerative diseases. Across cohorts, plasma/serum brain-derived tau was associated with CSF and plasma AT(N) biomarkers and cognitive function.
Brain-derived tau is a new blood-based biomarker that outperforms plasma total-tau and, unlike neurofilament light, shows specificity to Alzheimer’s disease-type neurodegeneration. Thus, brain-derived tau demonstrates potential to complete the AT(N) scheme in blood, and will be useful to evaluate Alzheimer’s disease-dependent neurodegenerative processes for clinical and research purposes.
Introduction
The AT(N) (amyloid, tau, neurodegeneration) research framework provides a unified scheme that emphasizes on pathophysiological evidence of amyloid beta (A), tau (T) and neurodegeneration (N) for the definition and staging of Alzheimer’s disease.1–3However, the framework currently relies on established CSF and neuroimaging biomarkers that have major challenges from economical, practical and logistical perspectives that limit their widespread applications, particularly in contexts that require cost-effective and high-throughput assessments for biological evidence of Alzheimer’s disease. For example, given the paucity of dementia specialists in many hospital systems,4 biomarker screening at the primary care level would be beneficial to streamline patient management including referrals to specialist practitioners.5–8Moreover, as therapeutic trials are now required to show biomarker evidence of candidate drug efficacy,9 it is essential that only participants with confirmed underlying pathology are included and further monitored in the course of trials.6 The Alzheimer’s disease field will therefore benefit from biomarker modalities that have improved simplicity, accessibility, convenience and cost-effectiveness without compromising on performance.5–8
The development of AT(N) blood biomarkers improves the needed scalability for large-scale diagnostic, prognostic and therapeutic trial applications. Plasma amyloid beta (Aβ)42/Aβ40 methods, measured using immunoprecipitation-mass spectrometry methods, have shown good accuracies to detect Aβ abnormalities in Alzheimer’s disease that are absent in neurodegenerative diseases without amyloidosis.10–13 Plasma p-tau, including those targeting p-tau181, p-tau217 and p-tau231, have also demonstrated excellent diagnostic performances to detect and to differentiate Alzheimer’s disease from other neurodegenerative diseases.14–19 Plasma Aβ and p-tau therefore show promise as the A and T biomarkers, respectively, in the AT(N) framework.6,8,20 For neurodegeneration (N), however, plasma neurofilament light chain (NfL) has demonstrated excellent diagnostic performance to identify Alzheimer’s disease compared with controls, but is unable to distinguish it from other neurodegenerative diseases.21–24 For these reasons, plasma NfL may not be optimal for use as an Alzheimer’s disease-specific neurodegeneration marker. Moreover, current plasma total-tau (t-tau) assays do not show good diagnostic utility,24–29 contrary to CSF t-tau that reliably reflects neurodegeneration in Alzheimer’s disease but not in other neurodegenerative diseases like Parkinson’s disease, Lewy body dementia and frontotemporal dementia.30–34 Plasma t-tau concentrations show large overlaps between diagnostic groups and do not correlate with CSF t-tau, suggesting that plasma and CSF t-tau do not originate from the same tissue sources.25,27,29 Indeed, while tau is known to be highly abundant in the CNS, the protein is also present in peripheral tissues (e.g. liver, kidney, heart).35,36 The protein structure of tau in the CNS and PNS has fundamental differences in splice variants: while there are six tau isoforms of varying lengths in the adult human brain, the main form of tau in the PNS is distinguishable from these isoforms by the presence of a large peptide insert resulting from the transcription of an extra exon (exon 4a) of the MAPT gene.37,38 Since CSF t-tau, but not plasma t-tau, agrees with PET and neuropathological evidence of Alzheimer’s disease,30,32–34 it is plausible that the tau forms measured by the blood assay originate, to a large extent, from non-CNS sources. In line with this reasoning, a recent study estimated that only a fifth of the signal measured by plasma t-tau is brain-derived while the remainder originates from peripheral sources.25 As a result, plasma t-tau tends to show promising diagnostic function largely in disorders with acute increases in CNS tau production and release, including traumatic brain injury and acute stroke following cardiac arrest.39–44 Together, a blood-based biomarker for neurodegeneration specific to Alzheimer’s disease is currently lacking. Discovery of such a biomarker would complete the AT(N) system in blood, and enable examination of neurodegenerative process(es) specific to Alzheimer’s disease pathogenesis while differentiating these from neurodegenerative mechanisms common to related dementias.
In this study, we hypothesized that: (i) an immunoassay can be innovated to selectively measure brain-derived tau (BD-tau) in blood by using an antibody engineered to specifically target tau isoforms originating from the brain; (ii) such a novel assay would show strong correlations between plasma and CSF levels; and (iii) the assay would demonstrate specificity to Alzheimer’s disease by showing good performances to differentiate it from non-Alzheimer’s disease neurodegenerative diseases. Here, we report the development, analytical and clinical validation of a novel blood-based biomarker that is specific for BD-tau. In five independent research cohorts (n = 609 participants), we evaluated the capabilities of this new blood biomarker to: (i) differentiate neurochemically defined Alzheimer’s disease from biomarker-negative controls; (ii) distinguish Alzheimer’s disease from other neurodegenerative diseases, including in a cohort with neuropathological confirmation; and (iii) to associate with the severity of plaque and tangle pathologies at autopsy, CSF AT(N) biomarkers (including in paired plasma/serum versus CSF samples), and cognition.
…
Results
TauJ.5H3 antibody specifically recognizes BD-tau
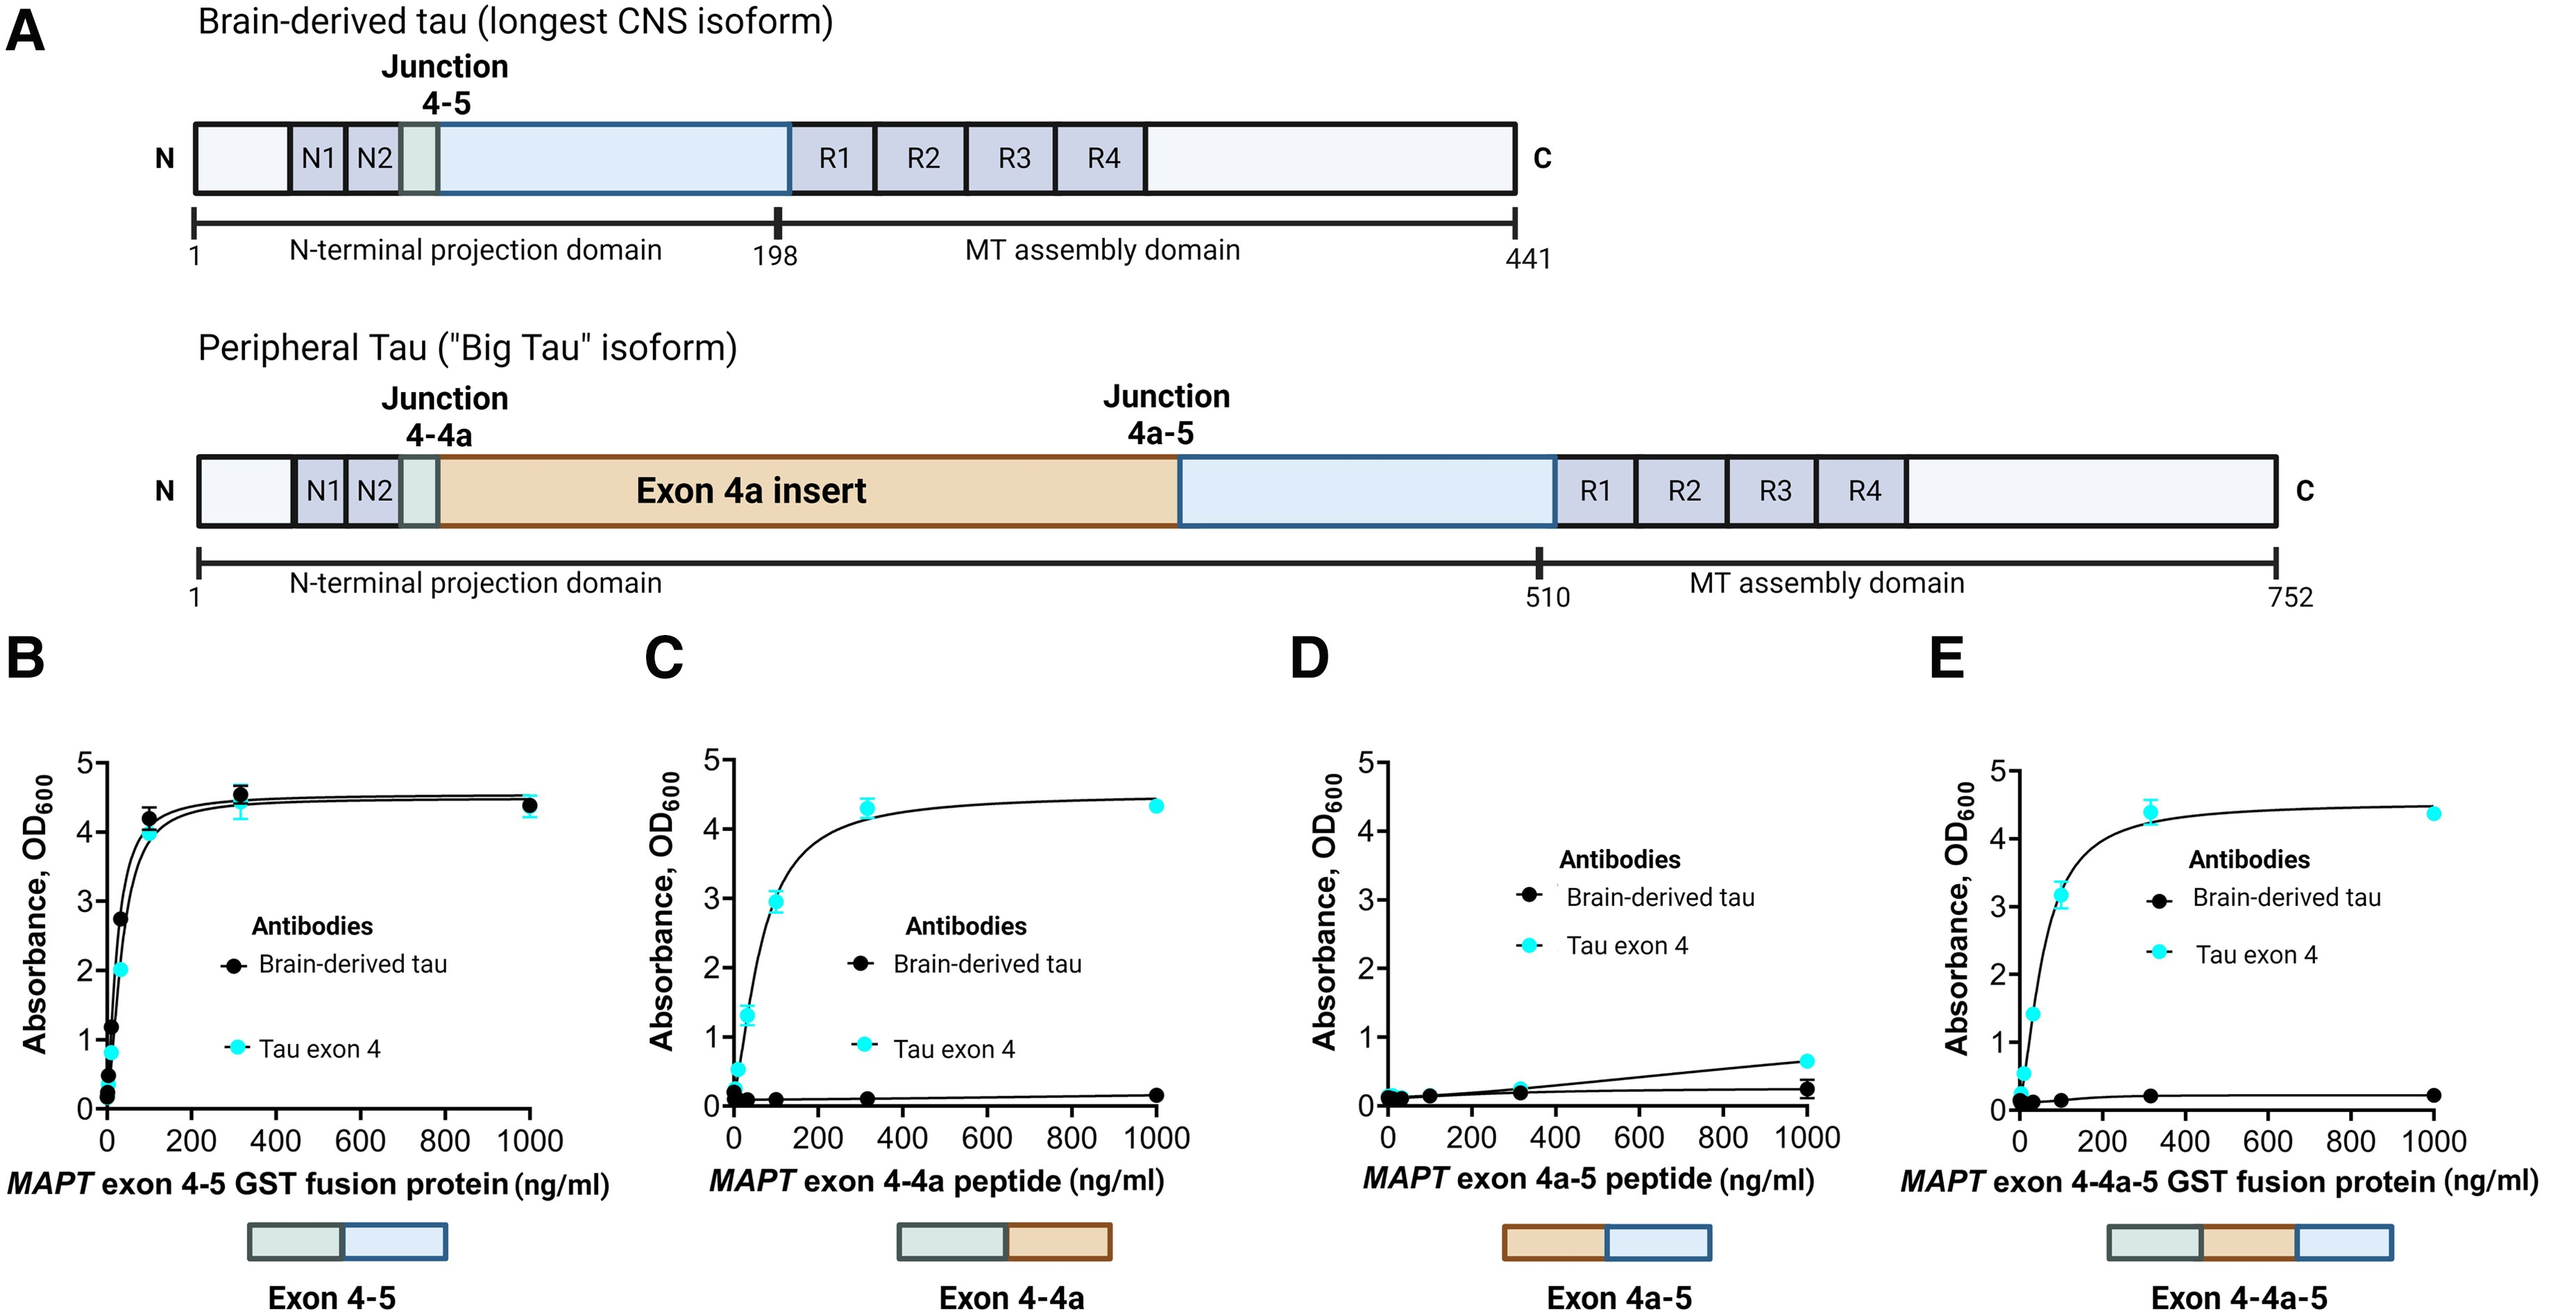
The TauJ.5H3 antibody was designed to selectively bind to continuous exon 4–5 sequences on CNS-derived tau isoforms (Fig. 1A). As expected, the antibody did exclusively bind to recombinant protein constructs representing the exon 4–5 in a concentration-dependent manner. An identical binding pattern was observed for a control antibody selected by affinity purification of polyclonal serum against the exon 4 peptide (Fig. 1B). However, the TauJ.5H3 antibody did not recognize recombinant protein constructs containing the exon 4a insert; this includes constructs for the exons 4–4a (Fig. 1C), 4a–5 (Fig. 1D) and 4–4a–5 regions (Fig. 1E), confirming binding was only observed when the contiguous exon 4–5 sequence was present. The tau exon-4 antibody recognized recombinant constructs that included the exon 4 region (that is, exons 4–4a and 4–4a–5) while both the TauJ.5H3 and the tau exon-4 antibodies did not bind to a protein construct spanning the exon 4a–5 region (Fig. 1D). Additionally, TauJ.5H3 recognized all six tau isoforms abundantly expressed in the adult human CNS (Supplementary Fig. 1). Together, these results indicate that the TauJ.5H3 antibody recognizes tau isoforms that are derived from the CNS but avoids tau forms that include the exon 4a region predominantly expressed in peripheral tissues.
Design and characterization of the TauJ.5H3 sheep monoclonal antibody specific for CNS-derived tau isoforms.
(A, top) Schematic illustration of the full-length tau isoform (2N4R) in the adult human brain showing the different regions including the junction between exons 4 and 5, indicating the absence of the exon 4a insert. Note that the organization of the exons 4 and 5 here also applies to the other five major tau isoforms commonly expressed in the adult human CNS. (A, bottom) Schematic illustration of the high molecular weight tau (‘big tau’) isoform, which is the predominant form of tau in the adult human PNS. The exon 4a insert breaks the junction between exons 4 and 5 in the 2N4R isoform into two separate junctions—between exons 4 and 4a and between 4a and 5. The TauJ.5H3 BD-tau antibody was generated against a small contiguous peptide that specifically stretches the junction between exons 4 and 5, making it unique to CNS tau isoforms. The control anti-exon-4 antibody was generated against a recombinant protein form of the exon 4 that is common to all tau isoforms. (B) The TauJ.5H3 antibody did bind in a concentration-dependent manner to a recombinant protein construct corresponding to the exon 4–5 region found in the 2N4R and other CNS tau isoforms but not in the high molecular weight tau isoform abundantly expressed in peripheral tissue. The binding profile was the same as that of a control antibody generated against the exon-4 region. (C) The TauJ.5H3 antibody did not bind to a recombinant protein construct that covers the exons 4–4a region found in the high molecular weight, but not the 2N4R, tau isoform. However, the anti-exon-4 antibody did bind in a concentration-dependent manner as it did against the exon 4–5 region in B above. (D) Both the TauJ.5H3 and anti-exon-4 antibodies did not recognize a recombinant protein construct for the exon 4a–5 region that is found in the high molecular weight tau but not CNS isoforms. (E) TauJ.5H3, but not the anti-exon-4 antibody, gave no signal in the presence of a recombinant fusion construct corresponding to the continuous exon 4–4a–5 region.
BD-tau assay shows good analytical performance in plasma and serum
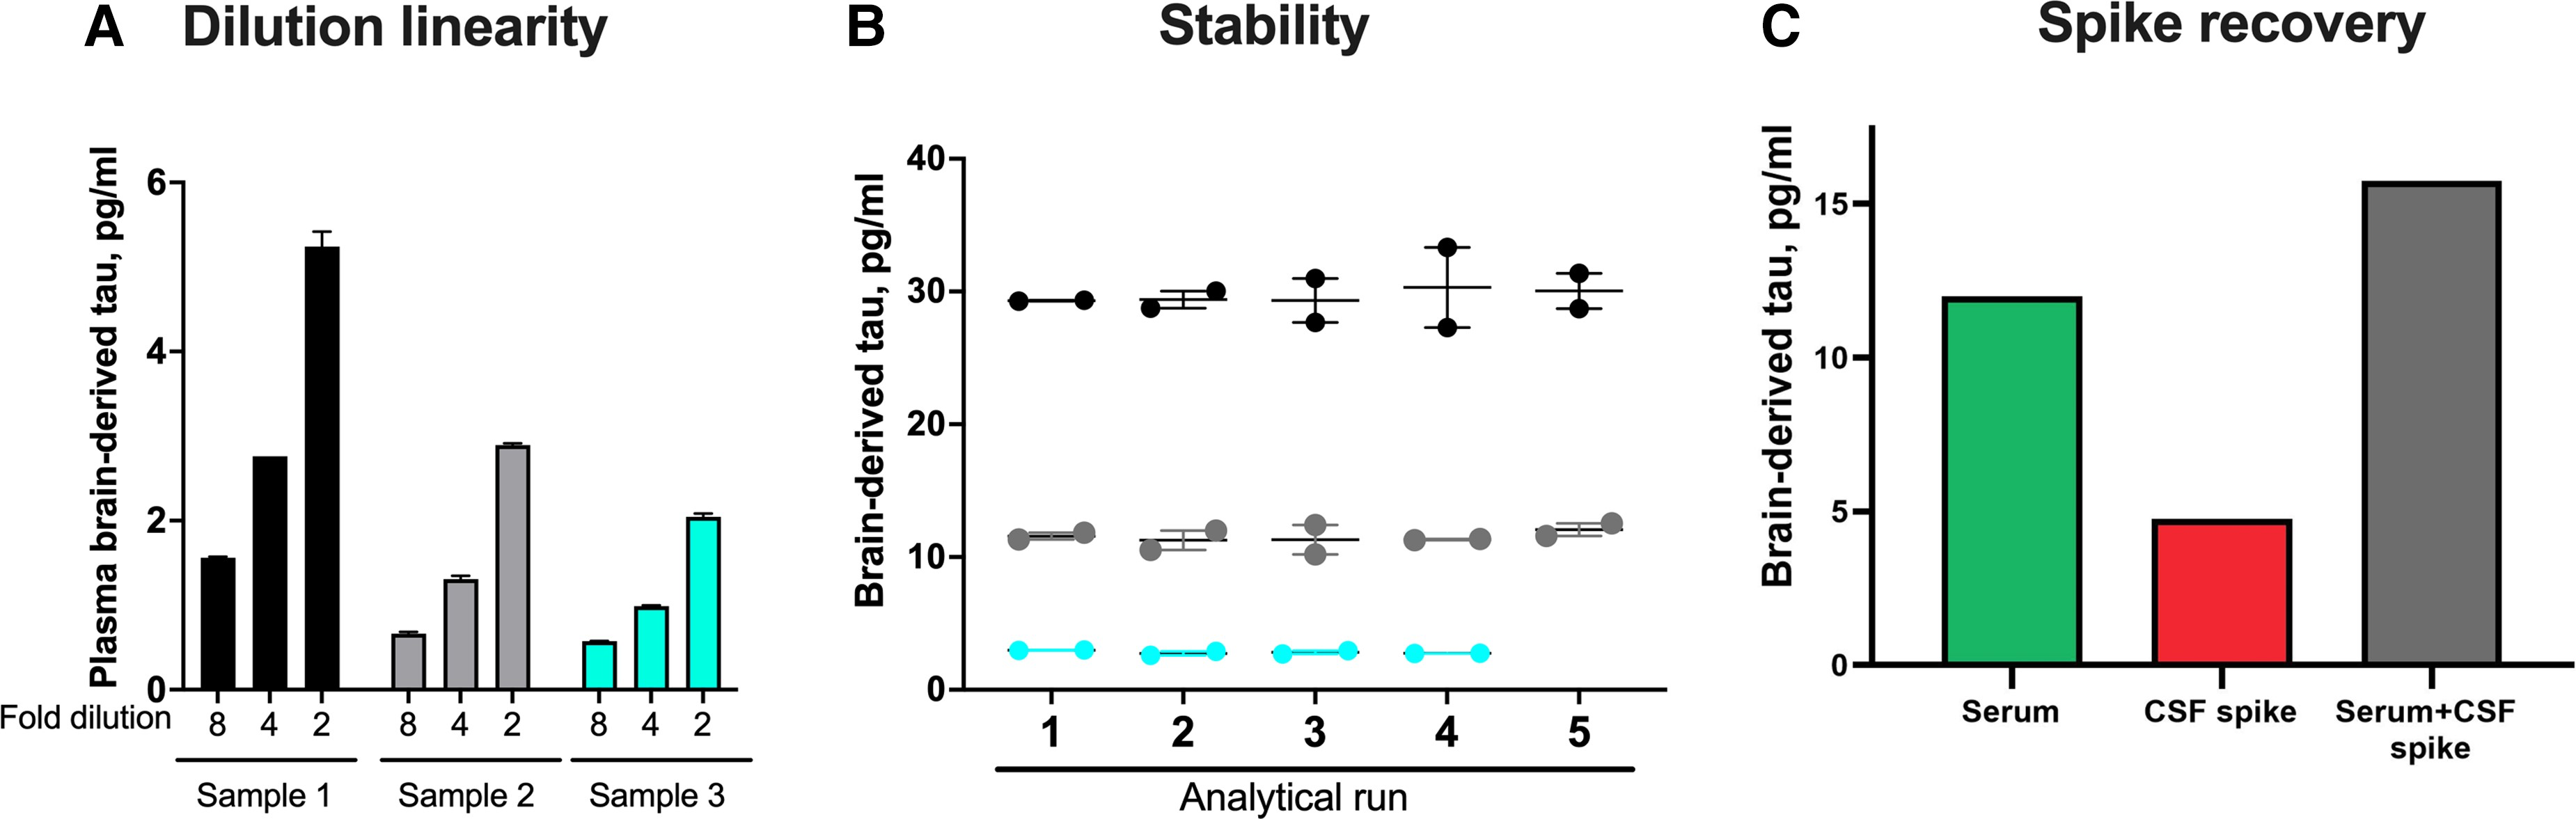
We next developed a novel immunoassay to measure BD-tau in blood, by pairing the TauJ.5H3 antibody with an N-terminal-tau targeting antibody. Following optimization, the assay showed excellent analytical performance in both plasma and serum. Concentrations of the biomarker in endogenous blood samples decreased linearly when measured 2-fold diluted with the assay diluent versus when diluted 4- or 8-fold (Fig. 2A). The assay also showed between-run stability of 92–95% when aliquots of three independent plasma or serum samples were measured in up to five separate analytical runs (Fig. 2B). Moreover, there was a recovery of 93% of the expected analyte signal in exogenous CSF samples when spiked into test blood samples (Fig. 2C). These values were within recommended/acceptable limits as stipulated by an international consortium of clinical chemists57 and were also comparable to those we have reported previously for p-tau assays.14,19,46 The lower limit of quantification for the assay was estimated to be 0.03 pg/ml.
Technical validation of a novel assay to measure BD-tau in blood.
(A) Dilution linearity. The panel shows serial dilutions of three unique plasma samples with the assay diluent. Compared with sample aliquots diluted 2-fold, those diluted 4-fold gave ∼50% less signal for BD-tau. The trend was the same when comparing 4- and 8-fold diluted samples. The bar plots show the mean values and the error bars show the standard error of the mean. (B) Within- and between-run stability. The concentrations for three separate plasma or serum samples were measured in duplicates in up to five independent analytical runs are shown, to depict day-to-day stability of the BD-tau assay. (C) Spike recovery. Serum samples diluted 1:2 as well as the assay diluent were each ‘spiked’ with CSF and levels in each sample were measured with our assay. The plot shows signals for the non-spiked serum sample, the CSF spike sample alone and the serum + CSF spike sample together.
Correlation between BD-tau levels in paired CSF and blood samples suggests lack of interference from peripheral tau
We hypothesized that if BD-tau is not significantly affected by peripheral tau contamination, concentrations in paired CSF and blood samples should show good correlation and similar diagnostic performances. In the Discovery cohort, there was a strong correlation (Spearman’s rho = 0.85, P < 0.0001; Supplementary Table 3) of BD-tau levels in paired serum and CSF. To the contrary, concentrations of the Quanterix t-tau assay (the performance of which is known to be impacted by tau from peripheral tissues25) did not correlate in the same serum versus CSF sample pairs (Spearman’s rho = 0.23, P = 0.3364; Supplementary Table 3). CSF BD-tau correlated strongly with CSF t-tau measured with either the INNOTEST (Spearman’s rho = 0.93, P < 0.0001) or Quanterix (Spearman’s rho = 0.85, P < 0.0001) assays.
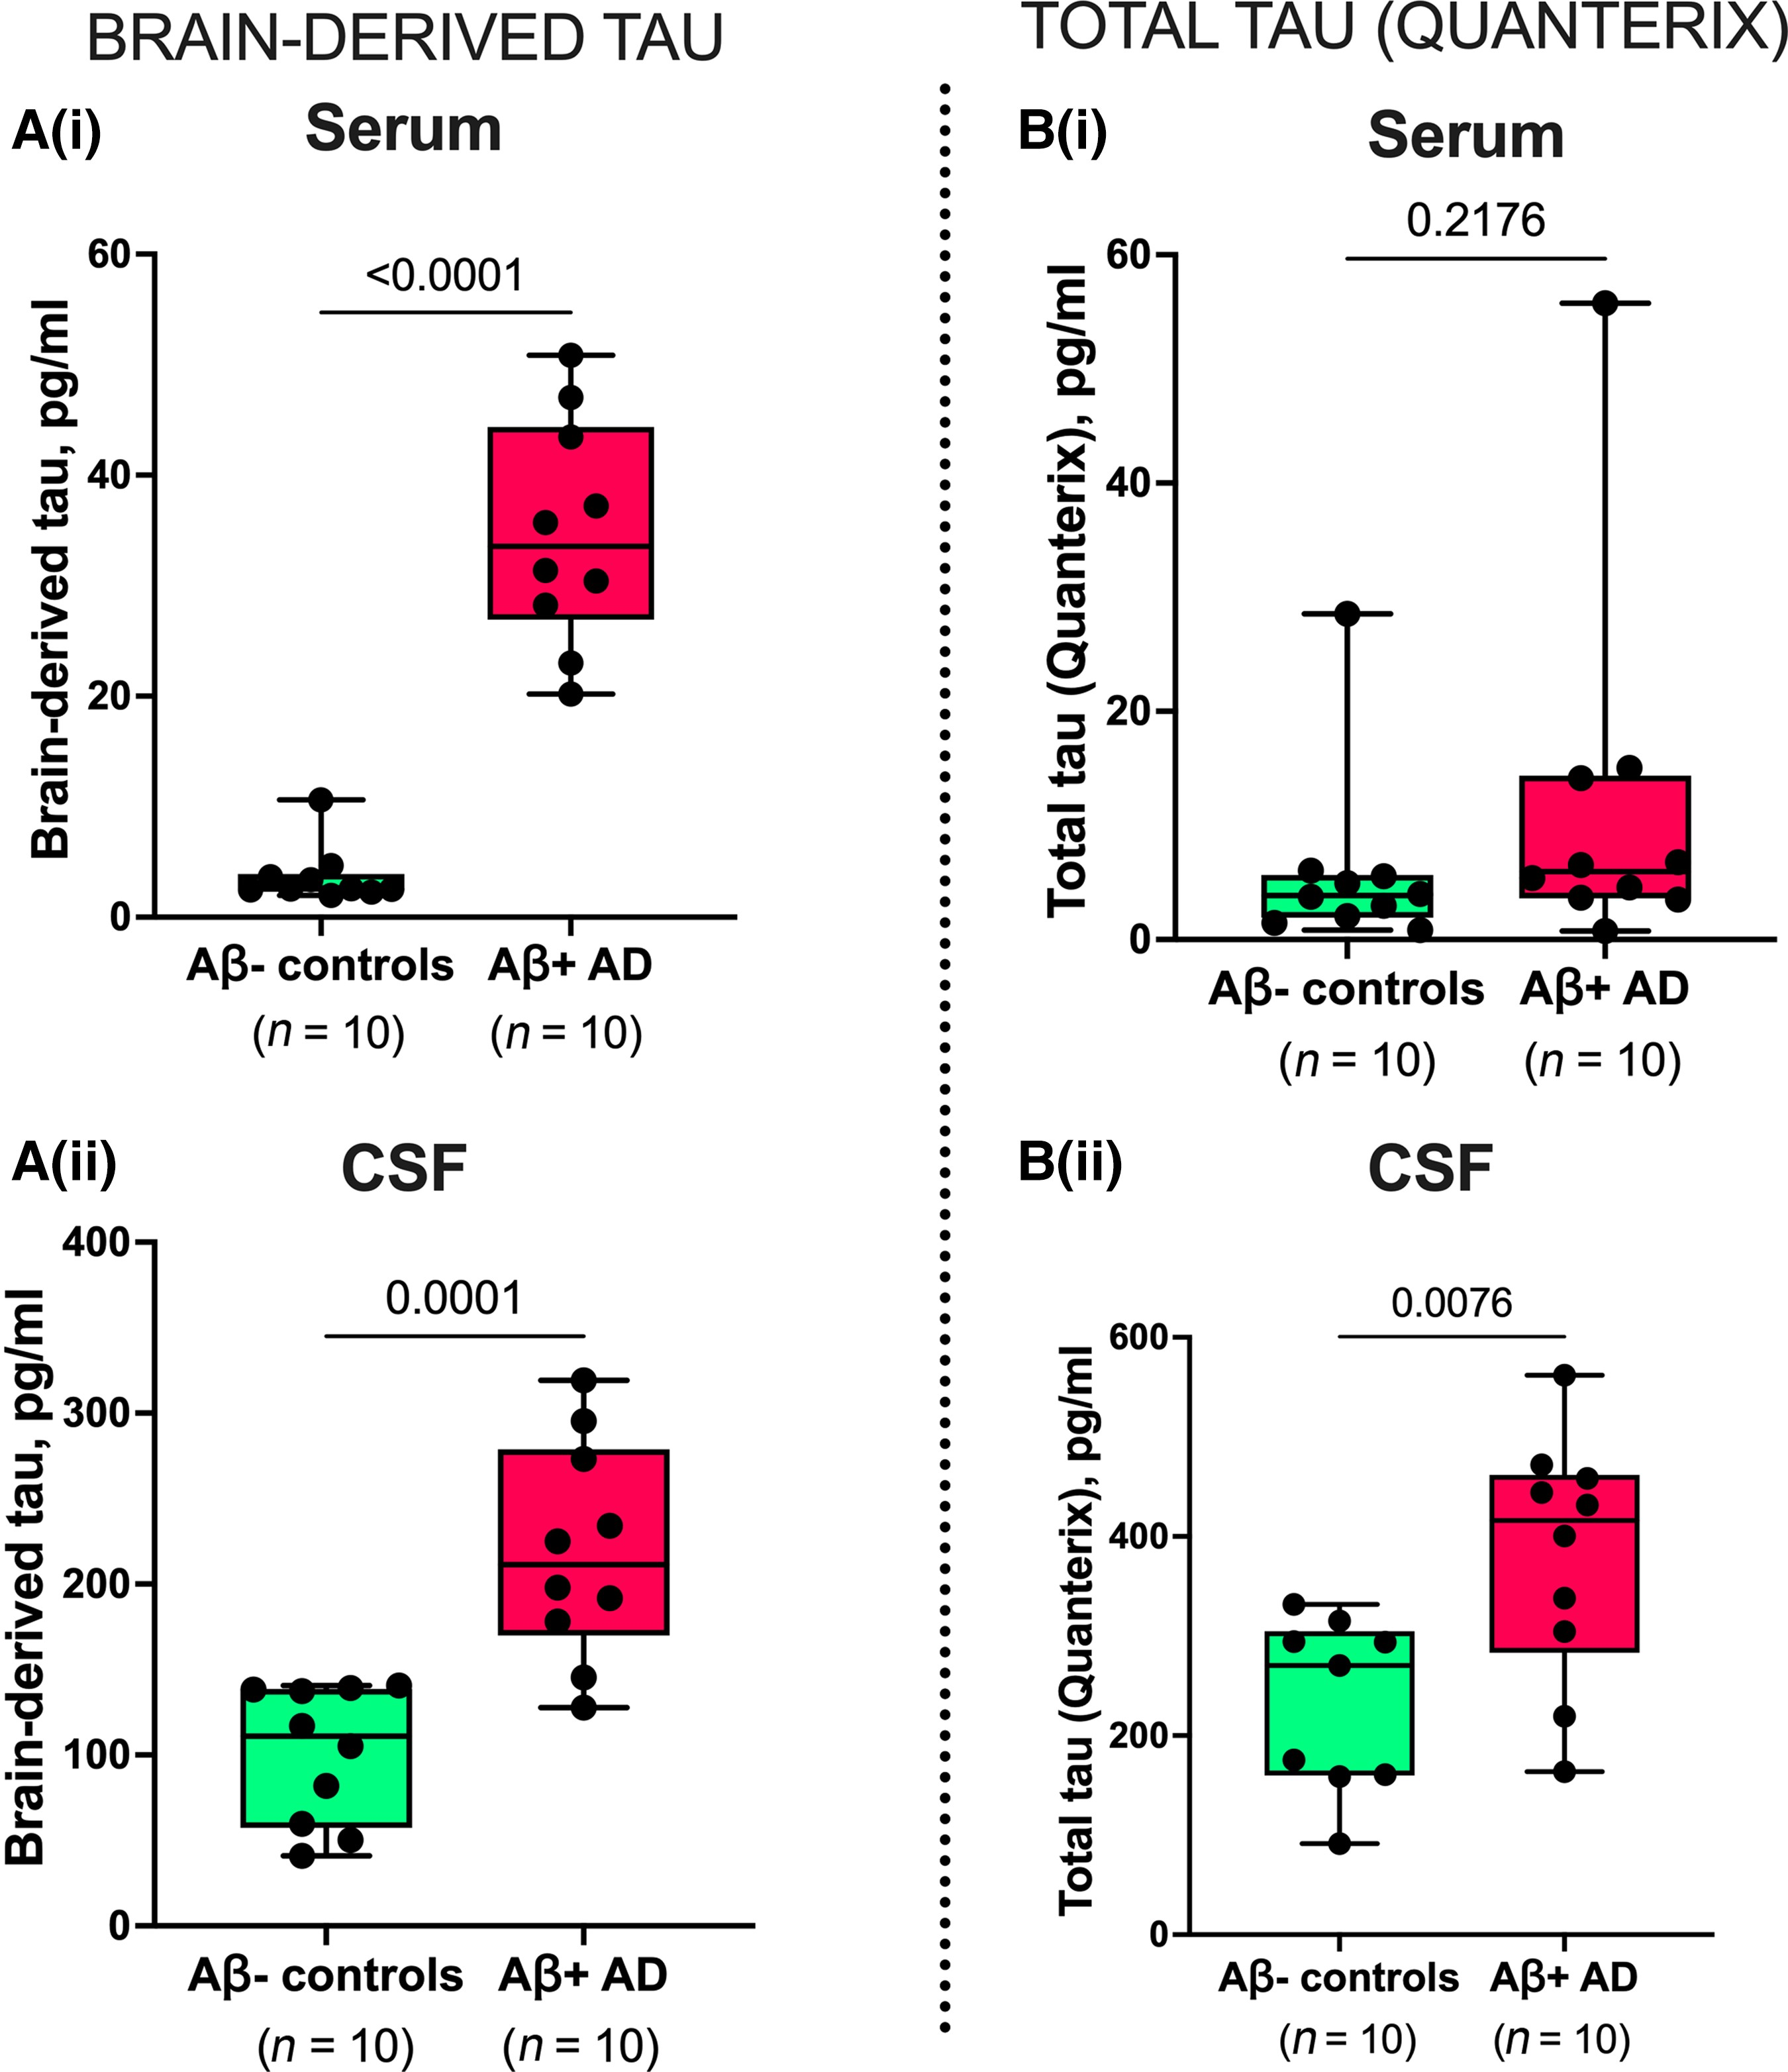
BD-tau levels were increased in Alzheimer’s disease versus controls in paired serum and CSF samples [P ≤ 0.0001; Fig. 3A(i and ii)], with fold changes of 9.5 and 2.2, respectively. However, t-tau was increased in Alzheimer’s disease versus controls in CSF (P = 0.0076) but not in paired serum samples [P = 0.2176; Fig. 3B(i and ii)]. Here, the fold changes were smaller; 1.9 and 1.6 for serum and CSF, respectively. In the same sample pairs, the diagnostic accuracy of serum BD-tau was 100 versus 67.0% [5% confidence interval (CI) = 42.3–91.7%] for serum t-tau.
Concentrations and correlation of BD-tau in paired serum and CSF samples.
[A(i and ii)] Concentrations of BD-tau in paired serum and CSF samples showing significant increases in Aβ+ Alzheimer’s disease and Aβ− control individuals classified according to their neurochemical CSF biomarker profiles. The corresponding levels of t-tau (Quanterix) in the same paired serum and CSF samples are shown in B(i) and B(ii), respectively. P-values indicate the results of Mann–Whitney tests. In each box plot, the horizontal bar on top of the coloured area shows the 75% percentile, the middlebar depicts the median and the lower bar shows the 25% percentile. Values that are above the 75% percentile and below the 25% percentile are shown outside the coloured areas.
Assuming that serum and CSF tau originate from the same BD-tau pool, we estimated that serum BD-tau reflects 4% of the corresponding CSF concentrations in normal ageing (Aβ− controls) and 16% in Alzheimer’s disease. The t-tau assay, on the other hand, showed 3% serum-to-CSF ratios in both Alzheimer’s disease and Aβ− controls.
In the Neurochemical cohort, serum BD-tau was increased in Alzheimer’s disease versus controls (Mann–Whitney U = 0, P < 0.0001; fold change = 3.1) similar to CSF t-tau, with an AUC of 100% (Supplementary Fig. 2).
Plasma BD-tau differentiates Alzheimer’s disease from other neurodegenerative diseases
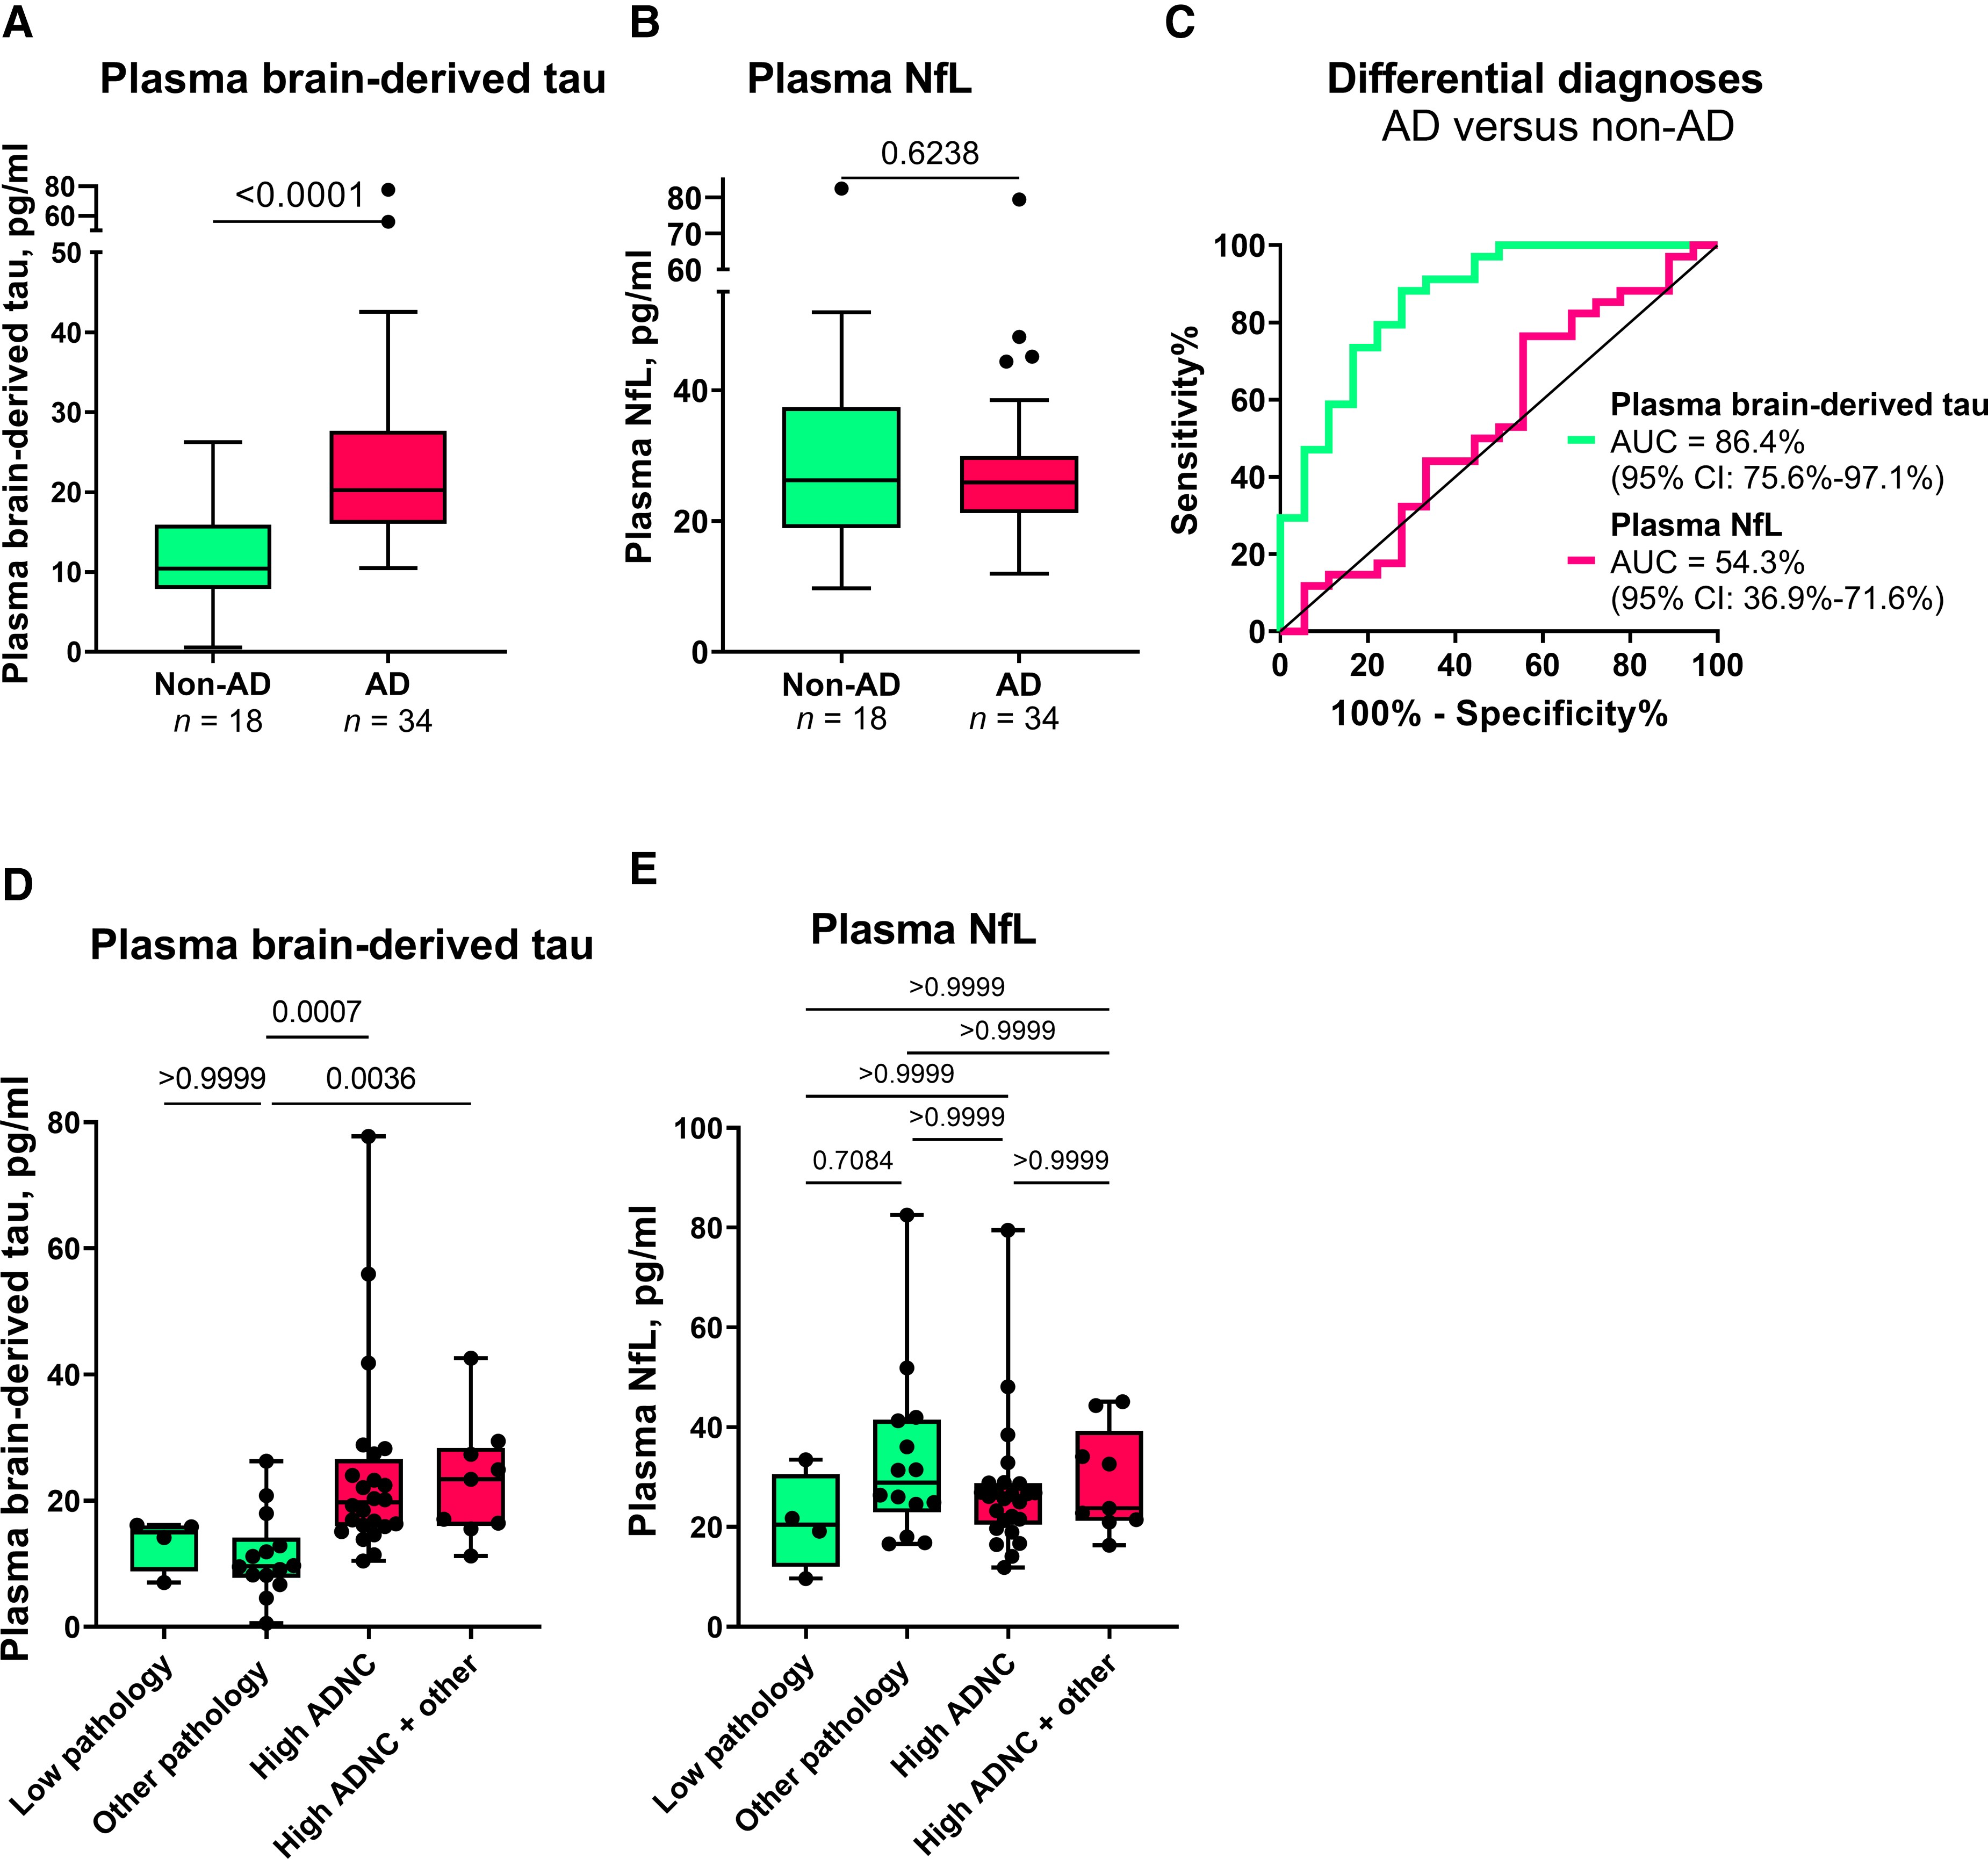
In the Neuropathology cohort, plasma BD-tau was increased in Alzheimer’s disease versus non-Alzheimer’s disease (Mann–Whitney U = 83.5, P < 0.0001) with a diagnostic accuracy of 86.4% (95% CI = 75.6–97.1%; Fig. 4A and C). To the contrary, plasma NfL was not significantly increased in Alzheimer’s disease (Mann–Whitney U = 280, P = 0.6238; AUC = 54.3%, 95% CI = 36.9–71.6%; Fig. 4B and C). Fold changes of 5.0 versus 1.0 were observed for plasma BD-tau and NfL, respectively.
Plasma BD-tau accurately differentiates autopsy-verified Alzheimer’s disease from other neurodegenerative diseases.
(A) and (B) Tukey plots of plasma BD-tau and plasma NfL levels in the Alzheimer’s disease (AD) and the non-Alzheimer’s disease (non-AD) groups in the Neuropathology cohort. The corresponding ROC and AUC values indicating between-group discriminatory accuracies of the biomarkers are shown in C. The diagonal line on the ROC plot shows 50% accuracy meaning no difference from chance events. (D and E) Plasma BD-tau and NfL stratified according to ADNC. The non-AD group was divided into Low Pathology (limited amyloid plaques in the absence of tau tangles) or Other Pathology (non-Alzheimer pathologies). The pathology-confirmed Alzheimer’s disease group was also divided into High ADNC and High ADNC + Other (Alzheimer’s disease in the presence of concomitant pathologies) subgroups. (A) Plasma BD-tau was significantly increased in both the High ADNC and the High ADNC + Other subgroups compared with the Other Pathology group. P-values indicate the results of Mann–Whitney test (for two groups) or Kruskal–Wallis test adjusted for multiple comparisons (three or more groups). In each box plot, the horizontal bar on top of the coloured area shows the 75% percentile, the middle bar depicts the median and the lower bar shows the 25% percentile. Values that are above the 75% percentile and below the 25% percentile are shown outside the coloured areas.
In secondary analyses, we stratified the Alzheimer’s disease group into High ADNC and High ADNC + Other (Alzheimer’s disease with concomitant pathologies such as Lewy body dementia and hippocampal sclerosis) subgroups, and the non-Alzheimer’s disease group into those diagnosed with Low or Other Pathology groups. We found no difference in plasma BD-tau between the High ADNC and the High ADNC + Other subgroups (P > 0.999; Fig. 4D). Similarly, there was no difference between the Low and Other Pathology subgroups (P > 0.999; Fig. 4D). However, plasma BD-tau differentiated the Other Pathology subgroup from both the High ADNC and High ADNC + Other subgroups (P ≤ 0.0036; Fig. 4D). While we observed differences between the Low Pathology versus each of the High ADNC and the High ADNC + Other subgroups at the group-level (Table 1), these did not reach statistical significance probably because of the reduced statistical power. Plasma NfL did not differentiate between any of the subgroups (Fig. 4E).
| Variable | Non-Alzheimer’s disease (n = 18) | Alzheimer’s disease (n = 34) | P-value (t-test or chi-squared as appropriate) | ||
|---|---|---|---|---|---|
| Low Pathology | Other Pathology | High ADNC | High ADNC + Other | Alzheimer’s disease versus non-Alzheimer’s disease | |
| n | 4 | 14 | 25 | 9 | |
| Age at plasma | 78.9 ± 4.1 | 74.8 ± 8.2 | 72.5 ± 8.1 | 71.4 ± 9.5 | 0.13 |
| Age at death | 84.3 ± 4.2 | 78.1 ± 8.6 | 75.7 ± 7.8 | 74.8 ± 10.7 | 0.11 |
| Last plasma to death interval | 5.4 ± 3.6 | 3.3 ± 2.4 | 3.2 ± 1.9 | 3.4 ± 1.8 | 0.50 |
| Female | 0 (0%) | 1 (7%) | 10 (40%) | 2 (22%) | 0.04 |
| Hispanic | 2 (50%) | 1 (7%) | 1 (4%) | 0 (0%) | 0.22 |
| Education, years | 13.8 ± 2.9 | 16.6 ± 3.3 | 16.3 ± 2.5 | 15.6 ± 3.1 | 0.88 |
| APOE 0 ε4 alleles | 3 (75%) | 12 (86%) | 9 (36%) | 4 (44%) | *0.007 |
| APOE 1 ε4 allele | 1 (25%) | 2 (14%) | 12 (48%) | 5 (56%) | |
| APOE 2 ε4 alleles | 0 (0%) | 0 (0%) | 4 (16%) | 0 (0%) | |
| MMSE | 29.5 ± 1 | 22.7 ± 5.7 | 15.9 ± 7.1 | 22.1 ± 3.3 | 5.4 × 10⁻⁴ |
| DRS | 130.5 ± 11.1 | 108.8 ± 19.5 | 95.1 ± 26.7 | 105.9 ± 22.7 | 0.02 |
| CDR-SOB | 4.8 ± 6.7 | 6.7 ± 4.6 | 9.5 ± 4.1 | 7.7 ± 4.8 | 0.07 |
| Clinical diagnosis | |||||
| Normal | 3 (75%) | 2 (14%) | 0 (0%) | 0 (0%) | **0.006 |
| MCI | 0 (0%) | 0 (0%) | 0 (0%) | 0 (0%) | – |
| Alzheimer’s disease | 1 (25%) | 3 (21%) | 23 (92%) | 9 (100%) | **5.0 × 10⁻⁷ |
| DLB/PDD | 0 (0%) | 8 (57%) | 0 (0%) | 0 (0%) | **1.3 × 10⁻⁴ |
| FTLD | 0 (0%) | 0 (0%) | 1 (4%) | 0 (0%) | **1.0 |
| Other | 0 (0%) | 1 (7%) | 1 (4%) | 0 (0%) | **1.0 |
| Plasma Aβ42, pg/ml | 13.5 ± 1.9 | 14.7 ± 4.3 | 10.9 ± 3.6 | 10.6 ± 2.1 | 0.002 |
| Plasma Aβ40, pg/ml | 223.5 ± 30.6 | 214.1 ± 58.4 | 200.5 ± 52.8 | 198.2 ± 29.9 | 0.28 |
| Plasma Aβ42/40 ratio | 0.06 ± 0.002 | 0.069 ± 0.01 | 0.054 ± 0.009 | 0.054 ± 0.008 | 2.7 × 10⁻⁵ |
| Plasma t-tau, pg/ml | 1.8 ± 0.5 | 1.7 ± 0.4 | 2.5 ± 1.3 | 2.3 ± 1 | 0.003 |
| Plasma p-tau181, pg/ml | 2.6 ± 1 | 2.8 ± 1.6 | 5.6 ± 2 | 5.8 ± 2 | 4.1 × 10⁻⁷ |
| Plasma p-tau231, pg/ml | 7.5 ± 1.6 | 8.3 ± 5.4 | 14.6 ± 6.1 | 15.2 ± 3.9 | 1.1 × 10⁻⁴ |
| Plasma NfL, pg/ml | 21 ± 9.8 | 33.6 ± 17.4 | 27.3 ± 13.2 | 29.1 ± 10.5 | 0.50 |
| Plasma BD-tau, pg/ml | 13.3 ± 4.3 | 11.3 ± 6.6 | 72.1 ± 240.8a | 23.1 ± 9.5 | 7.3 × 10⁻⁵ |
Demographic characteristics of the Neuropathology cohort
CDR-SOB = Clinical Dementia Rating Sum of Boxes; DLB = dementia with Lewy bodies; DRS = Dementia Rating Scale; FTLD = frontotemporal lobal degeneration; MCI = mild cognitive impairment; MMSE = Mini-Mental State Examination; PDD = Parkinson’s disease with dementia.
aThe mean ± SD for plasma BD-tau becomes 24.1 ± 15.1 pg/ml when excluding an outlier BD-tau value of 1225.8 pg/ml.
*Calculated as chi-squared test for overall number of e4 alleles (0, 1 or 2).
**P-value for each diagnosis tested separately. The P-value for the overall chi-squared with all diagnostic possibilities is 7.2 × 10⁻⁷.
Profile of BD-tau in different neurodegenerative diseases
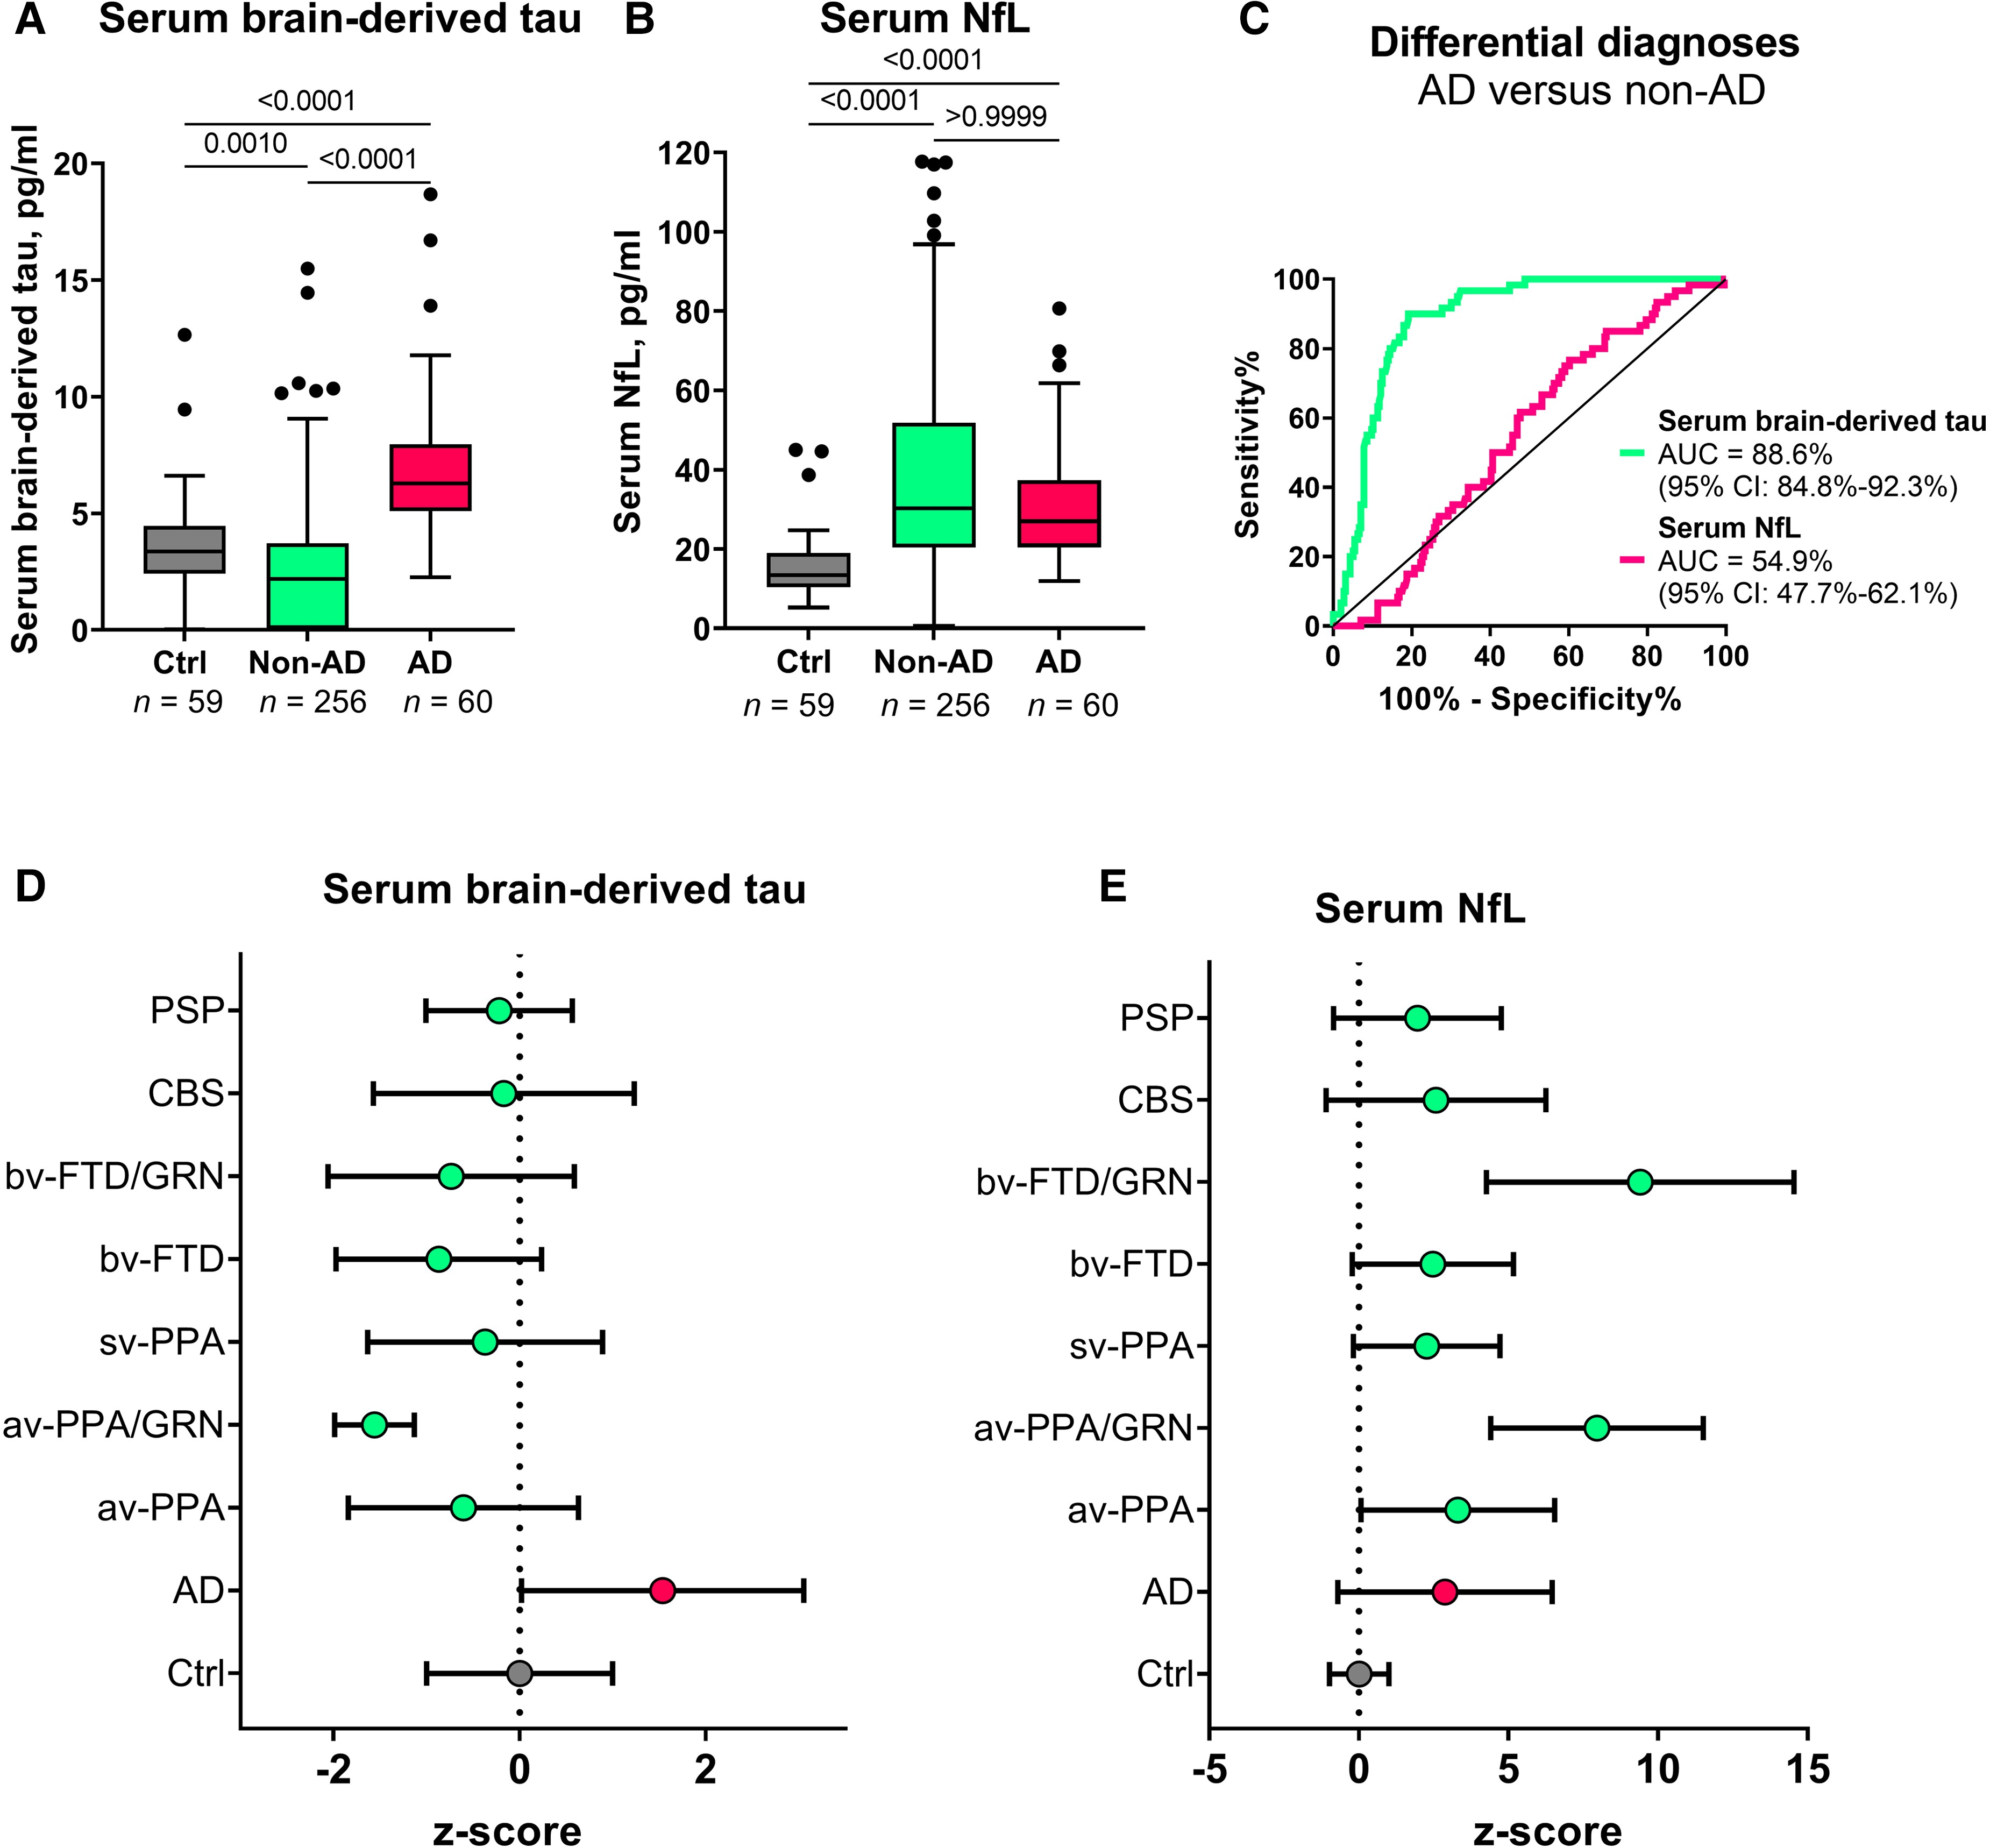
In Memory Clinic Cohort 1, serum BD-tau was significantly increased in Alzheimer’s disease versus non-Alzheimer’s disease (P < 0.0001; AUC = 88.6%, 95% CI = 84.8–92.3%; Fig. 5A and C). To the contrary, plasma NfL showed no differential diagnostic utility (AUC = 54.9%, 95% CI = 47.7–62.1%; Fig. 5B and C). The fold changes (versus controls) in Alzheimer’s disease were 8.9 for BD-tau and 2.6 for NfL. In non-Alzheimer’s disease, serum BD-tau had a fold change of 1.3 while for NfL this was 2.2.
Serum BD-tau profile in Alzheimer’s disease versus several other neurodegenerative diseases in Memory Clinic Cohort 1.
The Tukey box plots in A and B show serum BD-tau and serum NfL respectively in the control, non-Alzheimer’s disease (non-AD) and Alzheimer’s disease (AD) groups. (C) ROC and AUC values for the differential diagnostic function of serum BD-tau and NfL. (D and E) Z-score transformed plots of serum BD-tau and NfL in the control (Ctrl), AD and specific non-AD groups. AUC comparisons of serum BD-tau and NfL to differentiate each group from Alzheimer’s disease is shown in Table 2. In each box plot, the horizontal bar on top of the coloured area shows the 75% percentile, the middle bar depicts the median and the lower bar shows the 25% percentile. Values that are above the 75% percentile and below the 25% percentile are shown outside the coloured areas. Note that the tendency of serum BD-tau concentrations to be lower than in the frontotemporal lobal degeneration groups especially in GRN mutation carriers has also been shown for serum p-tau181 and NfL in this same population.56 Similarly, the highly increased levels of serum NfL in GRNmutation carriers has also been reported before.58 AD = Alzheimer’s disease; avPPA = agrammatic variant primary progressive aphasia; avPPA/GRN = agrammatic variant primary progressive aphasia with progranulin mutation; bvFTD = behavioural frontotemporal dementia; bvFTD/GRN = behavioural frontotemporal dementia with progranulin mutation; CBS = corticobasal syndrome; PSP = progressive supranuclear palsy; svPPA = semantic variant primary progressive aphasia.
When the non-Alzheimer’s disease group in Memory Clinic Cohort 1 was divided into specific diagnostic groups, the differential diagnostic accuracy of serum BD-tau versus Alzheimer’s disease remained high (up to 99.6%) and outperformed serum NfL in each group except in those with GRN mutations where NfL is known to be highly increased58 (Table 2). In agreement, concentrations of serum BD-tau were significantly higher in the Alzheimer’s disease group versus each other diagnostic group (Fig. 5D and E).
| Serum BD-tau | Serum NfL | |
|---|---|---|
| Group comparison | AUC (95% confidence interval) | |
| AD versus avPPA | 88.9% (81.1–96.6%) | 62.2% (50.5–74%) |
| AD versus avPPA/GRN | 99.6% (98.7–100%) | 94% (88.2–99.7%) |
| AD versus svPPA | 87.3% (77.4–97.1%) | 50.9% (36.5–65.3%) |
| AD versus bvFTD | 93.2% (89.4–97%) | 51.2% (42.2–60.25%) |
| AD versus bvFTD/GRN | 81.6% (63.7–99.5%) | 94.4% (89–99.8%) |
| AD versus CBS | 83.8% (75.2–92.4%) | 51.5% (39.4–63.6%) |
| AD versus PSP | 77.8% (65.8–90.5%) | 58.9% (45.4–72.3%) |
Discriminatory accuracy of serum BD-tau and other serum biomarkers to separate Alzheimer’s disease from specific non-Alzheimer’s disease disorders
AD = Alzheimer’s disease; avPPA = agrammatic variant primary progressive aphasia; avPPA/GRN = agrammatic variant primary progressive aphasia with progranulin mutation; bvFTD = behavioural frontotemporal dementia; bvFTD/GRN = behavioural frontotemporal dementia with progranulin mutation; CBS = corticobasal syndrome; PSP = progressive supranuclear palsy; svPPA = semantic variant primary progressive aphasia.
In Memory Clinic Cohort 2, plasma BD-tau concentrations were higher in Alzheimer’s disease versus non-Alzheimer’s disease (P < 0.0001; AUC = 80.0%, 95% CI = 69.1–91.0%), (Supplementary Fig. 3).
BD-tau in blood associates with neurodegeneration markers in Alzheimer’s disease but not in other neurodegenerative diseases
Serum BD-tau correlated with CSF t-tau in the Discovery and Neurochemical cohorts (Spearman’s rho = 0.65–0.83, P < 0.0001). These associations existed in the entire cohorts and in the Alzheimer’s disease group (Supplementary Table 3).
In the Neuropathology cohort, plasma BD-tau correlated with NfL only in the Alzheimer’s disease group but not in the non-Alzheimer’s disease group (Supplementary Table 4). Similarly, serum BD-tau correlated with NfL in Memory Clinic Cohort 1 only in the Alzheimer’s disease group (Spearman’s rho = 0.63, P < 0.0001) and controls (Spearman’s rho = 0.33, P = 0.0115), but not in the non-Alzheimer’s disease group (Spearman’s rho = −0.12, P = 0.0658; Supplementary Table 5). In agreement, serum NfL but not BD-tau correlated with cortical thickness in the non-Alzheimer’s disease group (data not shown).
Plasma BD-tau associates with plaque and tangle pathologies at post-mortem
Plasma BD-tau was increased in individuals with frequent versus sparse neuritic plaques according to the CERAD scale (P < 0.0001) and in those with High ADNC versus Low ADNC in line with the NIA Reagan criteria50 (data not shown). Plasma BD-tau correlated with global neuritic plaque counts (Spearman’s rho = 0.58, P < 0.0001), and with diffuse plaque count (Spearman’s rho = 0.56, P < 0.0001; Table 3). In addition, plasma BD-tau correlated with regional measures of neuritic and diffuse plaque pathologies in the hippocampus, superior temporal gyrus and inferior parietal lobe (Spearman’s rho = 0.53–0.68, P ≤ 0.0079; Table 3). Plasma BD-tau did not correlate with cerebral amyloid angiopathy (data not shown). To the contrary, plasma NfL was neither increased according to, nor correlated with, any of the neuropathological measures of plaque pathology (Table 3).
| Plasma BD-tau | Plasma NfL | |
|---|---|---|
| Global measures | ||
| Neuritic plaques | rho = 0.58 (P < 0.0001) | rho = −0.06 (P = 0.6708) |
| Diffuse plaques | rho = 0.56 (P < 0.0001) | rho = −0.06 (P = 0.6686) |
| Regional measures | ||
| Neuritic plaques | ||
| Hippocampal | rho = 0.53 (P = 0.0066) | rho = −0.14 (P = 0.5009) |
| Superior temporal | rho = 0.52 (P = 0.0079) | rho = −0.13 (P = 0.5312) |
| Inferior parietal | rho = 0.68 (P = 0.0002) | rho = 0.17 (P = 0.4262) |
| Diffuse plaques | ||
| Hippocampal | rho = 0.55 (P = 0.0066) | rho = −0.13 (P = 0.5251) |
| Superior temporal | rho = 0.65 (P = 0.0004) | rho = 0.02 (P = 0.9382) |
| Inferior parietal | rho = 0.64 (P = 0.0005) | rho = 0.02 (P = 0.8994) |
| NFTs | ||
| Hippocampal | rho = 0.56 (P = 0.0033) | rho = 0.09 (P = 0.6848) |
| Superior temporal | rho = 0.55 (P = 0.0048) | rho = −0.05 (P = 0.8090) |
| Inferior parietal | rho = 0.55 (P = 0.0042) | rho = 0.01 (P = 0.9710) |
| Middle frontal | rho = 0.67 (P = 0.0003) | rho = 0.03 (P = 0.8720) |
Spearman correlation of plasma BD-tau versus NfL with regional plaque and tangle pathologies biomarkers in the Neuropathology cohort
Plasma BD-tau correlated with tangle pathology in the hippocampal, superior temporal and inferior parietal, and middle frontal regions (Spearman’s rho ≥ 0.54, P≤ 0.0048; Table 3). On the other hand, plasma NfL did not correlate with tangle pathology (Table 3).
Serum BD-tau correlated inversely with CSF Aβ42 in the Discovery and Neurochemical cohorts (Spearman’s rho = −0.59–−0.73, P ≤ 0.0003; Supplementary Table 3). Plasma/serum BD-tau correlated significantly with plasma and CSF p-tau across cohorts (Supplementary Tables 3 and 4). However, serum BD-tau did not correlate with serum t-tau (Spearman’s rho = 0.26, P = 0.2738; Supplementary Table 3).
BD-tau associates with cognitive performance in Alzheimer’s disease
Plasma BD-tau correlated inversely with MMSE (Spearman’s rho = −0.34, P = 0.0184) and Clinical Dementia Rating global scores (Spearman’s rho = −0.30, P = 0.0352) in the Neuropathology cohort. Plasma BD-tau correlated positively with age of disease onset in Memory Clinic Cohort 1 (Spearman’s rho = 0.33, P < 0.0001).
Discussion
In this study, we present the development and validation of an ultrasensitive immunoassay, and report clinical performance results in five independent cohorts for an improved blood-based t-tau biomarker, BD-tau. In short, plasma BD-tau was shown to be an Alzheimer’s disease-type neurodegeneration biomarker that can discriminate between autopsy-verified Alzheimer’s disease from other neurodegenerative diseases, and in addition is associated with clinical severity of disease in the Neuropathology cohort. The significance of this biomarker, which also explains these findings, is that blood and CSF levels correlate strongly in paired samples. The assay was developed using a monoclonal antibody that selectively binds to CNS tau isoforms (hence the name BD-tau). This property makes it superior to the current plasma t-tau biomarker that does not correlate with CSF t-tau, probably because it also captures tau from peripheral sources.25,27,29 Furthermore, BD-tau in blood, like NfL, has high diagnostic accuracy to detect neurodegeneration in Alzheimer’s disease. However, plasma BD-tau demonstrated the novel finding of being able to accurately distinguish pathologically confirmed Alzheimer’s disease from several other neurodegenerative diseases while plasma NfL did not. These performances were specific to the neuropathological diagnosis of Alzheimer’s disease, and were unaffected by mixed pathologies. Furthermore, plasma BD-tau, but not plasma NfL, was associated with global and regional amyloid-plaque and NFT counts in the Neuropathology cohort. Moreover, correlations between plasma/serum BD-tau and NfL were observed only in individuals with Alzheimer’s disease but not those with other neurodegenerative diseases.
Attempts to develop a blood-based t-tau biomarker with similar performance as CSF t-tau have been challenging. Plasma t-tau does not correlate with CSF t-tau when measured in paired samples.25,27,29 In agreement, several studies have reported poor diagnostic performances of plasma t-tau for Alzheimer’s disease and for differential diagnosis of Alzheimer’s disease versus other neurodegenerative diseases.24–29,59,60Since tau protein is expressed in several peripheral sources in addition to the CNS,35,36 we hypothesized that plasma t-tau is significantly affected by tau from peripheral sources. An estimated 80% of the blood t-tau signal originates from peripheral tissues, meaning that the remaining 20% contribution from the CNS is unlikely to result in significant overall differences even when assuming typical fold increases of two to three in Alzheimer’s disease participants.25 Plasma t-tau rather shows diagnostic and prognostic utility in acute neurological disorders where CNS-derived tau levels in blood increase exponentially over a short duration presumably due to blood–brain barrier impairment.40,42,60,61
To address this problem, we aimed to develop a novel blood biomarker that selectively recognizes tau derived from the brain and avoids tau from peripheral sources. We took advantage of the fact that the MAPT gene has multiple splice variants expressed in a tissue-dependent pattern.36,37 Tau in the adult human brain has six isoforms between 352 and 441 amino acids long.36,62 However, tau in peripheral tissues—including the liver, kidney, heart and pancreas—is predominantly of the high molecular weight (‘big tau’) isoform with the exon 4a insert (Fig. 1A).36 Big tau is preferentially localized in peripheral tissues where it is the main form of tau expressed in the adult PNS.38,63 We hypothesized that by generating an antibody specifically against the junction between exons 4 and 5, we could develop a novel immunoassay that selectively targets BD-tau in blood. Biochemical characterization of the resulting monoclonal antibody, TauJ.5H3, the sequence of which was verified by epitope mapping (data not shown) showed that it only bound to recombinant protein constructs that had the exon 4–5 junction intact, and not those that stretched over exons 4–4a, 4a–5 and 4–4a–5 (Fig. 1). In contrast, the tau exon-4 antibody recognized all constructs that included the exon 4, including those lacking the exon 4–5 junction. The ultrasensitive immunoassay we developed using the TauJ.5H3 antibody showed strong dilution linearity, within- and between-run stability, and suitability for use in both plasma and serum. Importantly, the strong correlation between BD-tau measured in serum/plasma and paired CSF samples is an indication that it targets brain-originating tau forms just like CSF t-tau and CSF BD-tau. This finding is highly significant given that several independent studies have reported that plasma t-tau does not correlate with CSF t-tau27–29 (as also demonstrated herein), which may be partly to blame for its poor diagnostic performance.
The most well-validated blood biomarker for neurodegeneration, NfL, is unable to differentiate between Alzheimer’s disease and other dementias due to its increases in a wide range of neurodegenerative disorders.21,56,64 Consequently, the dementia research field currently lacks a blood biomarker that is specifically altered as a result of Alzheimer-type neurodegenerative changes, such as how plasma p-tau is to tau phosphorylation/pathology in the AT(N) framework.6,8,65 Our findings indicate that plasma BD-tau might be a biomarker that is specific for Alzheimer’s disease-type neurodegeneration and can discriminate Alzheimer’s disease from other neurodegenerative diseases, as shown previously for CSF t-tau.30–34 This conclusion is supported by our findings that plasma BD-tau was increased to the same extent in individuals diagnosed with Alzheimer’s disease at autopsy irrespective of whether or not they had mixed pathologies (Figs. 4 and 5). In comparison, the biomarker levels were significantly lower in the non-Alzheimer group. However, plasma NfL failed to distinguish Alzheimer’s disease from other diseases, affirming its limitations for differential diagnosis.
If BD-tau in blood is an Alzheimer’s disease-specific neurodegeneration biomarker, it should be associated with the intensity of the key pathological features of Alzheimer’s disease—plaques and tangles, as demonstrated for blood p-tau.14,15,19,66Plasma BD-tau correlated with neuritic and diffuse amyloid-plaque and NFT counts, and additionally with CSF and plasma Aβ42 and p-tau. Moreover, plasma BD-tau correlated with NfL only in Alzheimer’s disease but not in other neurodegenerative diseases, further supporting its Alzheimer’s disease specificity. Together, the results demonstrate that plasma/serum BD-tau is an Alzheimer’s disease-type neurodegeneration biomarker that associates with principal pathological features of the disease. Future studies will aim to elucidate what neurodegenerative process(es) in Alzheimer’s disease that plasma BD-tau reflects—for e.g. neuronal injury intensity (such as CSF t-tau), loss and shrinkage of the neuropil (such as by using structural MRI) or functional neuronal impairment including glucose hypometabolism (such as by using FDG PET).
Despite serum BD-tau levels being significantly lower in non-Alzheimer’s disease versus Alzheimer’s disease, the concentrations in individuals with frontotemporal lobal degeneration, particularly those carrying GRN mutations, tended to be further lower than those of control participants and the other non-Alzheimer’s disease groups (including progressive supranuclear palsy and corticobasal syndrome; Fig. 5). While this observation might be unexpected, highly comparable results have been reported for serum p-tau181 in the same population.56 Together, the findings may suggest a remarkable decrease in the secretion of CNS-specific biomarkers into the bloodstream in frontotemporal lobal degeneration. Conversely, the high increases in serum NfL for the GRN mutation carriers is corroborated in previous independent studies.58 These results deserve further investigation in other cohorts.
What is the value of plasma BD-tau since plasma p-tau also differentiates Alzheimer’s disease from other neurodegenerative diseases? First, we need separate biomarkers of amyloid, tau and neurodegeneration as stipulated in the AT(N) and the International Working Group frameworks.1–3 Biomarkers of neurodegeneration are not interchangeable with those that reflect amyloidosis or tau phosphorylation. The frameworks also allow for flexibility to include novel biomarkers including those identified in other biofluids. More recently, plasma Aβ42/Aβ40 and p-tau biomarkers have shown great potential to substitute for CSF A and T biomarkers in the AT(N) scheme.67 However, unlike in CSF where t-tau shows specificity to Alzheimer’s disease, there is currently no blood biomarker that reflects neurodegeneration specific to Alzheimer’s disease. NfL in blood does not meet this requirement because it reflects neurodegeneration shared among multiple neurodegenerative diseases.21,64 Plasma BD-tau shows high potential as a neurodegeneration biomarker of the Alzheimer’s type. We anticipate that combining plasma BD-tau with p-tau and possibly Aβ42/Aβ40 will increase accuracy of a blood biomarker-based diagnosis of Alzheimer’s disease by increasing its agreement with results obtained at autopsy or by using CSF or neuroimaging biomarkers.
In the present study, we report a novel blood biomarker specific for BD-tau. Validation showed strong correlations between paired blood and CSF measures, and we verified a high performance to specifically identify Alzheimer’s disease-type neurodegeneration. Future studies will further address the characteristics of this novel biomarker, including exploring its longitudinal changes across the Alzheimer’s disease continuum in both sporadic and familial Alzheimer’s disease, associations with neuroimaging AT(N) biomarkers and the influence of genetic risks (e.g. APOE ε4). Additionally, we will verify the generalizability of the biomarker in diverse, multi-ethnic cohorts from a variety of populations. Furthermore, we will characterize BD-tau in disorders that CSF t-tau is known to be increased in, including acute traumatic brain injury and Creutzfeldt–Jakob disease.