
Age-dependent neurodegeneration and neuroinflammation in a genetic A30P/A53T double-mutated α-synuclein mouse model of Parkinson’s disease

By Lisa Rauschenberger, Jennifer Behnke, Alexander Grotemeyer, Susanne Knorr, Jens Volkmann, and Chi Wang
Excerpt from the article published in Neurobiology of Disease, Volume 171, September 2022, 105798, ISSN 0969-9961, DOI: https://doi.org/10.1016/j.nbd.2022.105798.
Editor’s Highlights
- The neuronal cell death characteristic for Parkinson’s disease (PD) has been associated with multiple cellular and molecular mechanisms such as mitochondrial dysfunction, oxidative stress, and proteasomal abnormalities.
- Mitochondrial damage and oxidative stress are considered major reasons for neurodegeneration in PD and it has been shown that α-synuclein itself can bind mitochondrial complex I and disturb its activity, thus affecting the mitochondrial function of the cell.
- The hm2α-SYN-39 mouse model reflects important aspects of the disease and shows mild, but age-dependent and dopaminergic-loss-correlated neuroinflammation.
- T cell driven neuroinflammation occurs only when dopaminergic loss sets in, but microglial-driven inflammation may set in earlier.
Authors’ Highlights
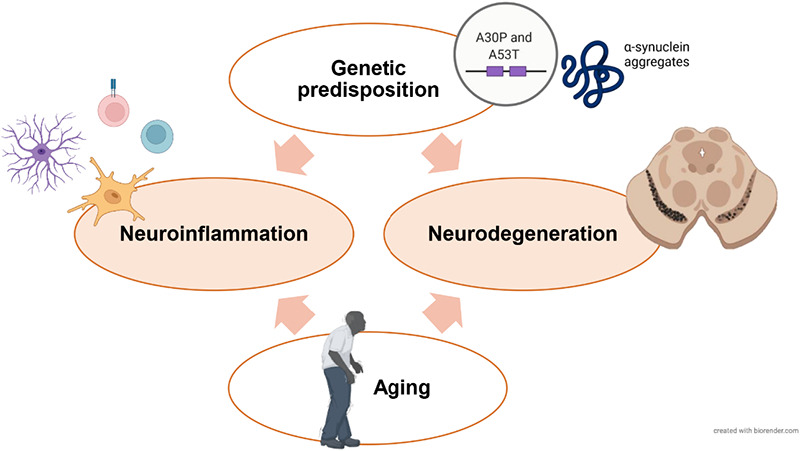
- Aging, genetic predisposition and inflammation are potential key mechanisms in PD.
- hm2α-SYN-39 mice show age-dependent loss of dopamine neurons and mild parkinsonism.
- The substantia nigra shows an age-dependent increase of CD8+ T cells and microglia.
- Age-related rise in T cell numbers correlates with dopamine loss in the striatum.
- Evidence of neuroinflammation makes aging hm2α-SYN-39 mice translationally valuable.
Abstract
The pathogenesis of Parkinson’s disease (PD) is closely interwoven with the process of aging. Moreover, increasing evidence from human postmortem studies and from animal models for PD point towards inflammation as an additional factor in disease development. We here assessed the impact of aging and inflammation on dopaminergic neurodegeneration in the hm2α-SYN-39 mouse model of PD that carries the human, A30P/A53T double-mutated α-synuclein gene. At 2–3 months of age, no significant differences were observed comparing dopaminergic neuron numbers of the substantia nigra (SN) pars compacta of hm2α-SYN-39 mice with wildtype controls. At an age of 16–17 months, however, hm2α-SYN-39 mice revealed a significant loss of dopaminergic SN neurons, of dopaminergic terminals in the striatum as well as a reduction of striatal dopamine levels compared to young, 2–3 months transgenic mice and compared to 16–17 months old wildtype littermates. A significant age-related correlation of infiltrating CD4+ and CD8+ T cell numbers with dopaminergic terminal loss of the striatum was found in hm2α-SYN-39 mice, but not in wildtype controls. In the striatum of 16–17 months old wildtype mice a slightly elevated CD8+ T cell count and CD11b+ microglia cell count was observed compared to younger aged mice. Additional analyses of neuroinflammation in the nigrostriatal tract of wildtype mice did not yield any significant age-dependent changes of CD4+, CD8+ T cell and B220+ B cell numbers, respectively. In contrast, a significant age-dependent increase of CD8+ T cells, GFAP+ astrocytes as well as a pronounced increase of CD11b+ microglia numbers were observed in the SN of hm2α-SYN-39 mice pointing towards a neuroinflammatory processes in this genetic mouse model for PD. The findings in the hm2α-SYN-39 mouse model strengthen the evidence that T cell and glial cell responses are involved in the age-related neurodegeneration in PD. The slow and age-dependent progression of neurodegeneration and neuroinflammation in the hm2α-SYN-39 PD rodent model underlines its translational value and makes it suitable for studying anti-inflammatory therapies.
1. Introduction
With increasing longevity of the world’s population, a parallel rise of people suffering from Parkinson’s disease (PD) is predicted to occur. Indeed, higher age is the main risk factor for development of idiopathic PD (Dorsey et al., 2019). In addition, hereditary forms of PD were found to be caused by specific genetic mutations of the α-synuclein-encoding SNCA gene (Polymeropoulos et al., 1997; Krüger et al., 1998; Zarranz et al., 2004). Both, sporadic and hereditary forms are characterized by loss of dopaminergic cells in the substantia nigra (SN) as well as inclusion bodies consisting of misfolded α-synuclein described as Lewy bodies. Aside from these α-synuclein inclusions, an increasing amount of evidence has pointed towards neuroinflammation as a contributor to PD pathogenesis. Indeed, it has been postulated that a mechanism termed “inflammaging”, which is defined as an age-related, chronic imbalance between pro- and anti-inflammatory responses, underlies PD (Calabrese et al., 2018). In PD patients brain autopsies as well as in animal models for PD an infiltration of CD4+, CD8+ T cells into the SN as well as microglia activation has been observed compared to healthy subjects (McGeer et al., 1988; Brochard et al., 2009; Cebrián et al., 2014; Galiano-Landeira et al., 2020). Furthermore, pro-inflammatory molecules such as the tumor necrosis factor-alpha and interleukin-1β were observed in the striatum or cerebrospinal fluid of PD patients (Mogi et al., 1994; Mogi et al., 1996). Recent works have reported that α-synuclein-specific T cell responses can be observed in the peripheral blood of PD patients, even before onset of motor symptoms (Sulzer et al., 2017; Lindestam Arlehamn et al., 2020). One of the two α-synuclein-deduced peptides found to produce this immune response is the Y39 antigenic region, which is very close to α-synuclein mutations found in PD patients, such as the A30P and A53T mutations (Sulzer et al., 2017). The possible interplay of the innate and the adaptive immune system in PD pathogenesis has been studied in toxin-based animal models using 1-methyl-4-phenyl-1,2,3,6-tetrahydropyridine (MPTP) or 6-hydroxy dopamine (6-OHDA) as well as in animal models overexpressing α-synuclein by means of viral vectors (Brochard et al., 2009; Reynolds et al., 2010; Harms et al., 2013; Ip et al., 2015; Williams et al., 2021). While the MPTP and 6-OHDA animal models present a parkinsonian phenotype, the rapid toxin- or viral-vector-induced degeneration of dopaminergic neurons is not consistent with the known slow progression of the disease in humans. As such, genetic animal models for PD have high translational value when analyzing the slow and age-related pathophysiology of the disease. The work herein was performed with a genetic mouse model, which carries a human, double-mutated α-synuclein including the A53T and A30P mutations linked to a tyrosine hydroxylase (TH) promoter. Both mutations are known to induce autosomal-dominantly inherited PD in humans (Polymeropoulos et al., 1997; Krüger et al., 1998). In this heterozygous hm2α-SYN-39 mouse model, Richfield et al. found an age-dependent parkinsonian phenotype (Richfield et al., 2002). For an in-detail description of this mouse model, please refer to information box “Mouse models expressing human α-synuclein with the A30P and/or A53T mutation”. Evidence of neuroinflammation has been studied in neither the heterozygous nor the homozygous mouse model carrying human, double-mutated α-synuclein. Indeed, data on possible inflammatory processes in genetic mouse models for PD is sparse. In a mouse model overexpressing human wildtype (wt) α-synuclein driven by a TH promoter, microglia activation was significantly increased in the SN of young transgenic (tg) mice compared to C57BL/6 control mice (Su et al., 2008). The total number of Iba-1 stained microglia was assessed to be unchanged. While no dopaminergic neurodegeneration was observed, a mouse model expressing truncated human wt α-synuclein showed increased CD11b+ microglia in the SN compared to wt littermates (Tofaris et al., 2006). Mice with homozygous loss of parkin or PINK1, mutations which can cause Parkinson’s disease in humans, showed similar levels of inflammatory cytokines in the serum as wt mice (Sliter et al., 2018).
Mouse models expressing human α-synuclein with the A30P and/or A53T mutation
The characteristics of genetic mouse models for PD are highly variable depending on the mutation used, heterozygous or homozygous expression, the promoter used as well as the expression levels of the α-synuclein protein (van der Putten et al., 2000; Matsuoka et al., 2001; Giasson et al., 2002; Fleming et al., 2005). A rat TH-promoter, leading to an overexpression of α-synuclein protein in the catecholaminergic neurons of the nigrostriatal tract, drives the expression of the double-mutated, human α-synuclein in the herein used hm2α-SYN-39 mice. Indeed, expression of human α-synuclein was shown in dopaminergic cell bodies and dendrites as well as nigrostriatal axons and terminals (Richfield et al., 2002). Contrary to rodent models with a single mutation (A30P or A53T), the presence of both these mutations was found to lead to dopaminergic cell loss and the development of a phenotype (Matsuoka et al., 2001; Richfield et al., 2002; Thiruchelvam et al., 2004). Indeed, hm2α-SYN-39 were found to have a loss of TH+ neurons of about 19% at 8.5 months and about 55% at 19 months (Thiruchelvam et al., 2004). Richfield et al. found non-significantly reduced striatal dopamine (DA) levels in hm2α-SYN-39 mice aged between 2 and 9 months and significantly reduced levels in mice aged 16–18 months compared to nontransgenic littermates (Richfield et al., 2002). Inclusion bodies were not observed for transgenic (tg) mice up to an age of 7 months (Richfield et al., 2002, Thiruchelvam et al., 2004). Tg mice were shown to present decreased motor coordination in the inverted wire screen hanging test and reduced free motion for animals aged 13–23 months compared to 2–3 months old mice. Interestingly, tg mice aged 2–3 months were significantly more active than age-matched wt littermate controls (Richfield et al., 2002). At the age of 6 months no behavioral abnormalities were found in the rotarod performance test, grip strength test and the open field analysis (Yan et al., 2017). The hm2α-SYN-39 mice clearly differ from mice overexpressing human, wt α-synuclein, including age-dependent motor phenotype, morphological abnormalities of DA processes, age-related changes of the DA levels as well as much more pronounced DA neurodegeneration (Richfield et al., 2002). Interestingly, the abnormalities found in heterozygous hm2α-SYN-39 mice also differ from a homozygous A30P/A53T mouse strain created by Kilpeläinen et al. (Kilpeläinen et al., 2019). Indeed, these animals showed mild hypoactivity at the age of 3–6 months, older animals of 18 months of age were however found to be hyperactive compared to wt controls. Locomotor hyperactivity has been found in other mouse models overexpressing the A53T mutant variant of human α-synuclein using a prion protein promoter and has been associated with abnormal DA transporter function and an increase in D1 receptors (Unger et al., 2006; Graham and Sidhu, 2010).
Within this work, we aimed to identify a genetic mouse model, which reproduces important aspects of the broad pathology of PD, and to better understand the role of the immune system in synucleinopathies. We aimed to identify whether the increase of inflammation in the aging brain would differ depending on the genetic background and whether neuroinflammation would primarily accompany dopaminergic neurodegeneration or even precede it. Thus, the morphological and neurochemical changes of the dopaminergic system triggered by the double-mutated, human α-synuclein in the hm2α-SYN-39 mouse model were characterized over time (Fig. 1). Motor performance was analyzed with the aim to identify a potential parkinsonian phenotype. Mouse brains from young and aging mice were further studied for neuroinflammatory processes with focus on T and B cell infiltration and microglia number.
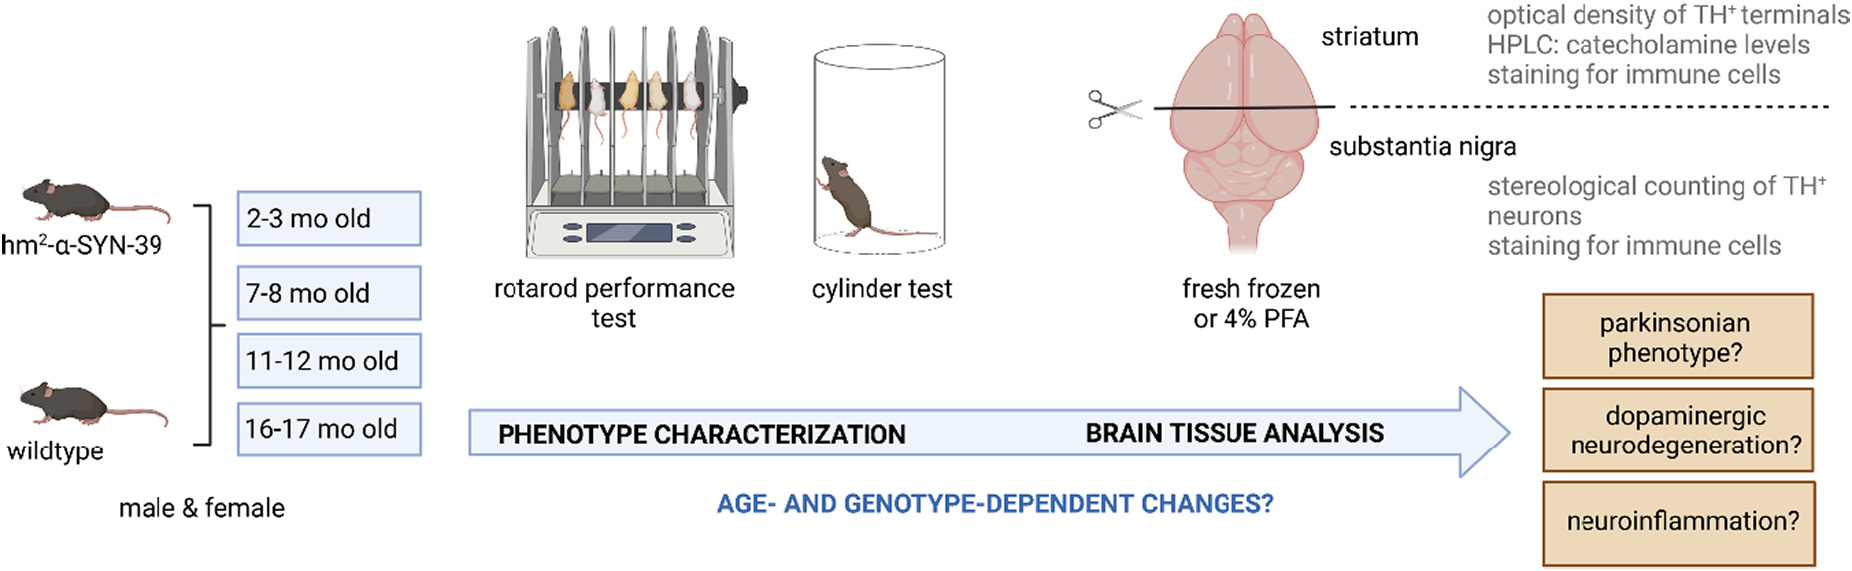
Visualization of the workflow. Male and female hm2α-SYN-39 and wt mice, aged 2–3 months, 7–8 months, 11–12 months and 16–17 months, were behaviorally characterized with a rotarod performance test and a cylinder test. For the brain tissue analysis, the samples were either collected fresh frozen or after fixation with 4% paraformaldehyde (PFA). The brain tissue was analyzed for age- and genotype-dependent changes concerning the dopaminergic system as well as neuroinflammation.
…
3. Results
3.1. Age-dependent impairment of motor performance in hm2α-SYN-39 mice
A characterization of a potential parkinsonian phenotype of tg mice was performed via the rotarod performance test and the cylinder test. The rotarod test revealed a highly significant reduction in the latency to fall in 7–8 (150.40 ± 13.10 s, p < .05), 11–12 (109.30 ± 11.23 s, p < .0001) and 16–17 months old (119.20 ± 11.17 s, p < .0001) hm2α-SYN-39 mice compared to the 2–3 months old (211.60 ± 13.03 s) genetically modified animals (Fig. 2A). This reduction was not seen comparing 2–3 months old wt mice with the different wt age groups. Similarly, the cylinder test showed a significant reduction of total rears in the 16–17 months old (63.45 ± 4.63, p < .05) hm2α-SYN-39 animals compared to the 2–3 months old (89.50 ± 6.85) mice (Fig. 2B). We therefore found an age-dependent impairment of the motor performance in hm2α-SYN-39 mice.
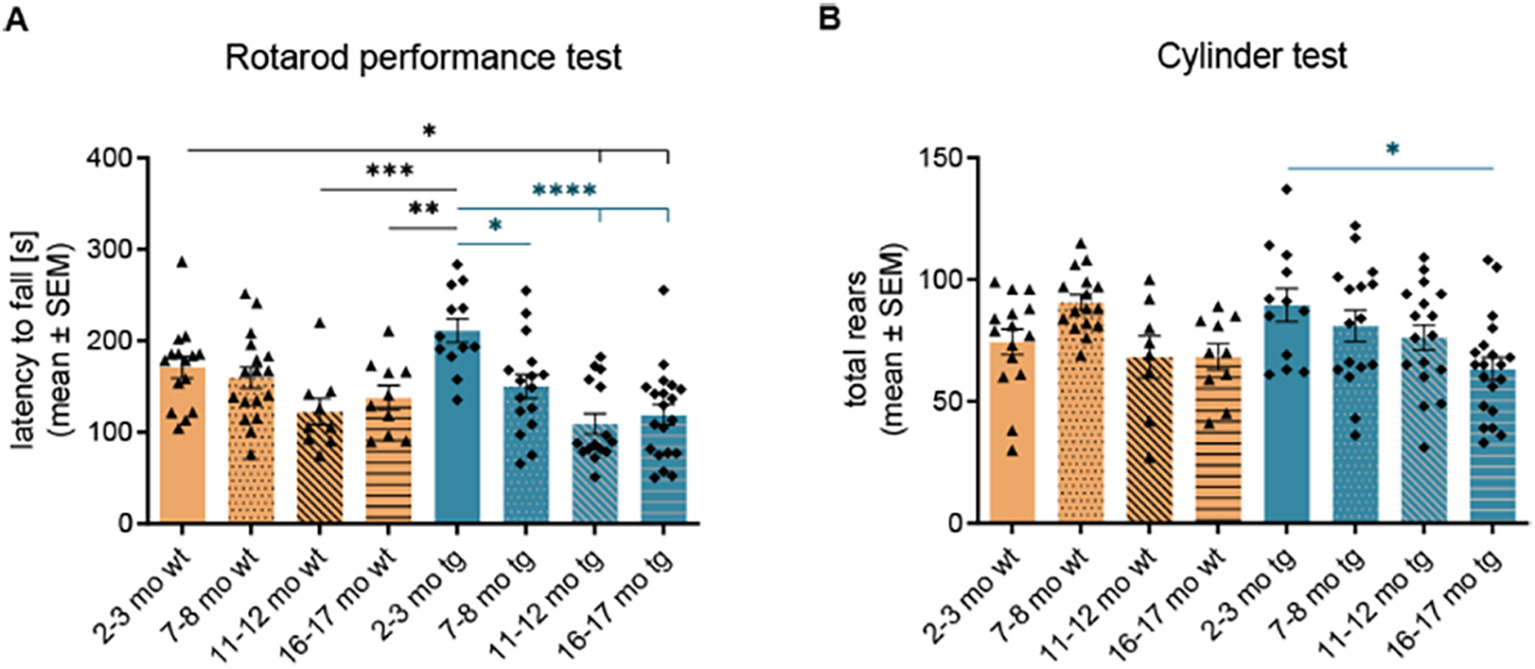
Mild behavioral abnormalities in aging hm2α-SYN-39 mice. (A) The latency to fall (s) was evaluated via a rotarod performance test in wt mice (yellow; 2–3 months: n = 15; 7–8 months: n = 17; 11–12 months: n = 9; 16–17 months: n = 10) and tg mice (blue; 2–3 months: n = 12; 7–8 months: n = 16; 11–12 months: n = 15; 16–17 months: n = 20) (F (7, 106) = 6.79, p < .0001, eta-squared 0.31). (B) The total number of rears were analyzed in a 10-min long cylinder test in wt mice (yellow; 2–3 months: n = 15; 7–8 months: n = 17; 11–12 months: n = 9; 16–17 months: n = 10) and tg mice (blue; 2–3 months: n = 12; 7–8 months: n = 16; 11–12 months: n = 15; 16–17 months: n = 20) (F (7, 106) = 3.35, p < .01, eta-squared 0.18). n indicates the number of biologically-independent animals, mean values for each time point ± SEM are shown. Statistical analysis was done using the one-way ANOVA followed by Tukey’s post-test. *p < .05; **p < .01; ***p < .001; ****p < .0001.
3.2. Neurodegeneration of dopaminergic cells in the SN of hm2α-SYN-39 mice with age
The unbiased stereological analysis of TH+ cells in the SN revealed an age-dependent, significant neurodegeneration of 42.90% in 16–17 months old (4228 ± 497 cells, p < .01) hm2α-SYN-39 mice compared to 16–17 months old (7404 ± 765 cells) wt littermates (Fig. 3A-C). Compared to 2–3 months old (6844 ± 535 cells, p < .05) hm2α-SYN-39 mice a loss of 38.22% TH+ cells can be noted in the old tg mice. While the number of TH+ cells in the hm2α-SYN-39 animals is still unchanged and similar to the wt mice at an age of 7–8 months, a reduction of dopaminergic cells can clearly be documented starting at an age of 11–12 months (tg mice: 5344 ± 348 cells vs wt mice: 7245 ± 690, p = .17). The accompanying loss of striatal dopaminergic terminals was evaluated via a TH+ staining and showed a non-significant reduction in 11–12 months old (0.049 ± 0.01, p = .15) as well as a significant reduction in 16–17 months old (0.047 ± 0.00, p < .05) tg mice compared 2–3 months old (0.067 ± 0.01) tg mice (Fig. 3D, E). This reduction of TH+ OD was not seen in the age-matched wt littermates.
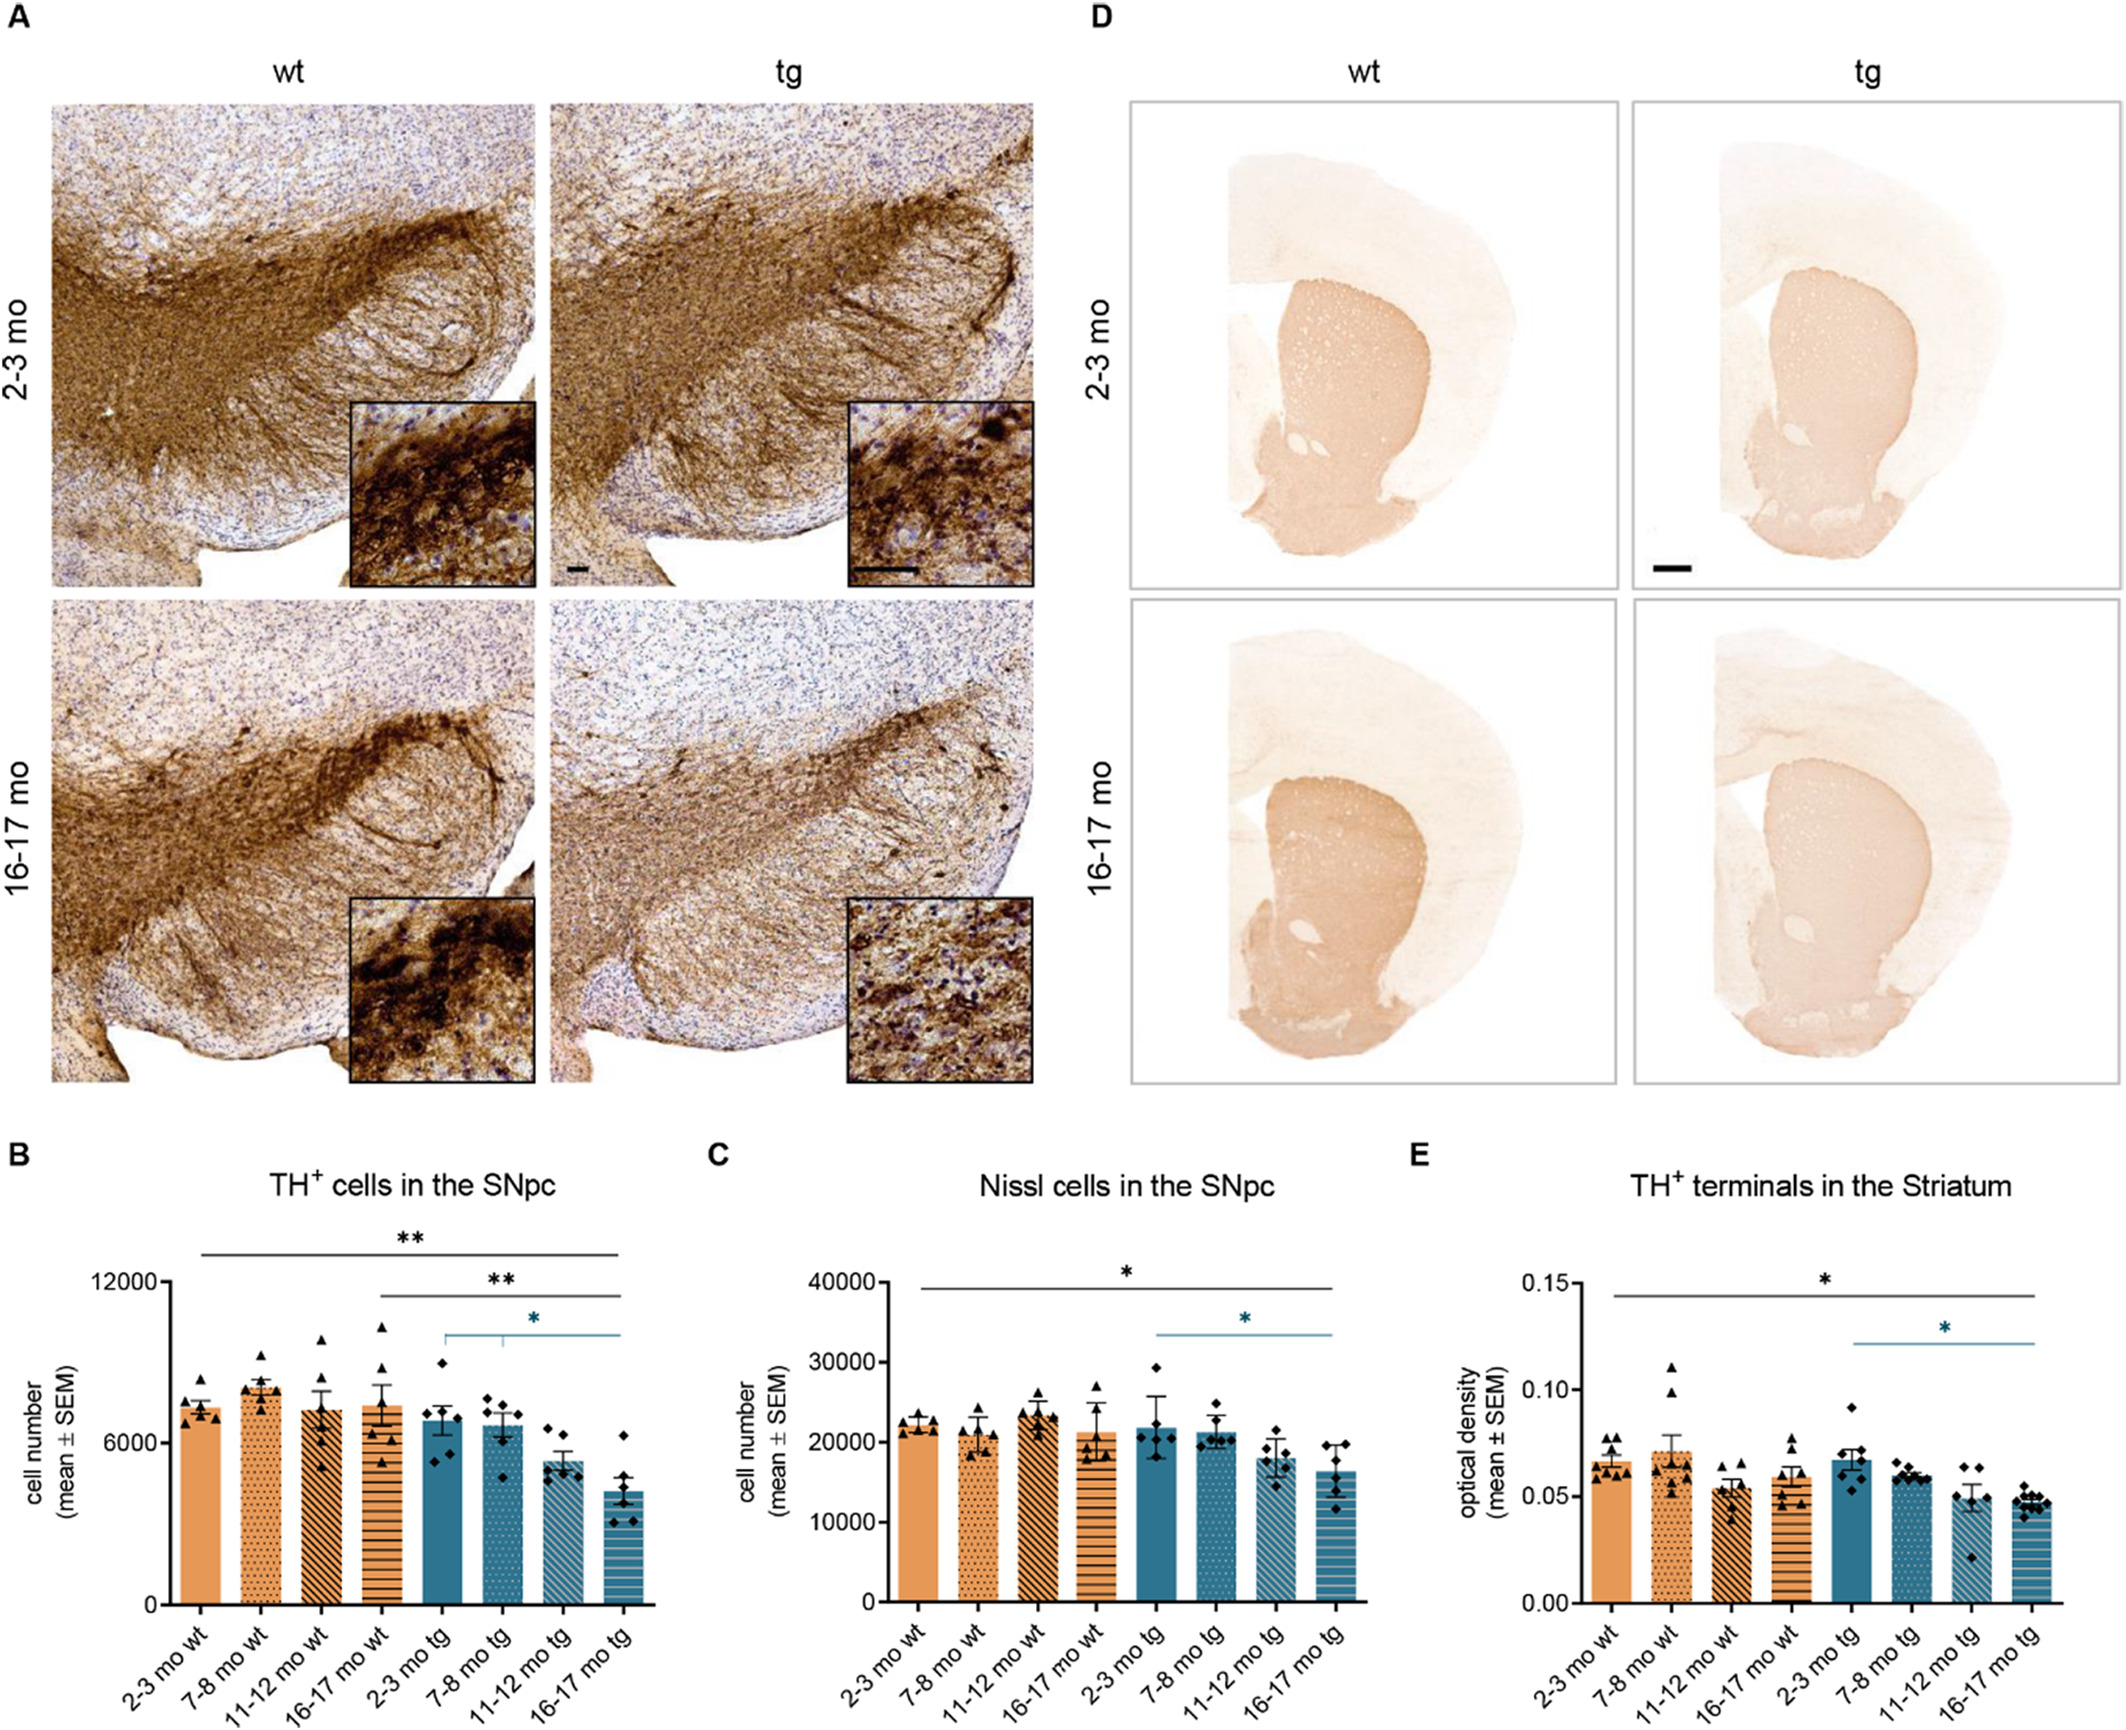
Age-dependent loss of dopaminergic cells in the SN and of dopaminergic terminals in the striatum of hm2α-SYN-39 mice. (A) Exemplary images of TH+ cells in the SN in 2–3 months old and 16–17 months old wt and hm2α-SYN-39 mice. High magnification inserts of single cells are included in each image. The scale bar indicates 50 μm. (B, C) Stereological analysis of the TH+ and Nissl cells in wt mice (yellow; n = 6 for each age group) and in hm2α-SYN-39 mice (blue; n = 6 for each age group) (TH+ cells: F (7, 40) = 6.14, p < .0001, eta-squared 0.52; Nissl cells: F (7, 40) = 4.47, p < .001, eta-squared 0.44). (D, E) Exemplary images and evaluation of the OD of TH+ staining in the striatum in wt mice (yellow; n = 6 for each age group) and in hm2α-SYN-39 mice (blue; n = 6 for each age group) (F (7, 52) = 4.14, p < .01, eta-squared 0.36). The scale bar indicates 500 μm. n indicates the number of biologically-independent animals, mean values for each time point ± SEM are shown. Statistical analysis was done using the one-way ANOVA followed by Tukey’s post-test. *p < .05; **p < .01; ****p < .0001.
The age-dependent dopaminergic depletion in hm2α-SYN-39 mice was confirmed by a TH+/α-synuclein immunofluorescence double staining (2–3 months old tg mice: 543.70 ± 55.06 cells/mm2 vs 16–17 months old tg mice: 234.40 ± 43.14 cells/mm2, p < .05) (Fig. 4A, B). Interestingly, the human A53T α-synuclein load was significantly reduced in 16–17 months old (64.93 ± 21.25 α-synuclein positive cells/mm2, p < .01) hm2α-SYN-39 mice compared to the younger counterpart (302.90 ± 21.33 α-synuclein positive cells/mm2) (Fig. 4C). This also held true for the ratio of human α-synuclein to TH+ cells (25.67 ± 4.91% vs 57.00 ± 7.37%, p < .05) (Fig. 4D).
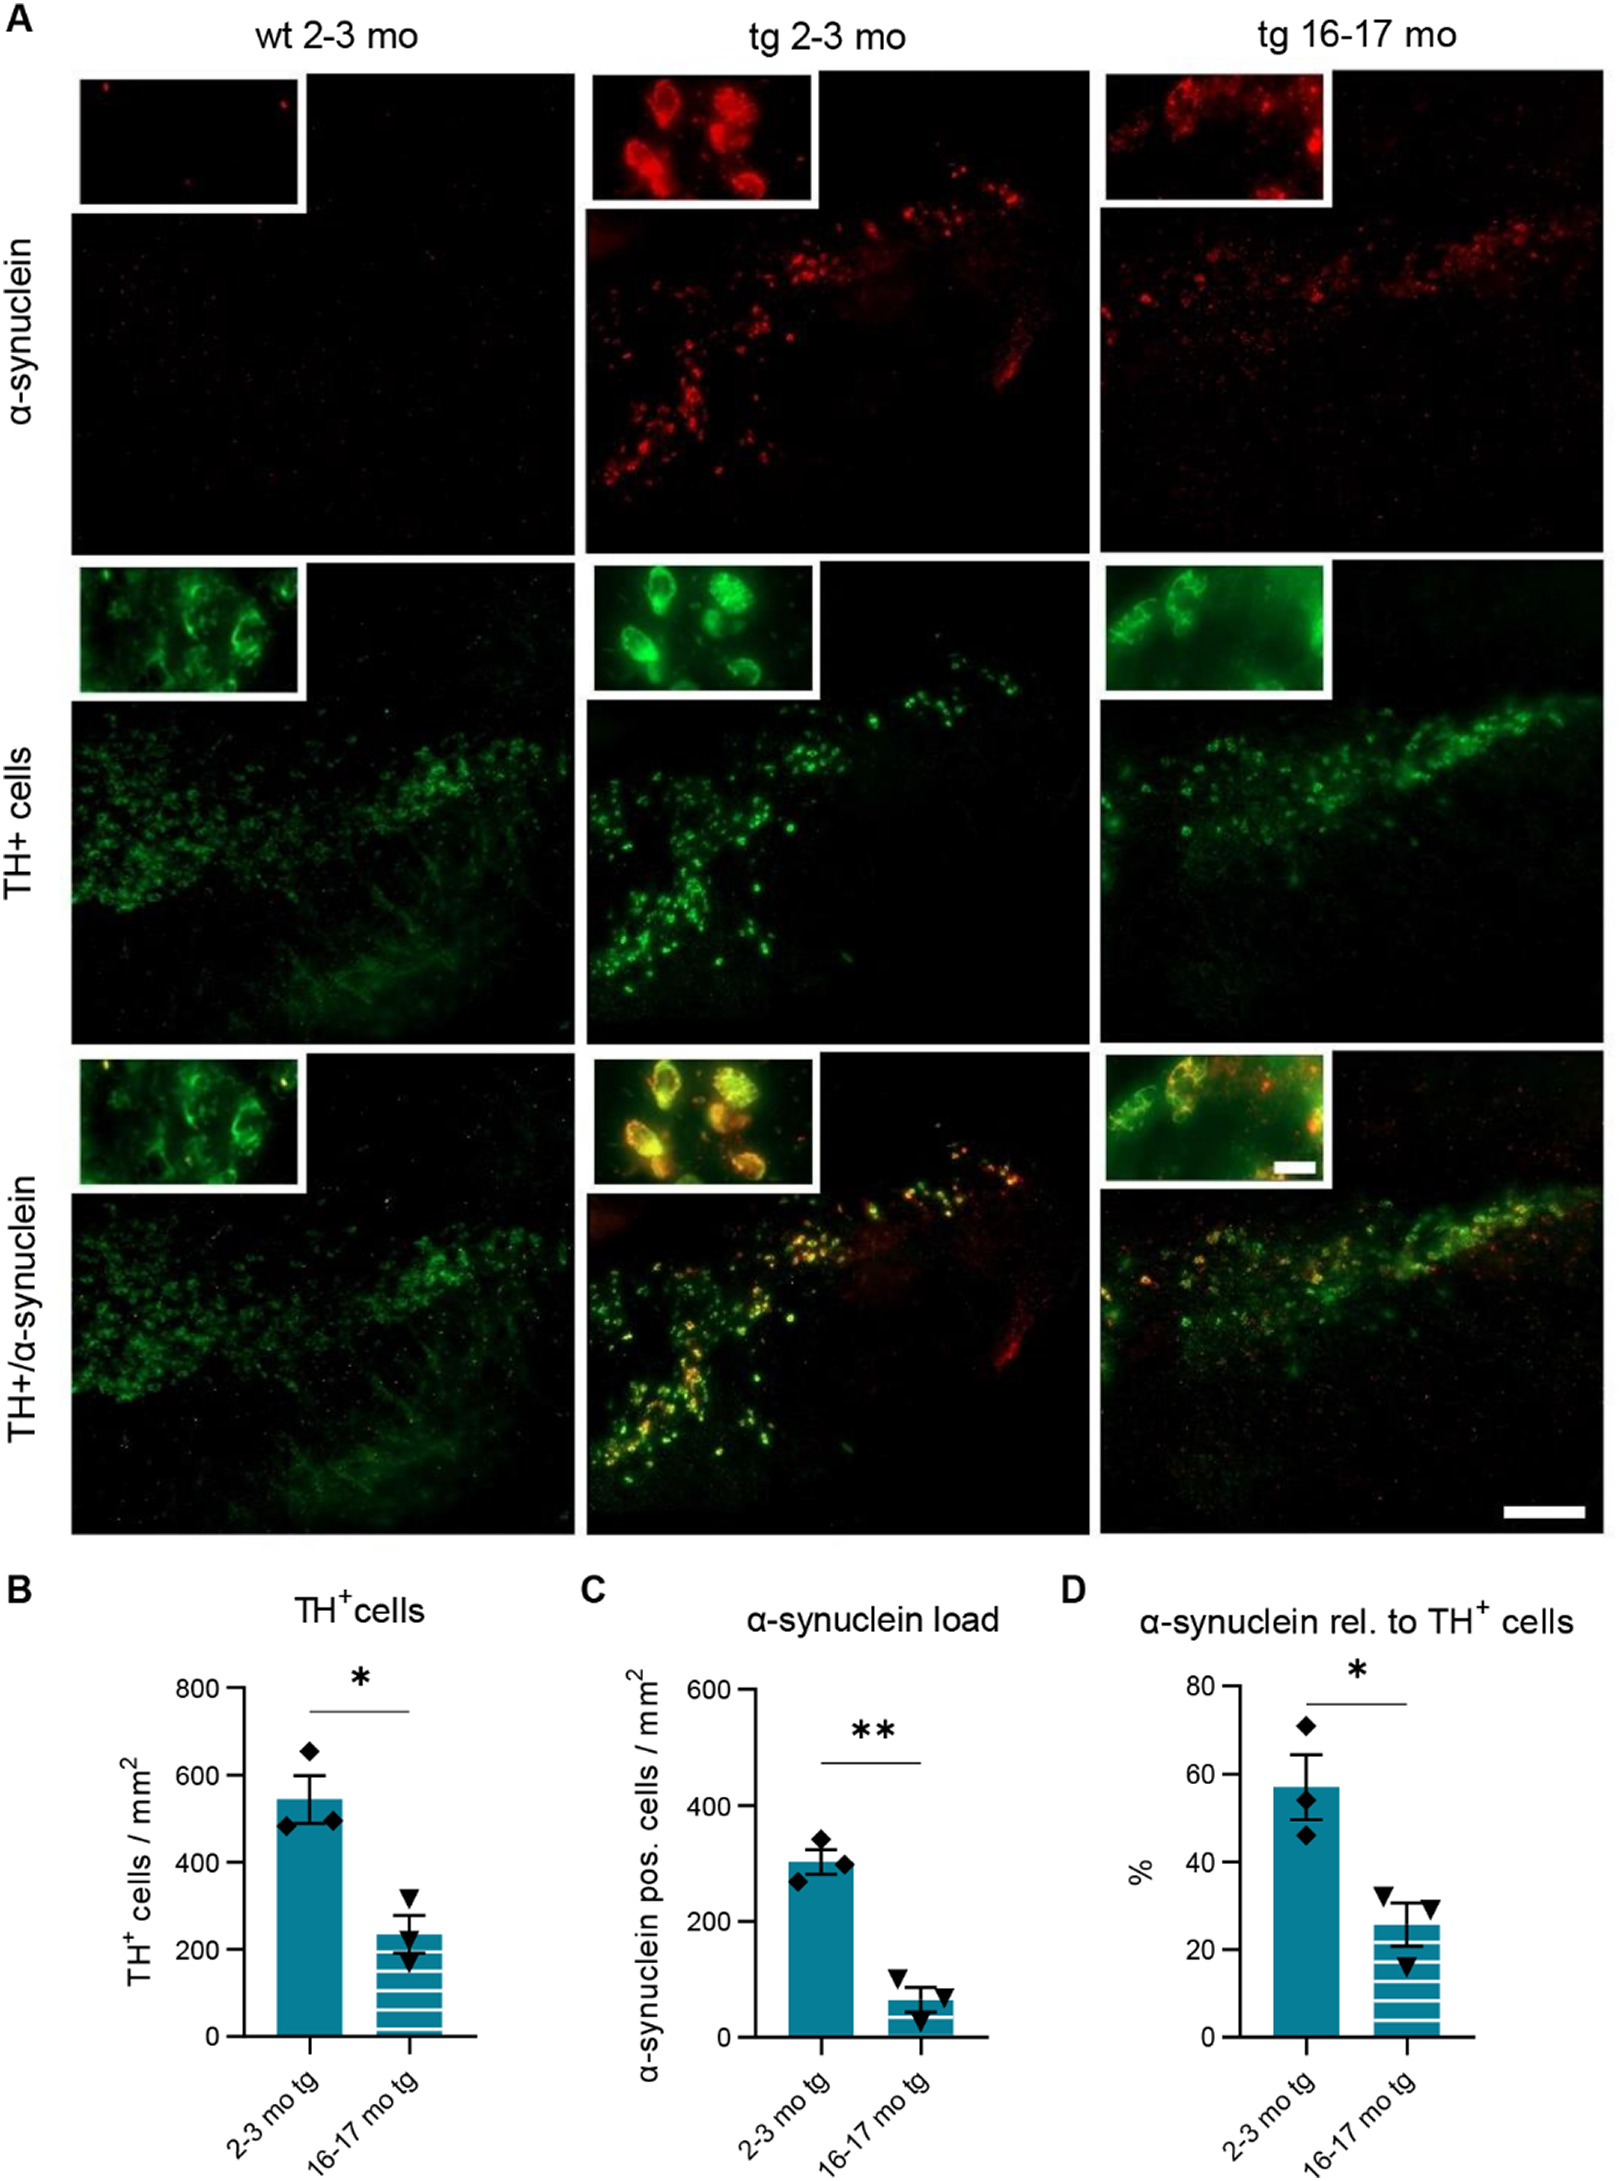
Age-dependent reduction of dopaminergic cells and human A53T α-synuclein in the SNof hm2α-SYN-39 mice. (A) Representative immunofluorescence double stainings showing the expression of human A53T α-synuclein (red) and TH+ dopaminergic neurons (green) in the SN of wt 2–3 months old, tg 2–3 months and tg 16–17 months old mice. The scale bar indicates 250 μm. High magnification inserts of single cells are included in each image with the scale bar indicating 20 μm. (B-D) Number of TH+ cells, the α-synuclein load and the percentage of α-synuclein relative to TH+ cells in young (blue; n = 3) and old (blue and white; n = 3) hm2α-SYN-39 mice. n indicates the number of biologically-independent animals, mean values for each time point ± SEM are shown. Statistical analysis was done using the Mann-Whitney test. *p < .05; **p < .01.
HPLC-analysis of the striatal dopaminergic system revealed a significant reduction of the DA levels in the hm2α-SYN-39 mice aged 16–17 months (0.74 ± 0.05) compared to both young (1.00 ± 0.05, p < .01) and old (0.97 ± 0.05, p < .05) wt control groups (Fig. 5A). The dopaminergic metabolite HVA was significantly reduced in 16–17 months old (0.65 ± 0.05, p < .05) tg animals compared to age-matched (0.90 ± 0.07) wt animals (Fig. 5B), while DOPAC levels in aged (0.74 ± 0.05, p < .01) hm2α-SYN-39 mice were only decreased compared to young wt mice (1.00 ± 0.06) (Fig. 5C). Aside from the dopaminergic system, the neurotransmitter NA was found to be strongly reduced in 16–17 months old (0.48 ± 0.05, p < .001) tg animals with a highly significant reduction of levels compared to 2–3 months old (1.00 ± 0.10) wt littermates (Fig. 5D). Changes were also found in the serotonergic system with levels of 5-HT being significantly reduced in 16–17 months old (0.64 ± 0.05, p < .05) hm2α-SYN-39 mice compared to 2–3 (1.0 ± 0.09) and 16–17 months old (1.03 ± 0.08) wt mice (Fig. 5E). The main metabolite of 5-HT, 5-HIAA, did not yield any significant differences comparing all groups (Fig. 5F).
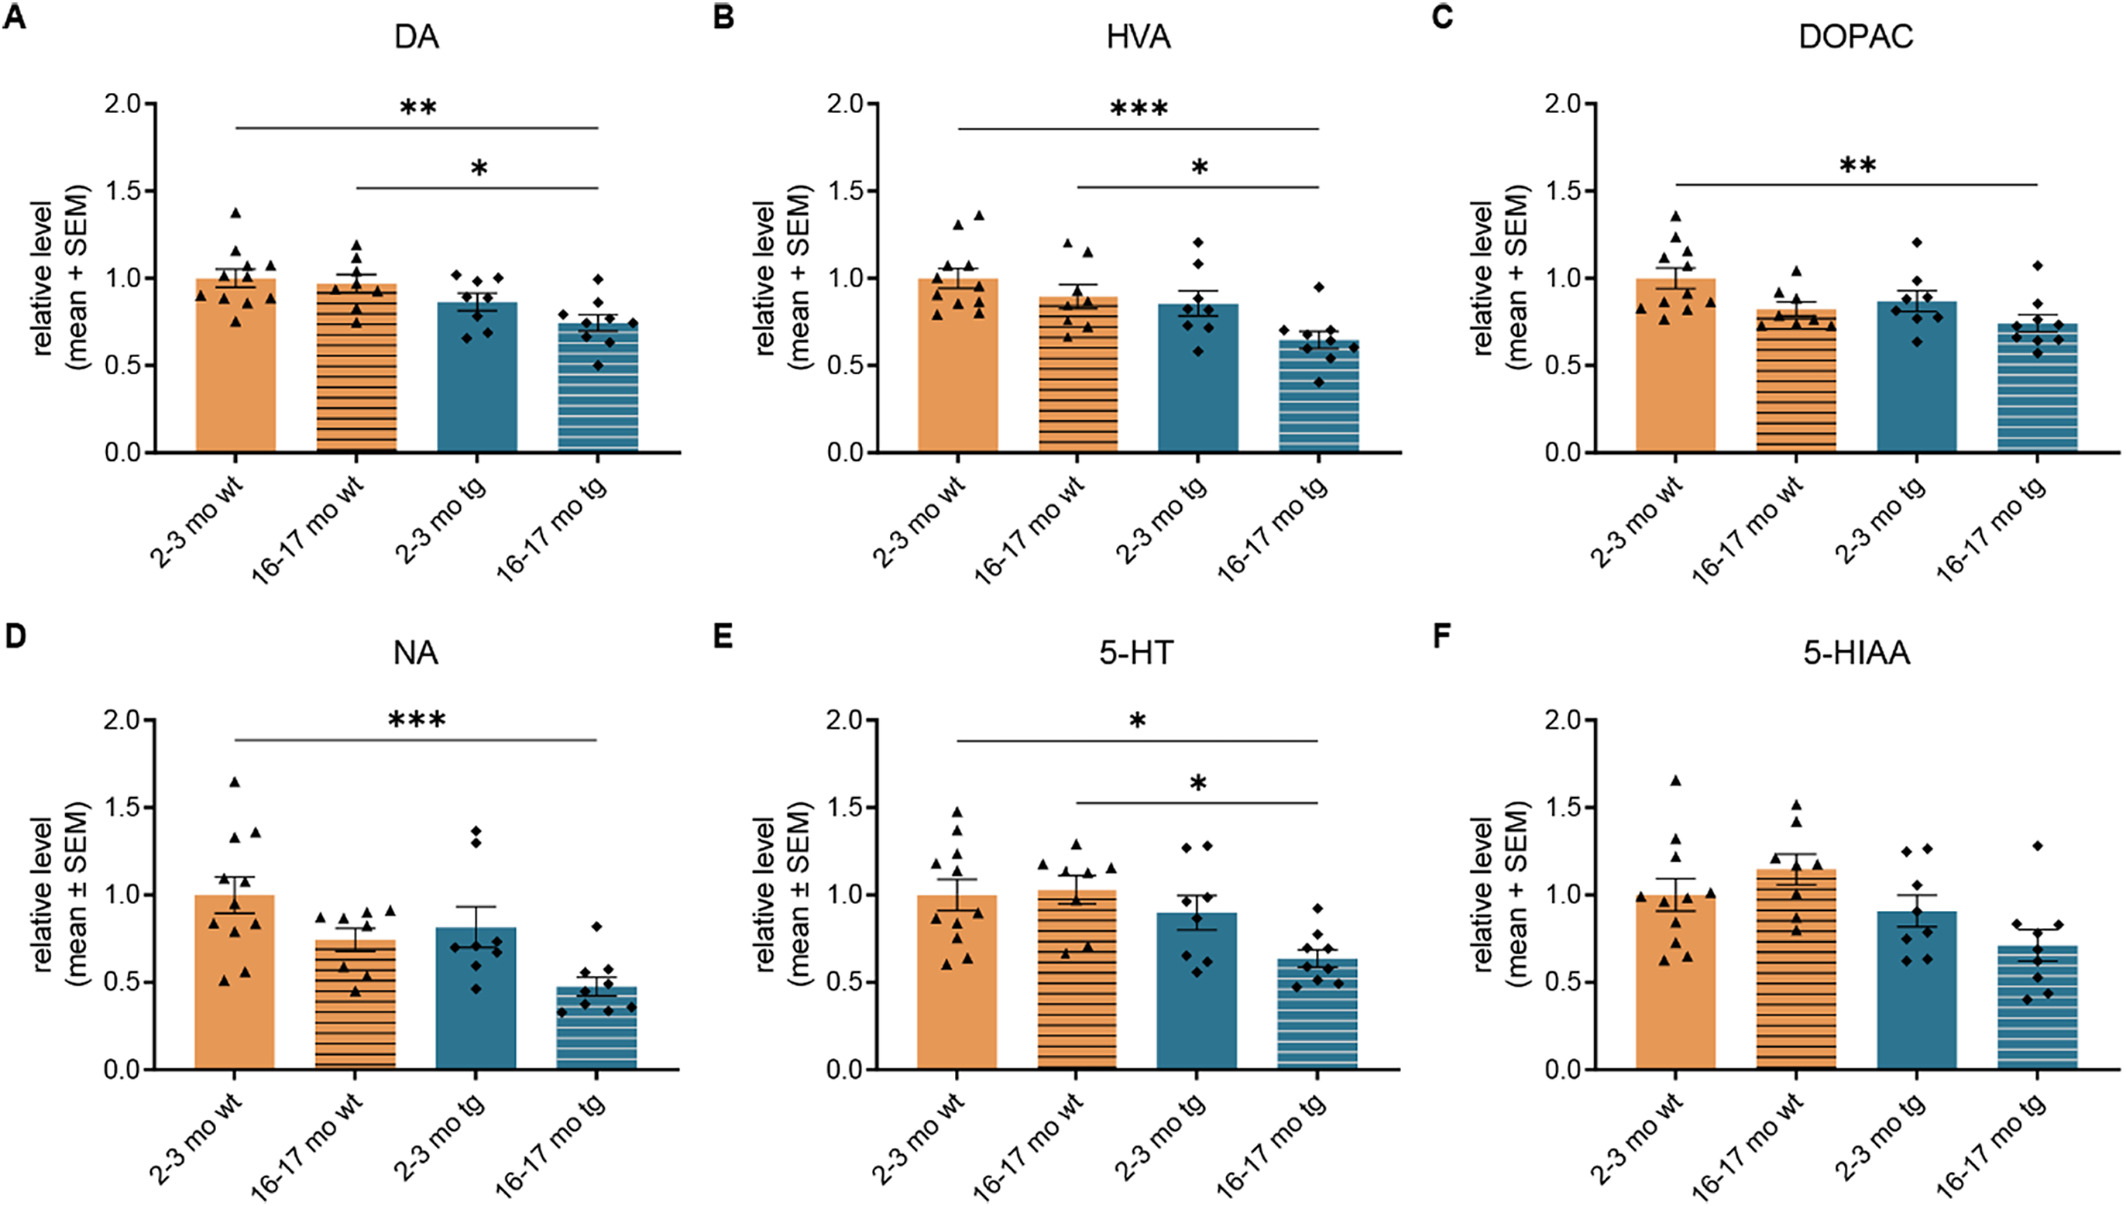
HPLC-analysis of the levels of striatal NA, DA, 5-HT and the respective metabolites in hm2α-SYN-39 and wt mice. (A-C) Levels of DA, HVA and DOPAC in the striatum of wt mice (yellow; 2–3 months: n = 11; 16–17 months: n = 8) and in hm2α-SYN-39 mice (blue; 2–3 months: n = 8; 16–17 months: n = 9) (DA: F (3,32) = 5.43, p < .01, eta-squared 0.34; HVA: F (3, 32) = 6.17, p < .01, eta-squared 0.37; DOPAC: F (3, 32) = 4.34, p < .05, eta-squared 0.29). (D) Levels of NA in the striatum of wt mice (yellow; 2–3 months: n = 11; 16–17 months: n = 8) and in hm2α-SYN-39 mice (blue; 2–3 months: n = 8; 16–17 months: n = 9) (F (3, 32) = 6.12, p < .01, eta-squared 0.36). (E, F) Levels of 5-HT and its metabolite 5-HIAA in the striatum of wt mice (yellow; 2–3 months: n = 11; 16–17 months: n = 8) and in hm2α-SYN-39 mice (blue; 2–3 months: n = 8; 16–17 months: n = 9) (5-HT: F (3, 32) = 4.70, p < .01, eta-squared 0.31; 5-HIAA: F (3, 32) = 3.81, p < .05, eta-squared 0.26). n indicates the number of biologically-independent animals, mean values for each time point ± SEM are shown. Statistical analysis was done using the one-way ANOVA followed by Tukey’s post-test. *p < .05; **p < .01; ***p < .001.
3.3. Age-dependent infiltration of T cells in the SN and striatum of hm2α-SYN-39 mice
Examination of T cells in the SN did not yield any significant differences for CD4+T cell numbers in both hm2α-SYN-39 and wt mice (Fig. 6A, B). In contrast, a pronounced elevation of CD8+ T cells in the SN with progressive age was observed in hm2α-SYN-39 mice but not in wt animals (16–17 months old tg mice: 3.61 ± 0.62 cells/mm2 vs 2–3 months old tg mice: 1.28 ± 0.38 cells/mm2, p < .01 and vs 7–8 months old tg mice: 0.77 ± 0.24 cells/mm2, p < .001) (Fig. 6C, D).
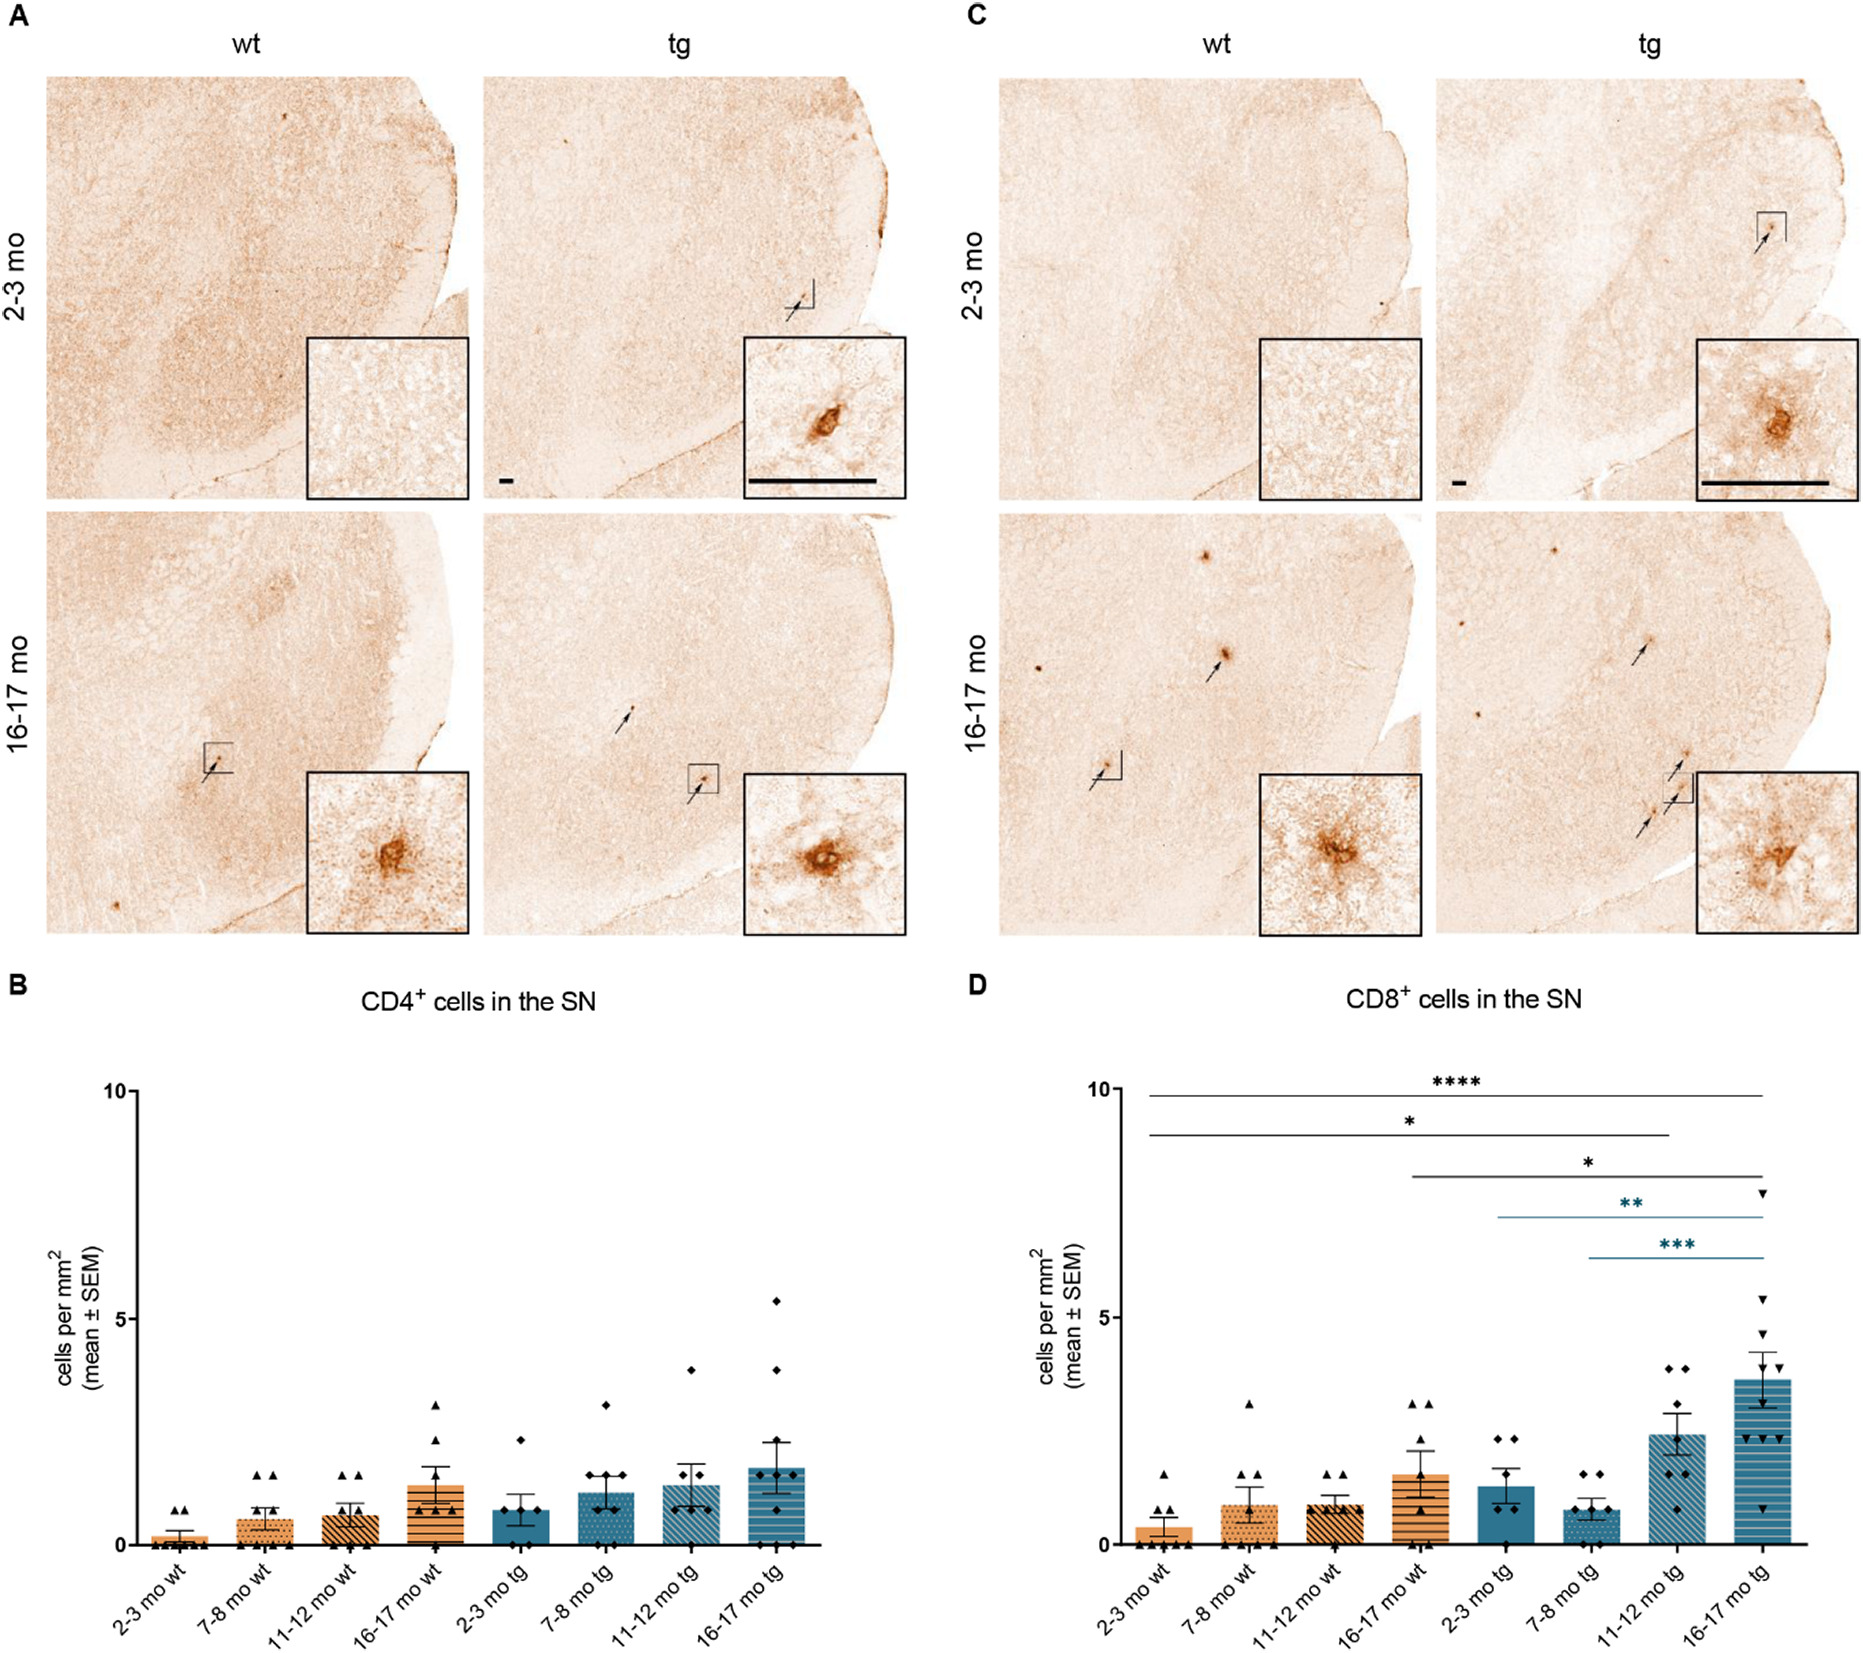
Age-dependent increase of CD4+ and CD8+ T cells in the SN of hm2α-SYN-39 mice. (A) Exemplary images of CD4+ cells in the SN of 2–3 months old and 16–17 months old wt and hm2α-SYN-39 mice. High magnification inserts of single cells are included in each image. The scale bar indicates 50 μm. (B) Analysis of CD4+ cells in wt mice (yellow; 2–3 months: n = 8; 7–8 months: n = 8; 11–12 months: n = 7; 16–17 months: n = 7) and in hm2α-SYN-39 mice (blue; 2–3 months: n = 6; 7–8 months: n = 8; 11–12 months: n = 7; 16–17 months: n = 10) (F (7,53) = 1.74, p = .12, eta-squared 0.19). (C, D) Exemplary images and analysis of CD8+ cells in the SN of wt mice (yellow; 2–3 months: n = 8; 7–8 months: n = 8; 11–12 months: n = 7; 16–17 months: n = 7) and of hm2α-SYN-39 mice (blue; 2–3 months: n = 6; 7–8 months: n = 7; 11–12 months: n = 7; 16–17 months: n = 10) (F (7,52) = 7.11, p < .0001, eta-squared 0.49). n indicates the number of biologically-independent animals, mean values for each time point ± SEM are shown. Statistical analysis was done using the one-way ANOVA followed by Tukey’s post-test. *p < .05; **p < .01; ***p < .001; ****p < .0001.
The analysis of T cell infiltration into the striatum revealed an increase of CD4+ T cells in 16–17 months old (0.49 ± 0.08 cells/mm2, p < .05) hm2α-SYN-39 mice compared to wt littermates of the same age (0.24 ± 0.06 cells/mm2) (Fig. 7A, B). Interestingly, a correlation of the CD4+ cell number with the loss of dopaminergic terminals in the striatum was detected in tg but not in wt mice (Fig. 7C). An even stronger effect was found for the infiltration of CD8+ cells with a highly significant increase in aged (0.95 ± 0.09 cells/mm2) hm2α-SYN-39 mice compared to the 2–3 months old (0.41 ± 0.05 cells/mm2, p < .001) hm2α-SYN-39 animals and wt mice of various age groups (2–3 months old wt mice: 0.23 ± 0.06 cells/mm2, p < .0001; 7–8 months old wt mice: 0.47 ± 0.05 cells/mm2, p < .01; 11–12 months old wt mice: 0.55 ± 0.07 cells/mm2, p < .05) (Fig. 7D, E). Of note, significantly increased CD8+ T cell numbers were also observed comparing 16–17 months (0.65 ± 0.08 cells/mm2, p < .05) with 2–3 months old (0.23 ± 0.06 cells/mm2) wt mice. Again, correlating the CD8+ T cell numbers with the TH+ OD of the striatum, a significant negative correlation was detected for the hm2α-SYN-39 mice, but not the wt cohort (Fig. 7F).
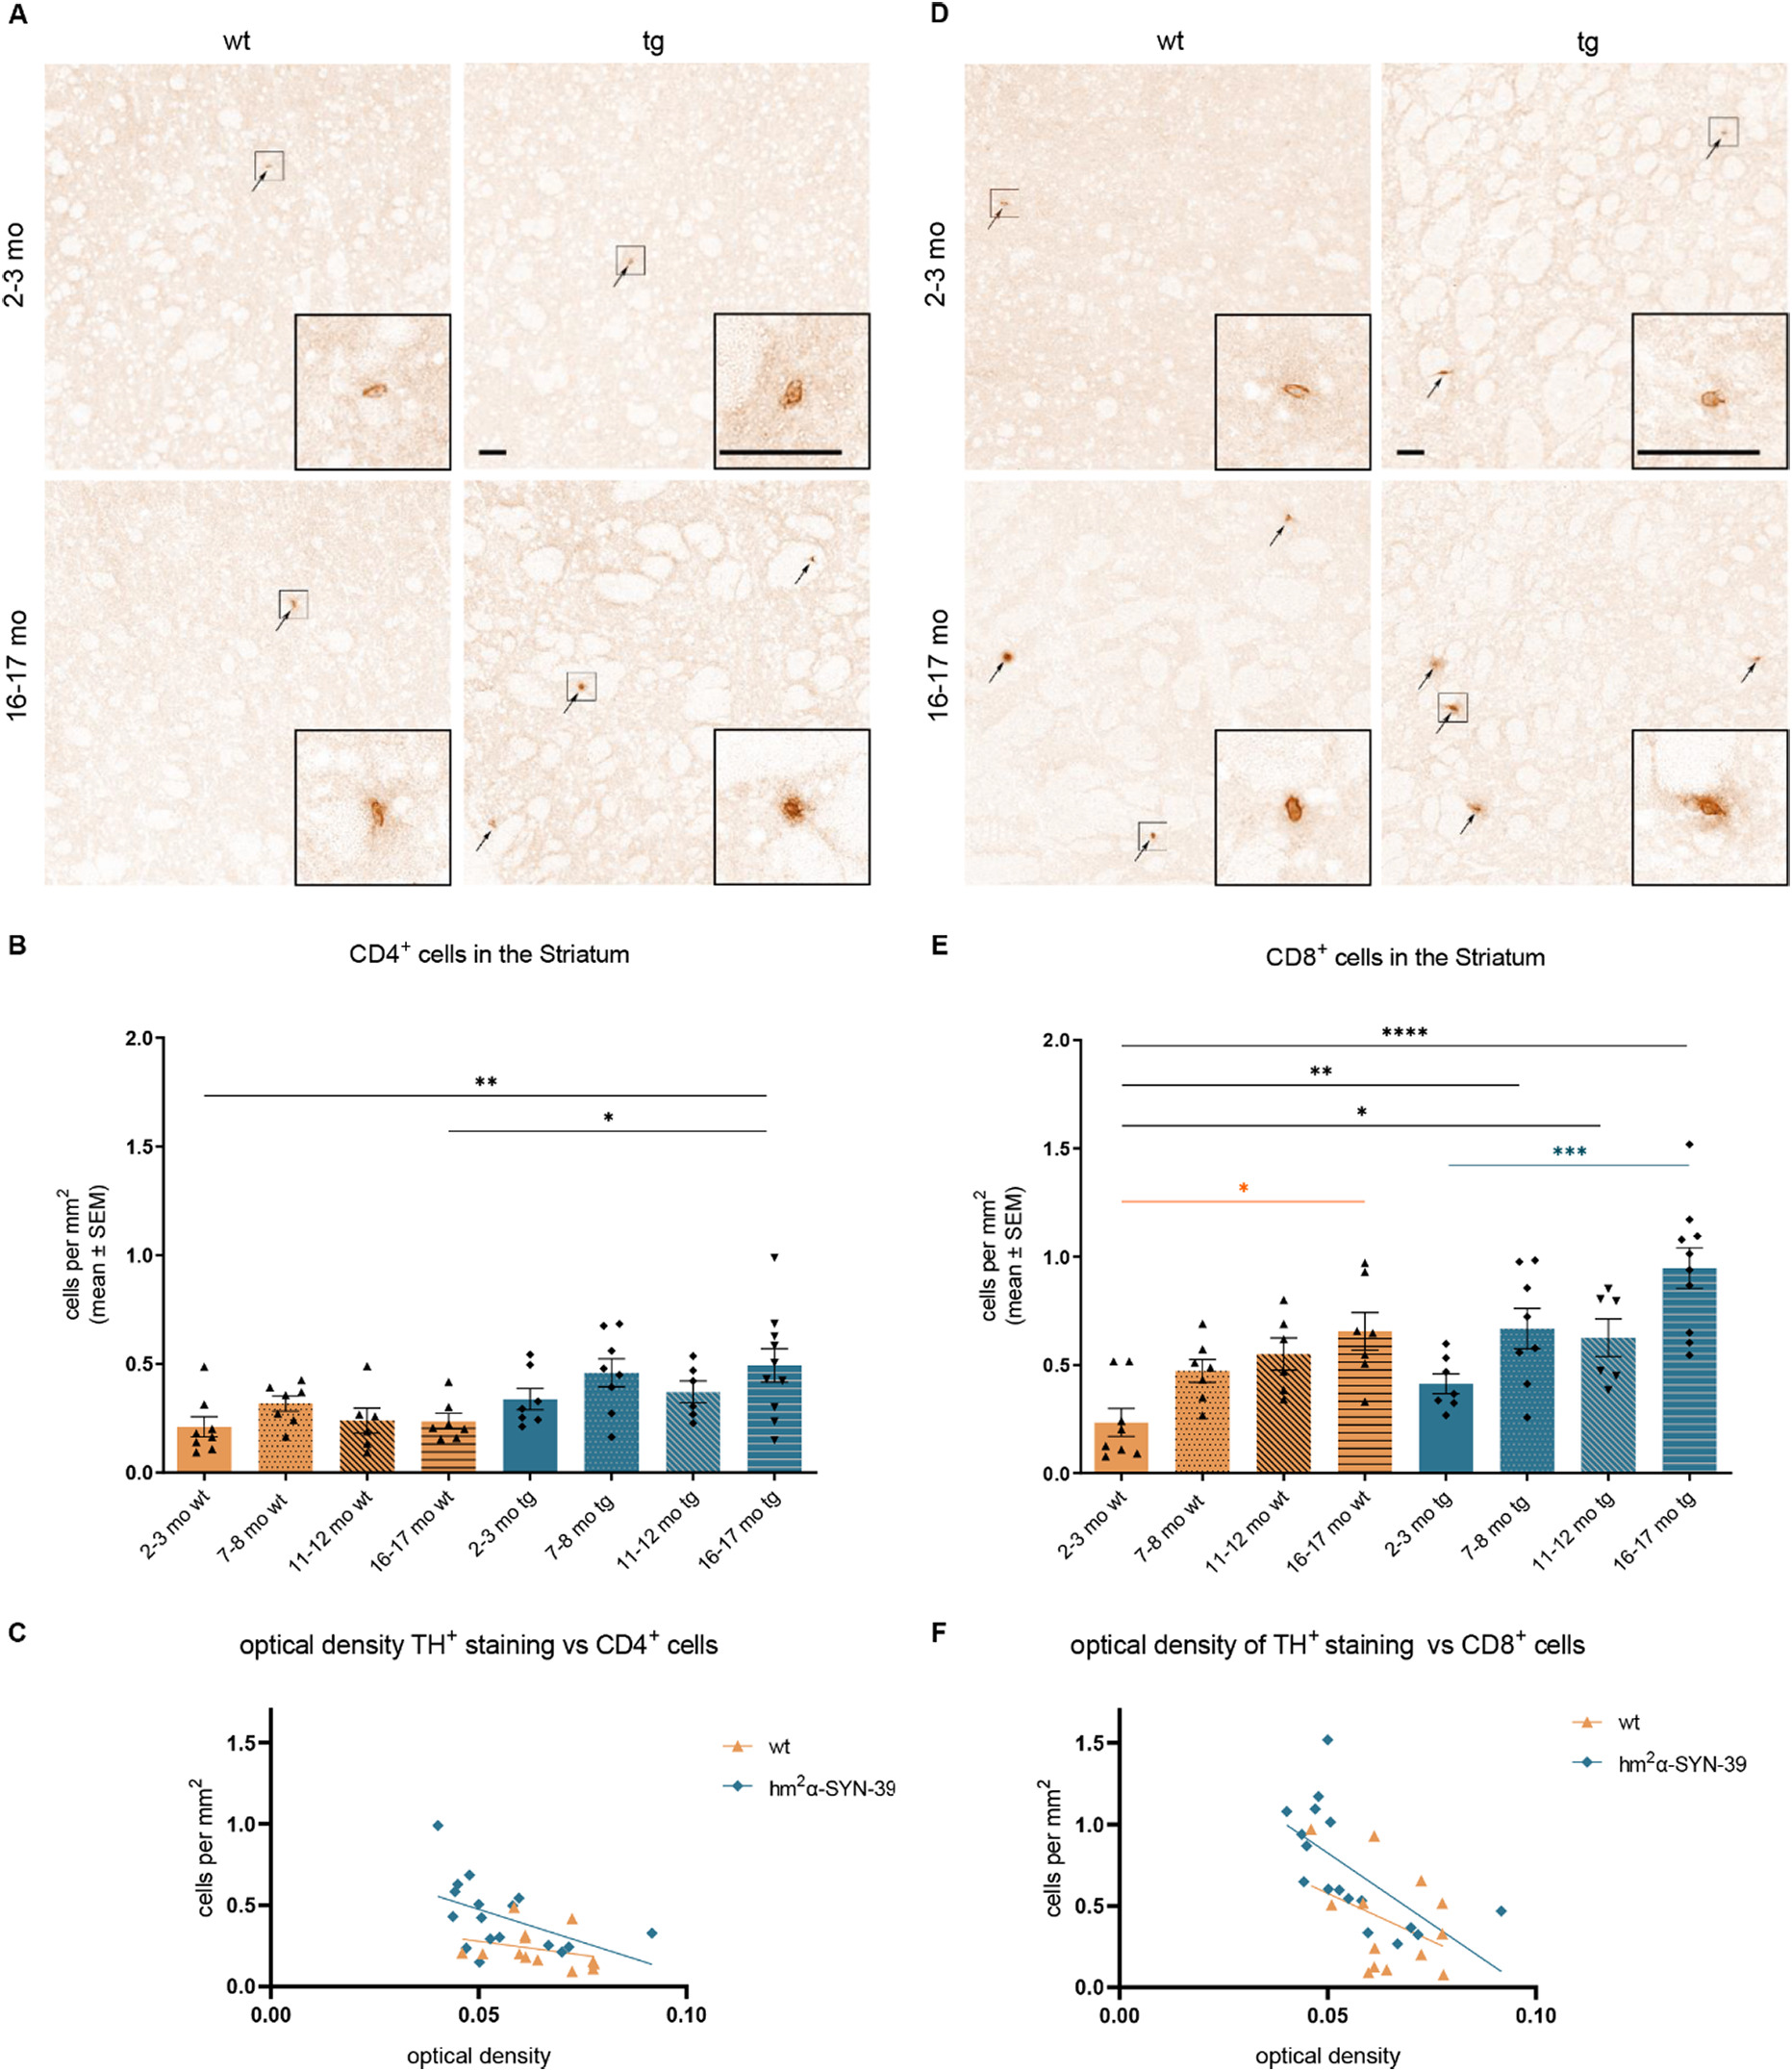
Age-dependent increase of CD4+ and CD8+ T cells in the striatum of hm2α-SYN-39 mice. (A) Exemplary images of CD4+ cells in the striatum of 2–3 months old and 16–17 months old wt and hm2α-SYN-39 mice. High magnification inserts of single cells are included in each image. The scale bar indicates 50 μm. (B) Analysis of CD4+ cells in wt mice (yellow; 2–3 months: n = 8; 7–8 months: n = 7; 11–12 months: n = 6; 16–17 months: n = 7) and in hm2α-SYN-39 mice (blue; 2–3 months: n = 7; 7–8 months: n = 8; 11–12 months: n = 6; 16–17 months: n = 10) (F (7,51) = 3.59, p < .01, eta-squared 0.33). (C) Correlation of the CD4+ cell number with the striatal dopaminergic denervation in 2–3 months old and 16–17 months old wt and hm2α-SYN-39 mice. For the hm2α-SYN-39 mice, a significant negative correlation of OD with CD4+cells can be detected (wt: p = .332, r = −0.292; hm2α-SYN-39: p < .05, r = −0.496). (D, E) Exemplary images and analysis of CD8+ cells in the striatum of wt mice (yellow; 2–3 months: n = 8; 7–8 months: n = 7; 11–12 months: n = 6; 16–17 months: n = 7) and of hm2α-SYN-39 mice (blue; 2–3 months: n = 7; 7–8 months: n = 8; 11–12 months: n = 6; 16–17 months: n = 10) (F (7,51) = 8.12, p < .0001, eta-squared 0.53). High magnification inserts of single cells are included in each image. The scale bar indicates 50 μm. (F) Correlation of the CD8+ cell number with the striatal dopaminergic denervation in 2–3 months old and 16–17 months old wt and hm2α-SYN-39 mice. For the hm2α-SYN-39 mice, a significant negative correlation of OD with CD8+ cells can be detected (wt: p = .188, r = −0.390; hm2α-SYN-39: p < .01, r = −0.638). n indicates the number of biologically-independent animals, mean values for each time point ± SEM are shown. Statistical analysis was done using the one-way ANOVA followed by Tukey’s post-test. *p < .05; **p < .01; ***p < .001; ****p < .0001.
No increase of B cells was found in the SN nor the striatum of wt or hm2α-SYN-39 mice with progressive age (Fig. 8A-D).
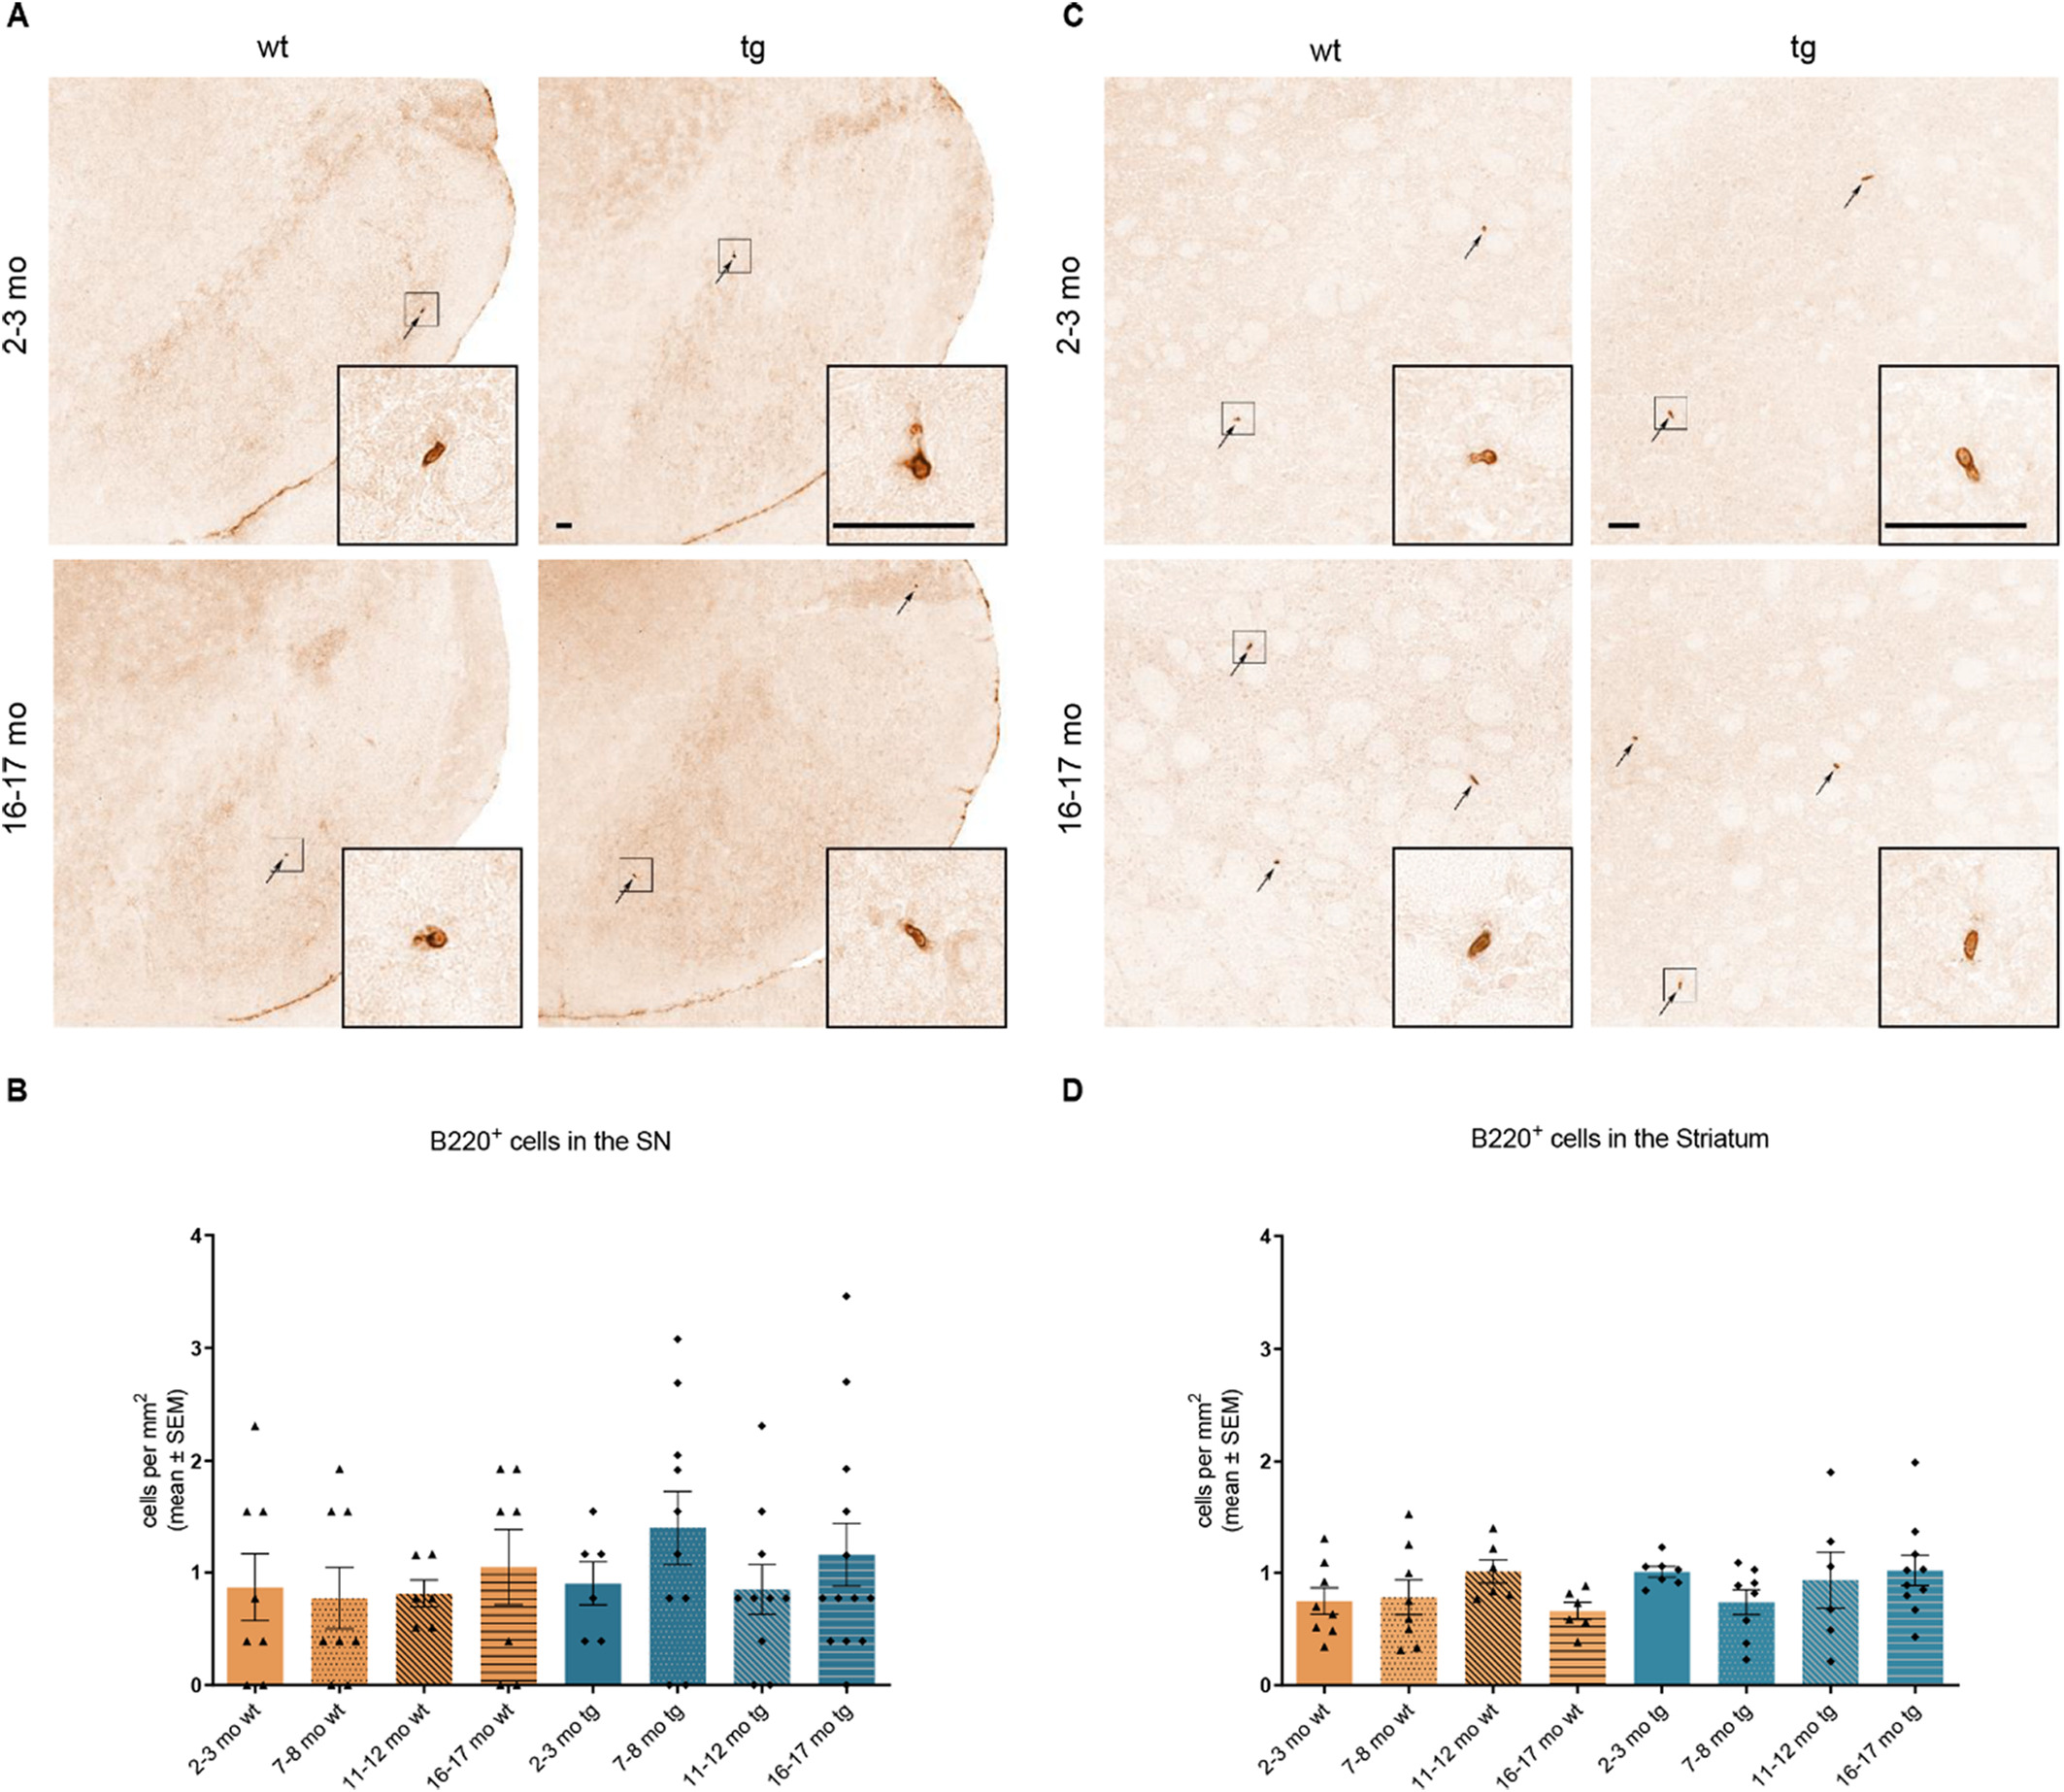
Analysis of B220+ cells in the SN and striatum of wt and of hm2α-SYN-39 mice. (A) Exemplary images of B220+ cells in the SN of 2–3 months old and 16–17 months old wt and hm2α-SYN-39 mice. (B) Analysis of B220+ cells in wt mice (yellow; 2–3 months: n = 8; 7–8 months: n = 8; 11–12 months: n = 6; 16–17 months: n = 7) and in hm2α-SYN-39 mice (blue; 2–3 months: n = 6; 7–8 months: n = 10; 11–12 months: n = 10; 16–17 months: n = 13) (F (7,60) = 0.61, p = .75, eta-squared 0.06). High magnification inserts of single cells are included in each image. The scale bar indicates 50 μm. (C) Exemplary images of B220+ cells in the striatum of 2–3 months old and 16–17 months old wt and hm2α-SYN-39 mice. High magnification inserts of single cells are included in each image. The scale bar indicates 50 μm. (D) Analysis of B220+ cells in wt mice (yellow; 2–3 months: n = 8; 7–8 months: n = 8; 11–12 months: n = 6; 16–17 months: n = 6) and in hm2α-SYN-39 mice (blue; 2–3 months: n = 7; 7–8 months: n = 8; 11–12 months: n = 6; 16–17 months: n = 10). n indicates the number of biologically-independent animals, mean values for each time point ± SEM are shown. Statistical analysis was done using the the one-way ANOVA followed by Tukey’s post-test for B and using the Kruskal-Wallis test followed by Dunn’s post-test for D.
3.4. Age-dependent increase of microglia in the SN and striatum of hm2α-SYN-39 mice
In the SN, a highly significant accumulation of CD11b+ microglia was observed in hm2α-SYN-39 mice with progressive age (16–17 months old tg mice: 374.00 ± 12.61 cells/mm2 vs 2–3 months old tg mice: 290.20 ± 10.81 cells/mm2, p < .0001 vs 7–8 months old tg mice: 312.50 ± 11.96 cells/mm2, p < .01), but not in the wt groups (Fig. 9A, B). Interestingly, a significantly higher number of microglia could already be documented in the SN of young 2–3 months old (290.20 ± 10.81 cells/mm2, p < .05) hm2α-SYN-39 mice compared to the age-matched (239.30 ± 8.46 cells/mm2) wt mice. As for the CD11b+ microglia in the striatum, a significant increase of cell number was detected in both the wt and the hm2α-SYN-39 groups with increasing age (Fig. 9C, D). However, the total number of microglia was significantly higher in 16–17 months old (332.00 ± 4.12 cells/mm2, p < .001) hm2α-SYN-39 mice compared to the 16–17 months old (299.50 ± 5.90 cells/mm2) wt mice.
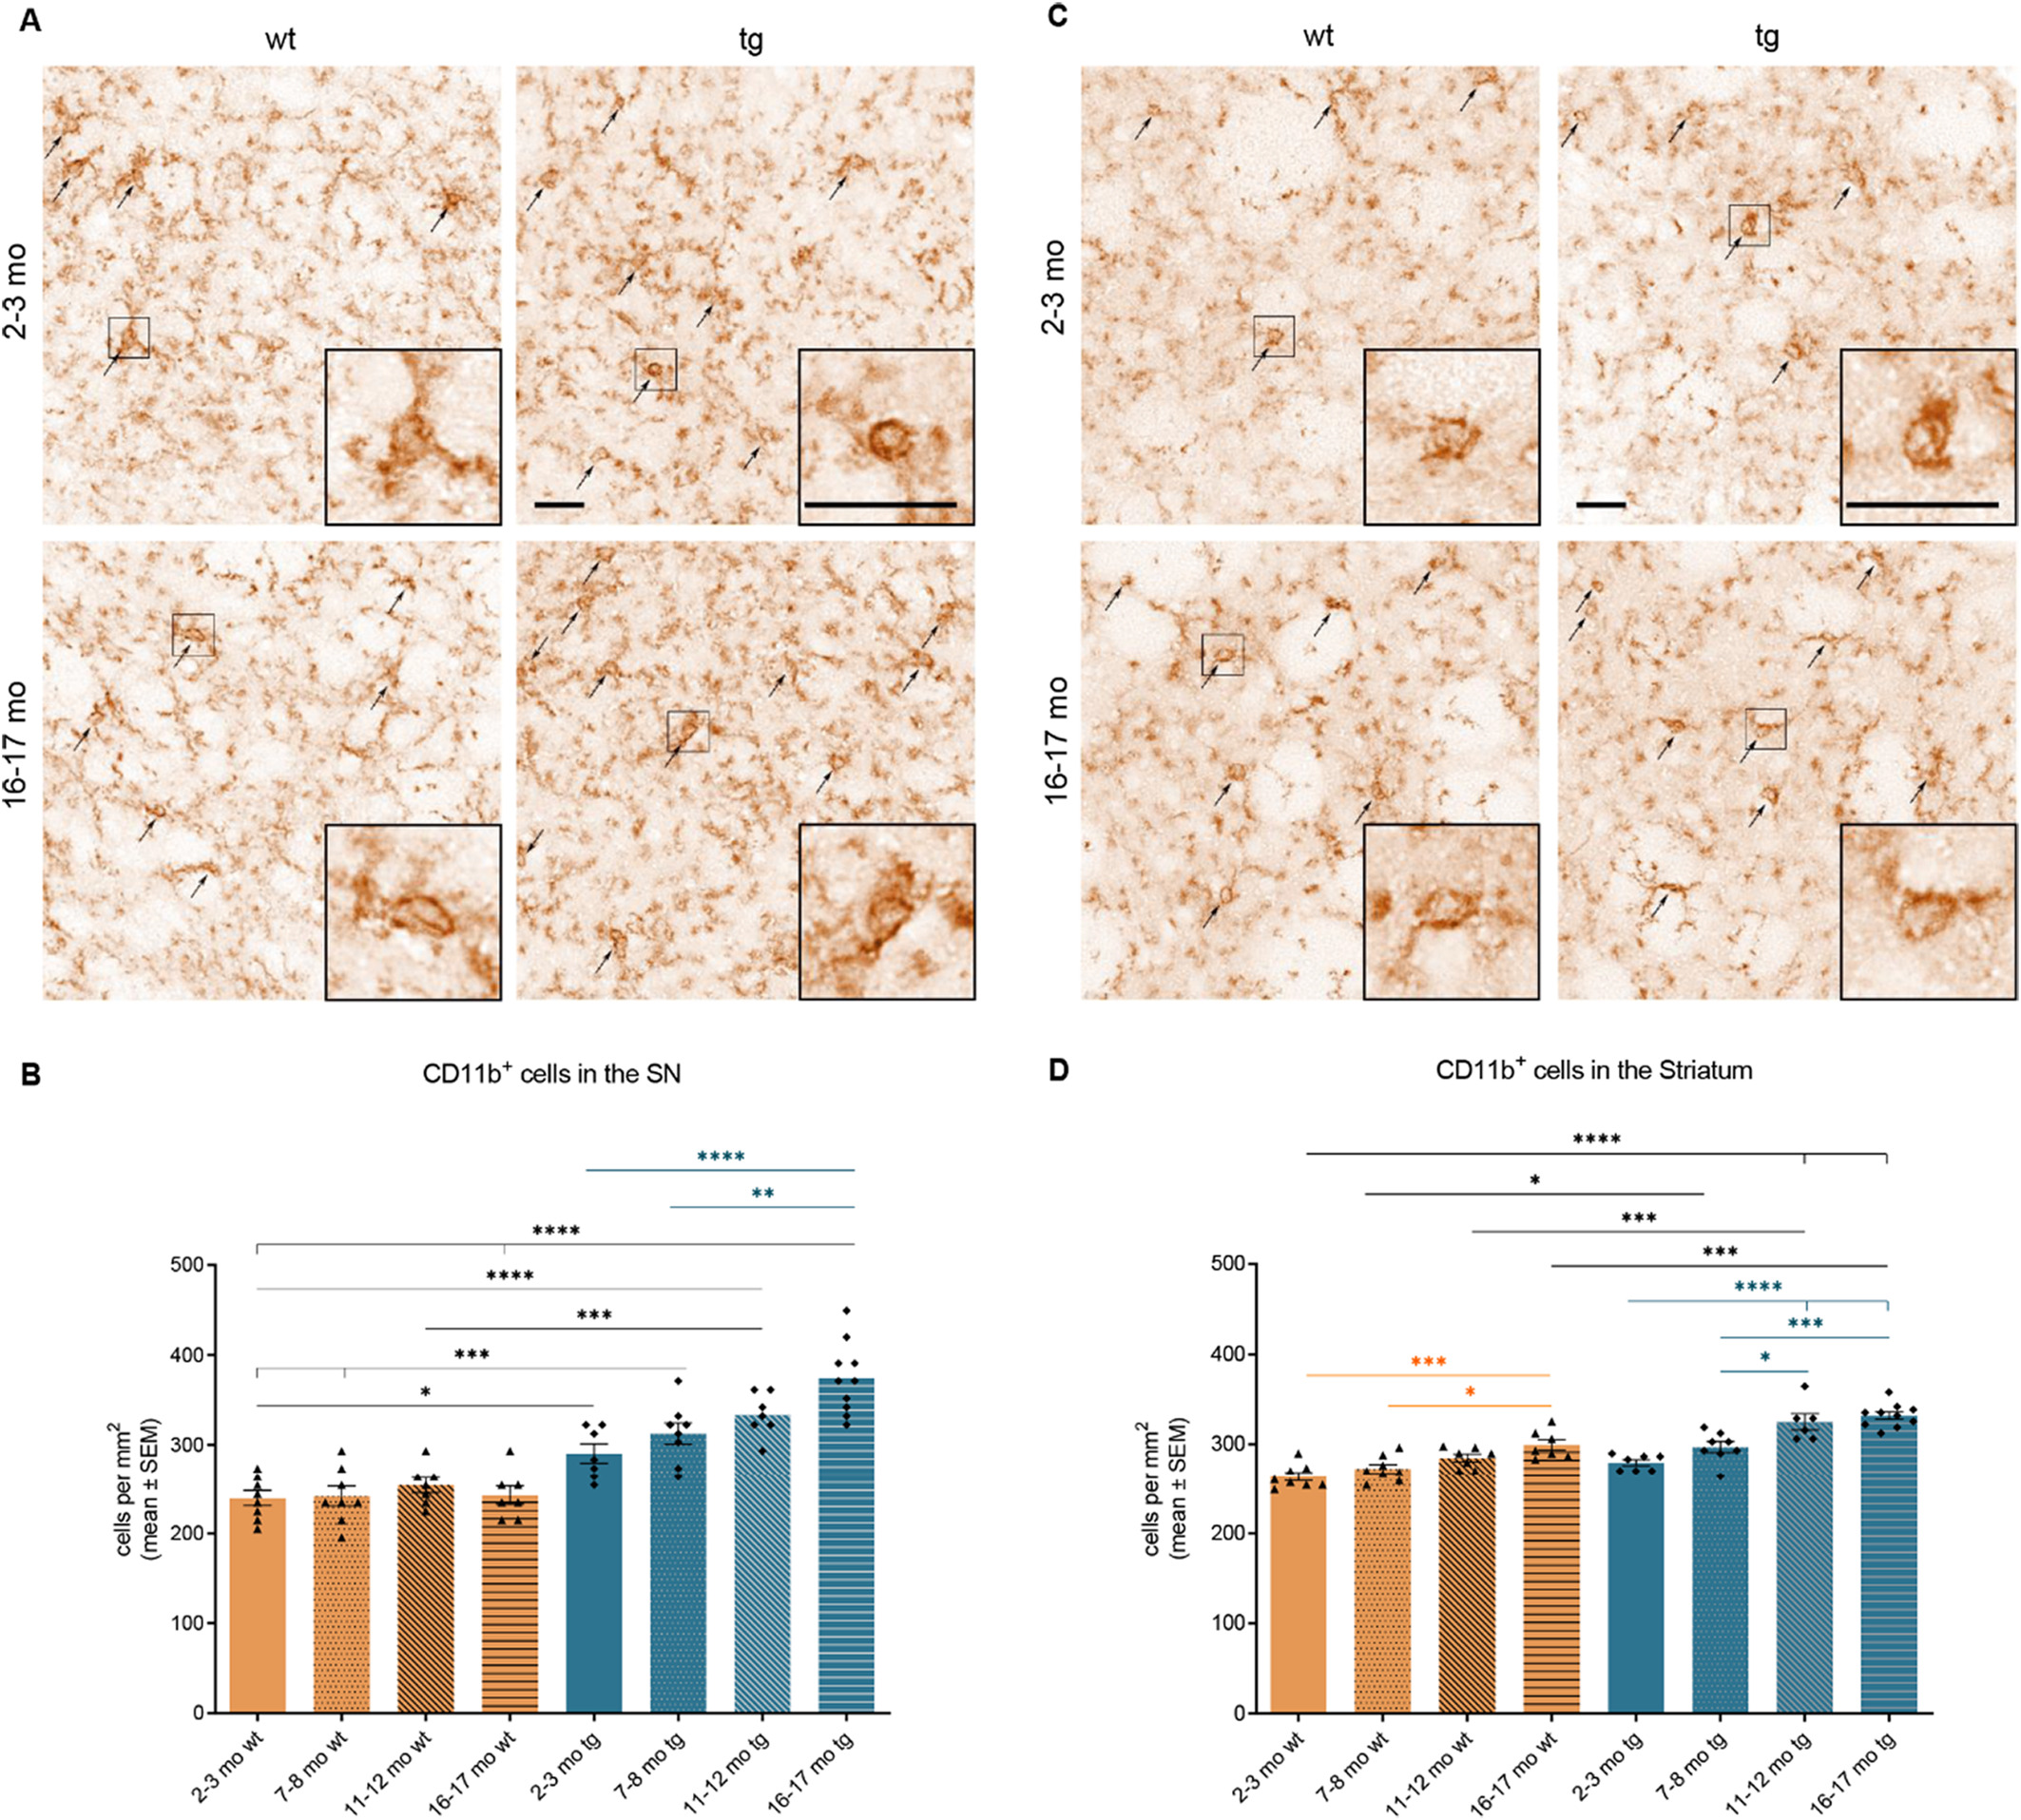
Analysis of CD11b+ microglia in the SN and the striatum of wt and of hm2α-SYN-39 mice. (A) Exemplary images of CD11b+ microglia in the SN of 2–3 months old and 16–17 months old wt and hm2α-SYN-39 mice. High magnification inserts of single cells are included in each image. The scale bar indicates 25 μm. (B) Analysis of CD11b+ microglia in wt mice (yellow; 2–3 months: n = 8; 7–8 months: n = 8; 11–12 months: n = 7; 16–17 months: n = 7) and in hm2α-SYN-39 mice (blue; 2–3 months: n = 6; 7–8 months: n = 8; 11–12 months: n = 7; 16–17 months: n = 10) (F (7,54) = 23.86, p < .0001, eta-squared 0.76). (C) Exemplary images of CD11b+ microglia in the striatum of 2–3 months old and 16–17 months old wt and hm2α-SYN-39 mice. High magnification inserts of single cells are included in each image. The scale bar indicates 25 μm. (D) Analysis of CD11b+ microglia in wt mice (yellow; 2–3 months: n = 8; 7–8 months: n = 8; 11–12 months: n = 7; 16–17 months: n = 7) and in hm2α-SYN-39 mice (blue; 2–3 months: n = 7; 7–8 months: n = 8; 11–12 months: n = 6; 16–17 months: n = 10) (F (7,53) = 22.52, p < .0001, eta-squared 0.75). n indicates the number of biologically-independent animals, mean values for each time point ± SEM are shown. Statistical analysis was done using the one-way ANOVA followed by Tukey’s post-test. *p < .05; **p < .01; ***p < .001; ****p < .0001.
3.5. Age-dependent increase of reactive astrocytes in the SN of hm2α-SYN-39 mice
A significant rise of reactive astrocyte numbers was found in the SN of aged hm2α-SYN-39 mice compared to their younger counterpart of 2–3 months of age (170.20 ± 13.01% vs 111.20 ± 1,92%, p < .05) as well as compared to young wt mice (100.00 ± 13.88%, p < .01) (Fig. 10A-B). Compared to 16–17 months wt animals, a non-significant increase in reactive astrocytes could be registered.
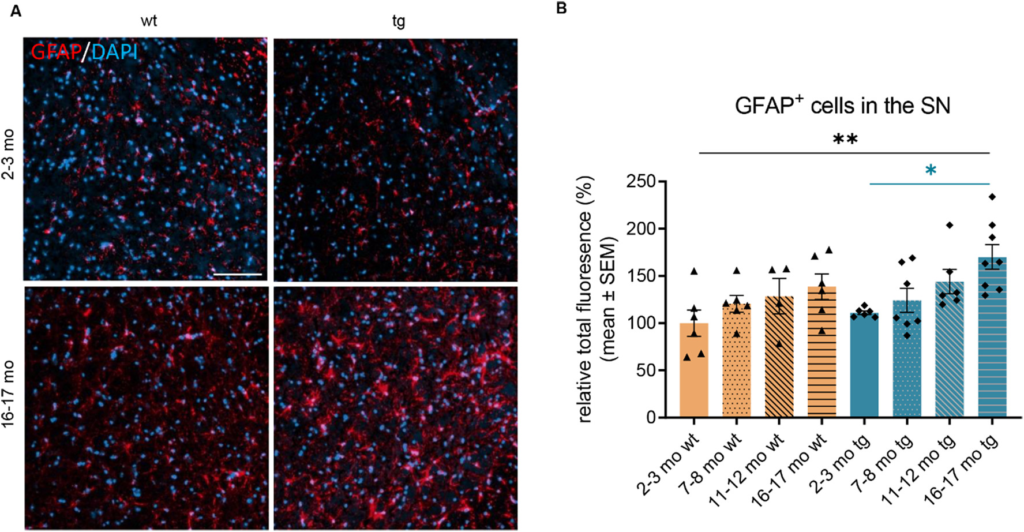
Analysis of GFAP+ astrocytes in the SN of wt and of hm2α-SYN-39 mice. (A) Exemplary images of GFAP+ astrocytes in the SN of 2–3 months old and 16–17 months old wt and hm2α-SYN-39 mice. The scale bar indicates 100 μm. (B) Analysis of the mean fluorescence-signal intensity of GFAP+ astrocytes in wt mice (yellow; 2–3 months: n = 5; 7–8 months: n = 6; 11–12 months: n = 4; 16–17 months: n = 6) and in hm2α-SYN-39 mice (blue; 2–3 months: n = 6; 7–8 months: n = 7; 11–12 months: n = 6; 16–17 months: n = 8) (F (7,41) = 3.41, p < .01, eta-squared 0.37). The fluorescence signal-intensities were normalized to the mean fluorescence-signal intensity found in 2–3 months old wt mice. n indicates the number of biologically-independent animals, mean values for each time point ± SEM are shown. Statistical analysis was done using the one-way ANOVA followed by Tukey’s post-test. *p < .05; **p < .01.
4. Discussion
The neuronal cell death characteristic for PD has been associated with multiple cellular and molecular mechanisms such as mitochondrial dysfunction, oxidative stress and proteasomal abnormalities (McNaught et al., 2001; Abou-Sleiman et al., 2006). Furthermore, increasing evidence points towards neuroinflammatory processes playing a role in PD (Brochard et al., 2009; Harms et al., 2013; Cebrián et al., 2014; Sulzer et al., 2017; Sommer et al., 2018; Galiano-Landeira et al., 2020). These reports come primarily from toxin- or viral vector based animal models as well as postmortem human studies. Neuroinflammation in genetic mouse models for PD has barely been studied and especially longitudinal studies of neuroinflammation in these mouse models are rare. The identification of inflammatory processes in genetic animal models of PD has altogether proven to be challenging. The underlying issue might be that, while genetic animal models of PD have been created with the gene mutations associated with PD in humans such as α-synuclein, LRRK2, Parkin and PINK1, these mutations rarely result in a consistent dopaminergic loss as well as a parkinsonian phenotype (Gao et al., 2011; Sliter et al., 2018). It has even been hypothesized that the introduction of a PD-associated mutation alone may be insufficient to trigger the pathogenesis of PD and that additional environmental factors are needed. Indeed, Gao et al. found that only the induction of neuroinflammation via an injection of inflammogen lipopolysaccharide led to dopaminergic neurodegeneration in mice overexpressing human A53T mutant α-synuclein but not in the wt controls (Gao et al., 2011).
The herein used hm2α-SYN-39 mice show an age-dependent, significant degeneration of dopaminergic cells of the SN by the age of 16–17 months compared to age-matched wt animals. TH staining of the striatum showed a significant, age-dependent reduction of dopaminergic terminals in the old hm2α-SYN-39 group as well. HPLC-analysis confirmed the mild, but significant reduction of DA in the striatum of 16–17 months tg mice compared to age-matched wt littermates. Our findings matched the reductions of striatal DA previously found in 16–18 months old, heterozygous hm2α-SYN-39 mice and in 18 months old, homozygous A30P/A53T mice compared to age-matched wt mice (Richfield et al., 2002; Kilpeläinen et al., 2019). Aside from the dopaminergic system, NA was found to be reduced in 16–17 months old hm2α-SYN-39 mice. It is well known that the noradrenergic system is affected in PD patients (Patt and Gerhard, 1993; Zarow et al., 2003; Vieira et al., 2019). Interestingly, NA has been ascribed a part in neuroinflammatory processes due to its role in mediating the suppression of proinflammatory molecules and the elevation of anti-inflammatory molecules (Song et al., 2019). Evidence has also pointed towards an involvement of the serotonergic system in PD; studies in toxin-based PD animal models as well as postmortem studies of brains of PD patients have shown a decrease of striatal 5-HT levels compared to controls (Fahn et al., 1971; Kish et al., 2008; Vieira et al., 2019). In the present animal model, striatal 5-HT was found to be significantly reduced in the aging tg mice compared to young and old wt animals. Interestingly, the homozygous A30P/A53T mouse model showed no changes of 5-HT in tg mice of 12-months of age, but a significant increase in tg mice of 18-months of age compared to age-matched wt mice (Kilpeläinen et al., 2019). It is well known that the serotonergic and dopaminergic neurotransmitter systems closely interact, making a growing dysregulation of the serotonergic system as a consequence of the DA depletion possible. The discrepant findings between the heterozygous and homozygous A30P/A53T mouse models however require further analyses of the serotonergic system. Behavioral characterization of the genetically mutated animals showed a significant reduction in motor abilities when comparing old to young hm2α-SYN-39 mice. While a dopamine replacement therapy evaluating a potential alleviation of these motor deficits was not performed in our hands, injections of 1.5 mg/kg apomorphine were previously shown to lead to a significant increase in locomotor activity in 22-months old tg mice compared to a saline control dose and compared to wt littermates (Thiruchelvam et al., 2004). On the other hand, it should also be noted that the motor deficits we observed in the 16–17 months old hm2α-SYN-39 animals were not significantly changed compared to the age-matched wt group. The degree of dopaminergic terminal loss at 16–17 months of age might still allow for enough compensatory mechanisms resulting in an almost normal age-adapted behavior of the hm2α-SYN-39 mice. While only a 30% loss of the dopamine neurons in the SN is necessary in humans for symptoms to appear, most studies report a 60–80% loss of the dopamine fibers in the striatum at symptom onset (Bernheimer et al., 1973; Riederer and Wuketich, 1976; Fearnley and Lees, 1991; Greffard et al., 2006). Indeed, it has always been inherently difficult to generate genetically modified mouse models for PD with a parkinsonian phenotype. In homozygous mice carrying human α-synuclein with the A30P and A53T mutations, Kilpeläinen et al. reported minor behavioral deficits already in 3- to 6-months old mice compared to wt mice with a reduction of vertical counts, jump counts and average speed during measurements of locomotor activity (Kilpeläinen et al., 2019). Interestingly, the authors showed that homozygous A30P/A53T mice at 18 months of age were hyperactive compared to wt littermates. However, while not showing an overt parkinsonian phenotype, the hm2α-SYN-39 mouse model still reflects the chronic progressive nature of the disease. Richfield et al. previously showed a colocalization of human α-synuclein and TH in the hm2α-SYN-39 mice aged 2–3 months (Richfield et al., 2002). Interestingly, we found the load of human A53T α-synuclein to be significantly reduced in 16–17 months old hm2α-SYN-39 mice compared to the young mutated animals. While the 2–3 months old tg mice showed a positive staining for human α-synuclein in 57.00% of TH+ cells, the same was true for only 25.76% of TH+ cells in the 16–17 months old animals. Henrich et al. observed a similar phenomenon in mice injected with α-synuclein fibrils into the pedunculopontine nucleus (Henrich et al., 2020). The authors observed that α-synuclein immunoreactivity increased 6 weeks post injection compared to one week post injection, but α-synuclein immunoreactivity declined again at 12 weeks post injection. In the viral vector based model, this decline was not associated with significant cell loss suggesting that neurons can clear misfolded forms of α-synuclein from the cell, i.e. via autophagy or exocytic release (Stefanis et al., 2019). An argument could also be made that the cells with an expression of human α-synuclein are more vulnerable and were the first ones to degenerate. Indeed, mitochondrial damage and oxidative stress are considered major reasons for neurodegeneration in PD and it has been shown that α-synuclein itself can bind mitochondrial complex I and disturb its activity, thus affecting the mitochondrial function of the cell (Devi et al., 2008; Chinta et al., 2010; Martínez et al., 2018).
Regarding neuroinflammatory processes and their possible contribution to disease pathology, Brochard et al. were the first to show that both CD4+ T cells and CD8+ T cells had significantly invaded the brain of PD patients in a postmortem study (Brochard et al., 2009). The invasion of T cells has also been successfully demonstrated in toxin-based and viral vector based animal models (Brochard et al., 2009; Harms et al., 2013; Williams et al., 2021; Karikari et al., 2022). In the present hm2α-SYN-39 mouse model, the increase of T cells in 16–17 months old hm2α-SYN-39 mice compared to young tg mice as well as compared to age-matched wt mice, was more pronounced for the CD8+ than for the CD4+ T cell subpopulation. In the striatum of 16–17 months old hm2α-SYN-39 mice, however, a positive correlation of CD8+ and CD4+ T cell numbers with the loss of dopaminergic fibers could be detected. This correlation points towards neuroinflammatory processes specifically involved in neurodegeneration in the hm2α-SYN-39 mouse model in contrast to the wt littermates. The potential infiltration of CD8+ and CD4+ T cells into the striatum and the SN in genetic rodent models for PD has barely been studied. Iba et al. showed a significant rise in CD4+ T cells in the striatum and hippocampus as well as a much lower, but still significant increase of CD8+ T cells in the striatum of 10–11 months old Thy1-αSyn mice compared to wt littermates (Iba et al., 2020). Interferon γ-expressing CD3+ cells were found to be increased in the neocortex, hippocampus and striatum of the tg mice and flow cytometry revealed natural killer T cells to be significantly increased in the brains of the Thy1-αSyn mice. These Thy1-αSyn mice are known to have reduced striatal tissue content of DA by 14-months of age, but no dopaminergic cell loss (Chesselet et al., 2012). Another study measured the blood levels of CD8+ T cells and CD4+ T cells by flow cytometry in Thy1-αSyn and wt mice (Watson et al., 2012). They found an increase of T cells only at an age of 22 months in the Thy1-αSyn mice compared to age-matched wt mice. In concordance with data found in human PD patients, no infiltration of B cells into the nigrostriatal tract of hm2α-SYN-39 mice were found (Brochard et al., 2009). On a side note, a non-significant increase of T cells in the SN and striatum was also seen in the wt mice with progressive age, a phenomenon which has been described before in aging wt mice (Stichel and Luebbert, 2007; Groh et al., 2021). The strongest inflammatory response was seen for CD11b+ cells in the striatum as well as in the SN of aging hm2α-SYN-39 mice compared to wt littermates. Interestingly, the number of CD11b+ cells was already significantly elevated in the SN of young, 2–3 months old tg mice compared to their age-matched wt littermates. Indeed, following administration of MPTP, Brochard et al. noted increased numbers of activated microglial cells prior to the appearance of CD3+ T cells, which could point towards a possible role of microglia in recruiting T cells to the SN (Brochard et al., 2009). Regarding the evidence of the role of microglia in genetic mouse model, Su et al. previously found evidence of microglial activation in one-month old mice expressing human α-synuclein without signs for dopaminergic cell death (Su et al., 2008, Su et al., 2009). Remarkably, the significant activation of microglia could not be seen in the same mutant mice aged 6 or 12 months compared to age-matched wt animals. In mice expressing the Thy1-driven A53T mutant form of human α-synuclein, microglial activation was seen in brain regions affected by Lewy-like pathological changes in neurons (van der Putten et al., 2000). In the above-mentioned 10–11 months old Thy1-αSyn mice, a rise in microglia and astrocytes was identified in the neocortex, hippocampus and striatum compared to wt littermates (Iba et al., 2020). As for the human PD brain and the role of microglia, the presence of a large number of reactive human leukocyte antigen-DR-positive microglia has been shown in postmortem studies of PD as well as other neurodegenerative disorders (McGeer et al., 1988). Langston et al. reported the clustering of microglia around DA neurons in a postmortem neuropathological study of three patients with MPTP-induced parkinsonism (Langston et al., 1999). It is still unclear how microglia contribute to neuronal cell death, but it has been hypothesized that these cells may play an important role in driving and perpetuating the neurodegeneration in PD. Microglia were, however, reported to also have a neuroprotective effect by engulfing and degrading neuron-released α-synuclein via autophagy (Choi et al., 2020). Another glial cell type assumed to be involved in PD pathology are reactive astrocytes (Booth et al., 2017; Wang et al., 2021). The specific consequences of reactive astrocytosis in neurodegenerative diseases is still unclear. It is assumed that dysfunctional astrocytes could contribute to oxidative stress, mitochondrial impairment, α-synuclein toxicity and neuroinflammation in PD (Miyazaki and Asanuma, 2020). In MPTP models, astrocytic activation was reported to occur in parallel to dopaminergic degeneration (O’Callaghan et al., 1990; Kohutnicka et al., 1998). Some autopsy studies have shown similar results with reactive astrocytes being detected in large numbers in the SN of patients with PD compared to age-matched controls, others found a negative correlation between astrocytes and α-synuclein concentration (Miklossy et al., 2006; Song et al., 2009; Tong et al., 2015). PD-patient derived astrocytes were shown to be more responsive to inflammatory stimuli than control astrocytes, releasing higher amounts of cytokines (Sonninen et al., 2020). We were able to show an age-dependent increase of GFAP+ astrocytes in the hm2α-SYN-39 mice. Contrary to microglia, this elevation seemed to accompany dopaminergic neurodegeneration and not precede it. A further characterization of these glial cells would be necessary to relate the reactivity of the astrocytes in aging hm2α-SYN-39 mice to a potential neurotoxic function. The non-significant increase of GFAP+ astrocytes in the older wt animals compared to 2–3 months old wt mice has previously been described in normal aging (Clarke et al., 2018).
Although toxin-based PD animal models emulate many of the key features of the disease, it can be challenging to address PD etiology due to the rapid induction of the disease and because only a few PD cases are actually caused by such toxins. As detailed in the information box on genetic mouse models expressing human, mutant α-synuclein, the disadvantage of these rodent models is a high variability in dopaminergic neurodegeneration and motor phenotype. Moreover, the A30P and A53T double mutation in the α-synuclein protein has not been described for human PD. Robust mouse models for PD that simulate the disease in all its aspects (motor and non-motor symptoms, dopaminergic cell loss and formation of inclusion bodies) are unfortunately still lacking. Despite these caveats, the hm2α-SYN-39 mouse model reflects important aspects of the disease and shows mild, but age-dependent and dopaminergic-loss-correlated neuroinflammation. Our data indicate that T cell driven neuroinflammation occurs only when dopaminergic loss sets in, but microglial driven inflammation may set in earlier. Indeed, one of the unresolved issues in PD research is still the role of inflammation during the early stages of the disease. Previous studies in genetic animal models have pointed towards an increase of activated microglia to precede dopaminergic neurodegeneration (Lam et al., 2011). A clear limitation of our study is, however, that the number of microglia cells was assessed, but no differentiation of resting vs active microglia was performed. Furthermore, a significant, age-dependent increase in reactive astrocytes in hm2α-SYN-39 could point towards an additional neurotoxic player. This confirmation of central inflammation in combination with age-dependent dopaminergic cell reduction in a genetic mouse model for PD allows for the trial of new therapeutic options. The effect of anti-inflammatory therapies could be studied prior as well as after onset of dopaminergic cell loss.