
α-Synuclein modulates tau spreading in mouse brains
By Fares Bassil, Emily S. Meymand, Hannah J. Brown, Hong Xu, Timothy O. Cox, Shankar Pattabhiraman, Chantal M. Maghames, Qihui Wu, Bin Zhang, John Q. Trojanowski, and Virginia M.-Y. Lee
Excerpt from the article published in Journal of Experimental Medicine, 4 January 2021; 218 (1): e20192193. DOI: https://doi.org/10.1084/jem.20192193
Editor’s Highlights
- Neuropathological data obtained from Parkinson’s disease (PD) and non-PD donors showed a strong association between α-synuclein (α-syn) and tau pathology burden in the human neurodegenerative disease brain.
- Accumulation of tau aggregates occur following simultaneous introduction of α-syn mousepreformed fibrils (mpffs) and AD lysate–derived tau seeds (AD-tau).
- Tau hyperphosphorylation induced by α-syn aggregates has been demonstrated in several studies and could be a mechanism that explains how α-syn triggers tauopathy.
- Also, an alteration of the ubiquitin–proteasome system marked by the increase of ubiquitin, K48, and K63 polyubiquitin chains under α-syn/tau copathology.
- AD-tau pathology is accelerated and amplified in the presence of α-syn pathology might be due to the ability of α-syn to compromise protein clearance, resulting in the enhancement of tau seeding and spreading.
- AD-tau/α-syn transduction resulted in the appearance of insoluble tau aggregates in p-α-syn–positive and negative neurons compared with AD-tau that rarely induced tau pathology in cell bodies and primarily showed staining in neurites.
- α-syn facilitates and promotes tau aggregation as well as modulates the spreading of pathological tau in the brain.
Abstract
α-Synuclein (α-syn) and tau aggregates are the neuropathological hallmarks of Parkinson’s disease (PD) and Alzheimer’s disease (AD), respectively, although both pathologies co-occur in patients with these diseases, suggesting possible crosstalk between them. To elucidate the interactions of pathological α-syn and tau, we sought to model these interactions. We show that increased accumulation of tau aggregates occur following simultaneous introduction of α-syn mousepreformed fibrils (mpffs) and AD lysate–derived tau seeds (AD-tau) both in vitro and in vivo. Interestingly, the absence of endogenous mouse α-syn in mice reduces the accumulation and spreading of tau, while the absence of tau did not affect the seeding or spreading capacity of α-syn. These in vivo results are consistent with our in vitro data wherein the presence of tau has no synergistic effects on α-syn. Our results point to the important role of α-syn as a modulator of tau pathology burden and spreading in the brains of AD, PDD, and DLB patients.
Introduction
A common feature of neurodegenerative disorders (NDDs) is the accumulation of unique pathological proteins in the brain, including pathological α-synuclein (α-syn) proteins in Lewy bodies in Parkinson’s disease (PD) and hyperphosphorylated tau (p-tau) in neurofibrillary tangles in Alzheimer’s disease (AD; Galasko et al., 1994; Jankovic, 2008; Spillantini and Goedert, 2016).
The simultaneous accumulation of α-syn and p-tau is a common feature in NDDs. Tau deposition has been described in synucleinopathies, including familiar and sporadic forms of PD, PD with dementia, and dementia with Lewy bodies, while α-syn aggregates have been detected in disorders wherein tau pathology is prominent, such as familial and sporadic AD, Down’s syndrome, and progressive supranuclear palsy (Arai et al., 2001; Coughlin et al., 2019; Iseki, 2004; Jellinger and Attems, 2008; Lippa et al., 1998; Marui et al., 2000). This overlap in pathological protein accumulation is accompanied by overlapping symptoms in patients with rapid decline in cognition, motor performance, and shortened lifespan (Hansen et al., 1990; Irwin et al., 2013, 2017). This clinical and pathological correlation prompted our interest in elucidating the mechanism of comorbid α-syn and tau pathological aggregates in the brains of Lewy body disease (LBD) patients as well as the effect of one disease protein on the other.
Prior studies modeling LBD and AD have shown a potential synergistic relationship between α-syn and tau (Clinton et al., 2010; Duka et al., 2009; Emmer et al., 2011; Frasier et al., 2005; Haggerty et al., 2011; Höglinger et al., 2005; Khandelwal et al., 2010, 2012; Masliah et al., 2001; Masuda-Suzukake et al., 2014; Morris et al., 2011; Wills et al., 2011). Moreover, data from bigenic mice with tau tangles and α-syn Lewy bodies exhibit exacerbated behavioral impairment associated with increases in pathological α-syn and tau (Clinton et al., 2010; Masliah et al., 2001). Furthermore, reducing the expression of α-syn in a tau transgenic (Tg) mouse model and reducing tau expression in α-syn Tg mouse models failed to decrease pathological levels of each of these aggregated proteins or the subsequent neurodegenerative effects associated therewith, suggesting that these proteins might interact while also having the ability to work independently (Morris et al., 2011). In vitro, α-syn and tau fibrils have been shown to promote the fibrilization of each other (Badiola et al., 2011; Giasson et al., 2003; Guo et al., 2013; Lee et al., 2004). Prior injection studies have shown that α-syn mouse preformed fibrils (mpffs) generated from recombinant α-syn are capable of initiating seeding and spreading of α-syn pathology in the mouse brain (Luk et al., 2016; Rey et al., 2016; Sharma et al., 2016). Importantly, α-syn has been reproducibly shown to promote tau aggregation in a process termed cross-seeding (Giasson et al., 2003; Guo et al., 2013; Bassil et al., 2020). On the other hand, tau injections in WT or Tg mice with amyloid-β (Aβ) plaques failed to induce α-syn pathology (He et al., 2018). While the results from these published studies are compelling, the effects of tau and α-syn on each other’s seeding as well as on cell-to-cell transmission have yet to be assessed in injection models.
To determine if α-syn and tau copathologies can be recapitulated in animal model systems, we injected α-syn mpffs, enriched AD brain-derived tau (AD-tau), or combined AD-tau/α-syn mpffs into WT mice. We then injected α-syn mpffs in tauKO mice and AD-tau in α-synKO mice to further elucidate the effects of each disease protein on the pathogenesis of its counterpart. We hypothesized that the presence of both pathologies in the brains of LBD and AD patients would significantly potentiate the seeding and spreading of each other.
Results
α-Syn abundance positively correlates with tau burden in PD patients
Brain samples from PD and non-PD patients with Braak stage 1–2 tau pathology lacking Aβ deposits and therefore no AD pathology were immunostained for phosphorylated α-syn (p-α-syn) and p-tau. PD brains showed a significant increase in p-α-syn in the substantia nigra, pons, thalamus, medulla, and to a lower extent the hippocampus and entorhinal cortex compared with non-PD brains (Fig. 1, A–G). For comparison, no p-α-syn was found in non-PD patient’s brains without AD pathology (Fig. 1, A–G). Importantly, p-α-syn was accompanied by a significant increase in p-tau staining in the susbstantia nigra, thalamus, and medulla of PD patients compared with non-PD patients (Fig. 1, A–G). As expected, p-tau–positive neurons were found in the hippocampus, entorhinal cortex, and pons of PD and non-PD Braak stage 1–2 patients (Fig. 1, A–G). These results are consistent with the staging criteria used. It is noteworthy that the absence of any p-α-syn staining in the regions positive for p-tau in non-PD patients may be due to a possible directional interaction between both proteins.
To further assess the relation between α-syn and tau, correlational analyses were done, and they showed that tau pathology in the midbrain and brainstem regions is correlated with the presence of α-syn pathology in PD patients (Fig. 1, G and H). On the other hand, tau pathology in the hippocampus and entorhinal cortex was not correlated with the α-syn load in PD and non-PD patients (Fig. 1, G and I). Double-labeling immunofluorescence showed that the p-tau–positive signal only appeared in p-α-syn–positive neurons in the medulla and substantia nigra of PD patients (Fig. 1, J and L). Colocalization analysis showed a high percentage of p-tau/p-α-syn signal in the medulla and substantia nigra (Fig. 1, J–O). In contrast, no colocalization of p-tau/p-α-syn was found in the hippocampus and entorhinal cortex of PD patients (Fig. 1, K, M, P, and Q).
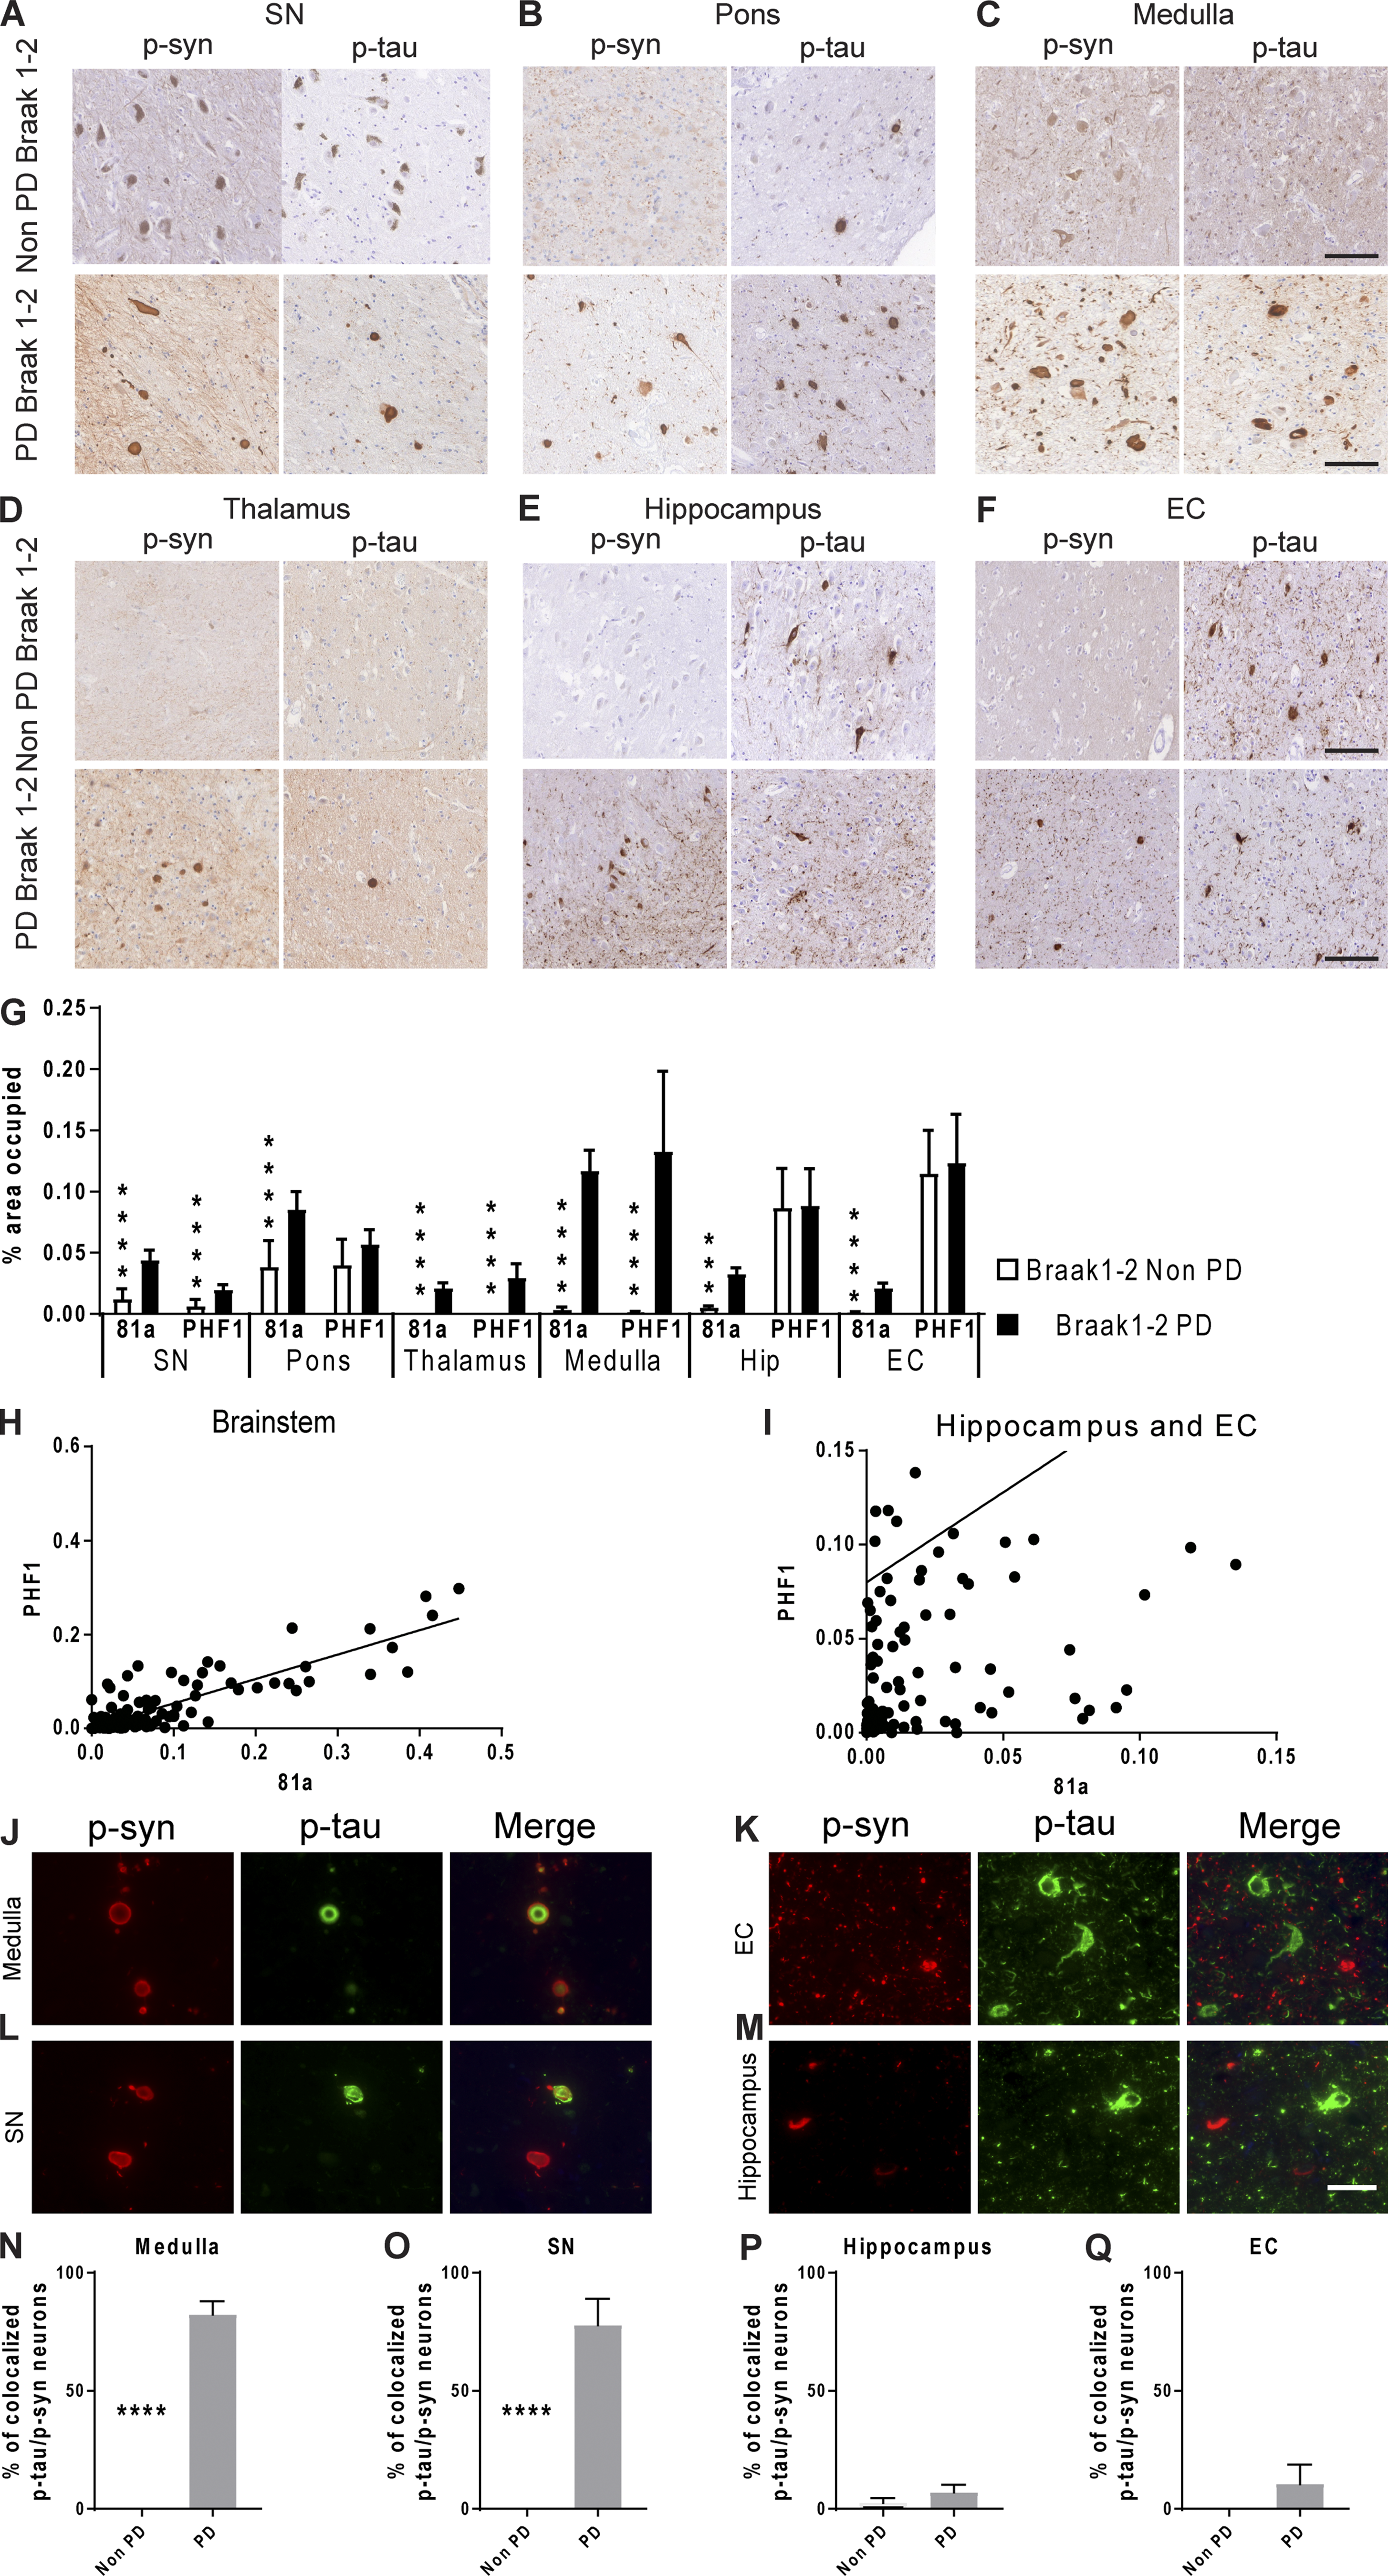
α-Syn load correlates with tau burden in the brainstem, but not cortical regions, of patients with PD in the absence of Aβ.
(A–F) Representative images for mAb 81A p-α-syn and PHF1 p-tau pathology in tissue sections from the (A) substantia nigra (SN), (B) pons, (C) medulla, (D) thalamus, (E) hippocampus, and (F) entorhinal cortex (EC) in PD Braak stage 1–2 and non-PD Braak stage 1–2 patients. Scale bars, 100 µm. (G) A grouped bar graph shows a positive association between α-syn and tau percentage area stained. A two-tailed t test was performed to calculate the difference between groups. If the data were not normally distributed, a Mann–Whitney test was used. ****, P < 0.0001. (H and I) Correlation analysis between α-syn and tau in the brainstem (H; r = 0.87), hippocampus, and entorhinal cortex (I; r = 0.14). (J–M) IF double labeling was conducted for p-α-syn (red) and p-tau (green) using 81A and PHF1, respectively, in the medulla (J), entorhinal cortex (K), substantia nigra (L), and hippocampus (M) of PD patients. Scale bar, 40 µm. (N–Q) Percentage of p-tau–positive cells that were also positive for p-α-syn in the medulla (N), substantia nigra (O), hippocampus (P), and entorhinal cortex (Q) of PD patients. A two-tailed t test was performed to calculate the difference between groups; ****, P < 0.0001. Data are presented as mean ± SEM. All experimental data were quantified by two blinded scientists.
α-Syn seeding and spreading under copathology conditions
Previous studies have investigated copathology by characterizing α-syn and tau pathology in Tg mice or generating bigenic mice overexpressing tau and α-syn (Clinton et al., 2010; Frasier et al., 2005; Giasson et al., 2003; Haggerty et al., 2011; Khandelwal et al., 2012; Morris et al., 2011; Wills et al., 2011). We thus generated a copathology model based on the injection of α-syn mpffs and AD-tau into the brains of WT mice and compared them to single injections of AD-tau or α-syn mpffs. We first assessed the effect of α-syn/tau copathology by comparing p-α-syn pathology in WT mice injected with α-syn mpffs or a mixture of AD-tau/α-syn mpffs (Fig. 2).
P-α-syn staining revealed no major differences in the burden and spreading of α-syn between groups. α-Syn pathology was primarily found as cytoplasmic p-α-syn–positive inclusions in the hippocampus, entorhinal cortex, retrosplenial cortex, and auditory cortex (Fig. 2). P-α-syn staining was also found in neuritic form primarily in the hippocampus and entorhinal cortex (Fig. 2). The only significant increase in p-α-syn was found at 3 mo postinjection (mpi) in the entorhinal cortex of WT mice injected with AD-tau/α-syn mpffs compared with α-syn mpff–injected WT mice (Fig. 2, B and G). At 6 mpi, p-α-syn pathology was quite similar between groups but decreased in both groups by 9 mpi (Fig. 2, B and G). Importantly, α-syn spreading was not affected by the presence of tau pathology in WT mice (Fig. 2 M).
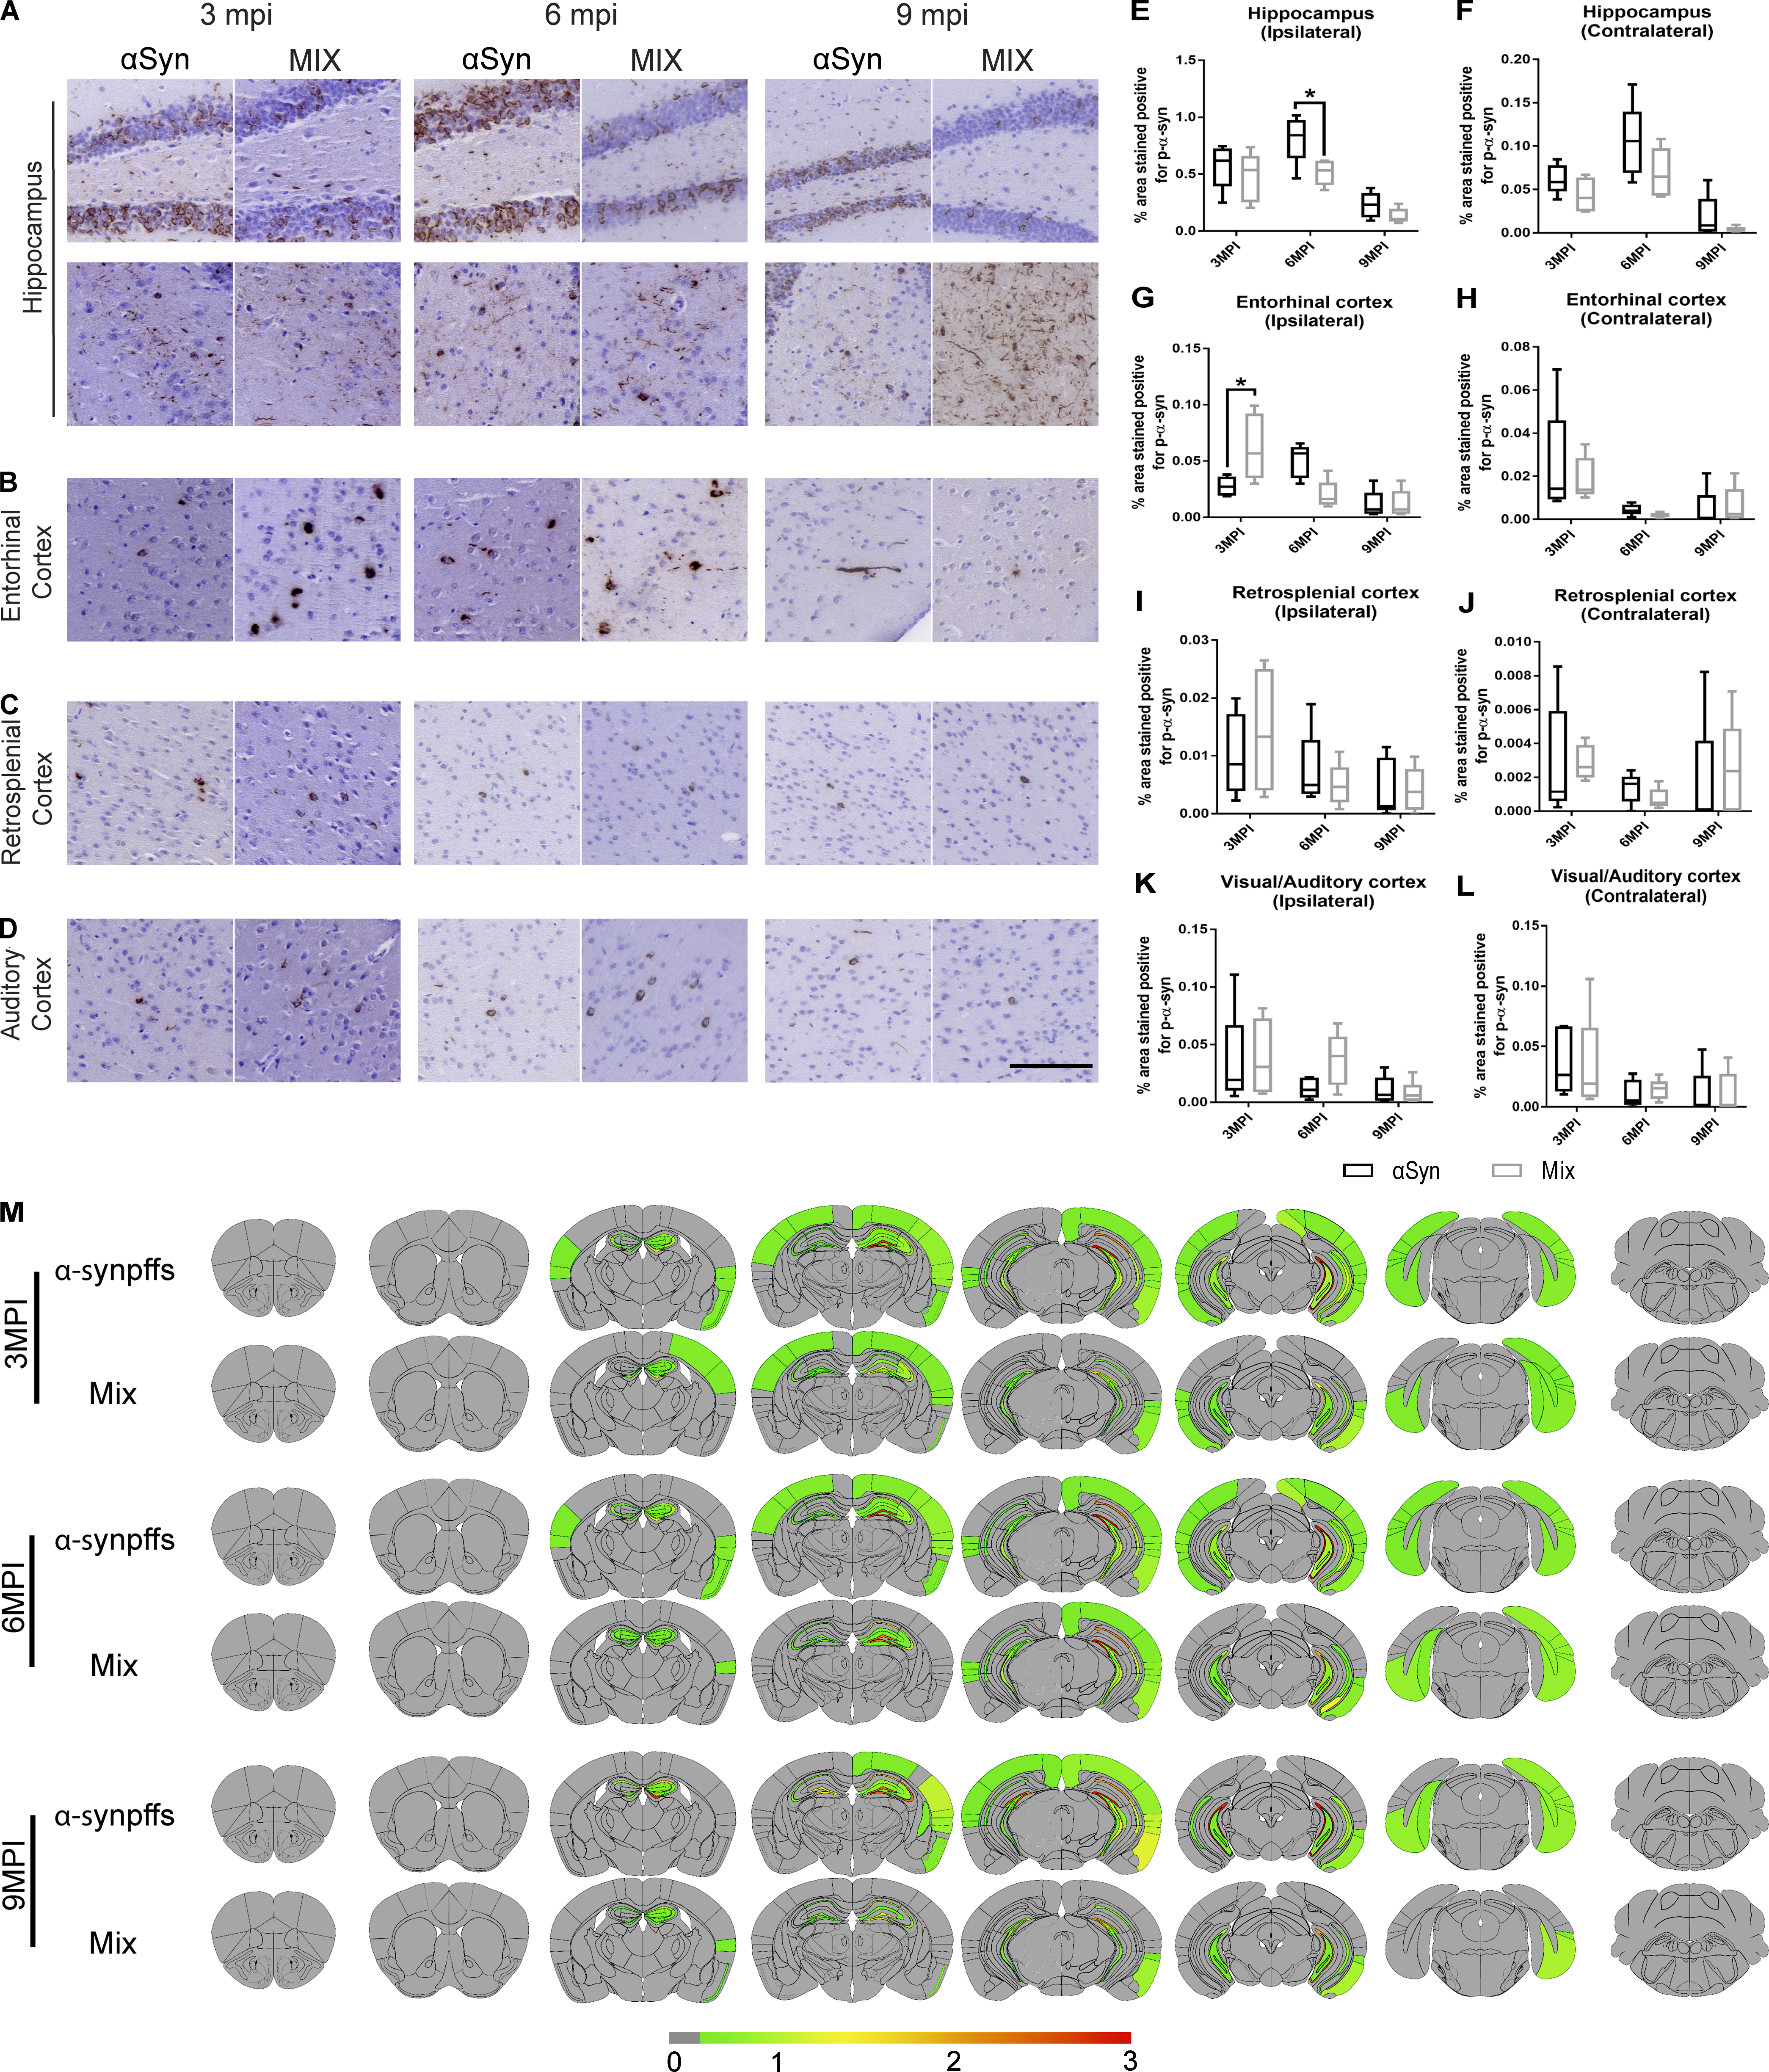
P-α-syn pathology varies spatially and temporally after injection of α-syn mpffs and AD-tau–enriched extracts under copathology conditions.
(A–D) Representative images for mAb 81A p-α-syn pathology in tissue sections from rostral and caudal hippocampus (A), entorhinal cortex (B), retrosplenial cortex (C), and auditory cortex (D) of WT mice at 3, 6, or 9 mpi of either α-syn mpffs alone or combined with AD-tau–enriched extracts. (E–L) Quantification of p-α-syn seen in A–D in the ipsilateral (E) and contralateral (F) hippocampus, ipsilateral (G) and contralateral (H) entorhinal cortex, ipsilateral (I) and contralateral (J) retrosplenial cortex, and ipsilateral (K) and contralateral (L) auditory cortex. (M) Semiquantitative heat mapping of p-α-syn pathology (see Materials and methods for details) in WT mice injected with either α-syn mpffs alone or α-syn mpffs combined with human AD-tau–enriched extracts. A two-tailed ttest was performed to calculate the difference between groups; *, P < 0.05. Data are presented as mean ± SEM (n = 5 mice per group). Scale bar, 100 µm. All experimental data were verified in at least two independent experiments.
Enhanced seeding and faster pathological spreading of tau under copathology conditions
While previous seeding studies have mainly focused on the relationship between tau and Aβ plaques in the brain (Bennett et al., 2017; He et al., 2018), we here assessed the effect of α-syn copathology on the appearance and spread of the pathological tau burden in the brain of WT mice (Fig. 3).
P-tau pathology burden and spreading were significantly increased in the presence of α-syn compared with tau injections alone in WT mice (Fig. 3). Hippocampal p-tau pathology was significantly increased in the presence of α-syn copathology compared with single injections of AD-tau (Fig. 3, A, F, and G). P-tau pathology progressively increased with time in the presence of α-syn pathology compared with single AD-tau injection (Fig. 3, A, F, and G). Moreover, in the presence of α-syn, tau pathology spreading and burden were significantly increased in the entorhinal cortex, retrosplenial cortex, and supramammillary nucleus marked by the increase in p-tau levels (Fig. 3, B, C, E, H–K, N, and P). P-tau pathology was significantly increased at 9 mpi in the auditory/visual cortex in the presence α-syn copathology (Fig. 3, D, L, and M). Increased p-tau pathology as early as 3 mpi in AD-tau/α-syn mpff–injected mice was not due to the persistence of the injected AD-tau material as a function of decreased clearance, since control experiments showed complete clearance of AD-tau from WT mouse brains by 1 mpi in AD-tau and AD-tau/α-syn mpff–injected mice (Fig. S1).
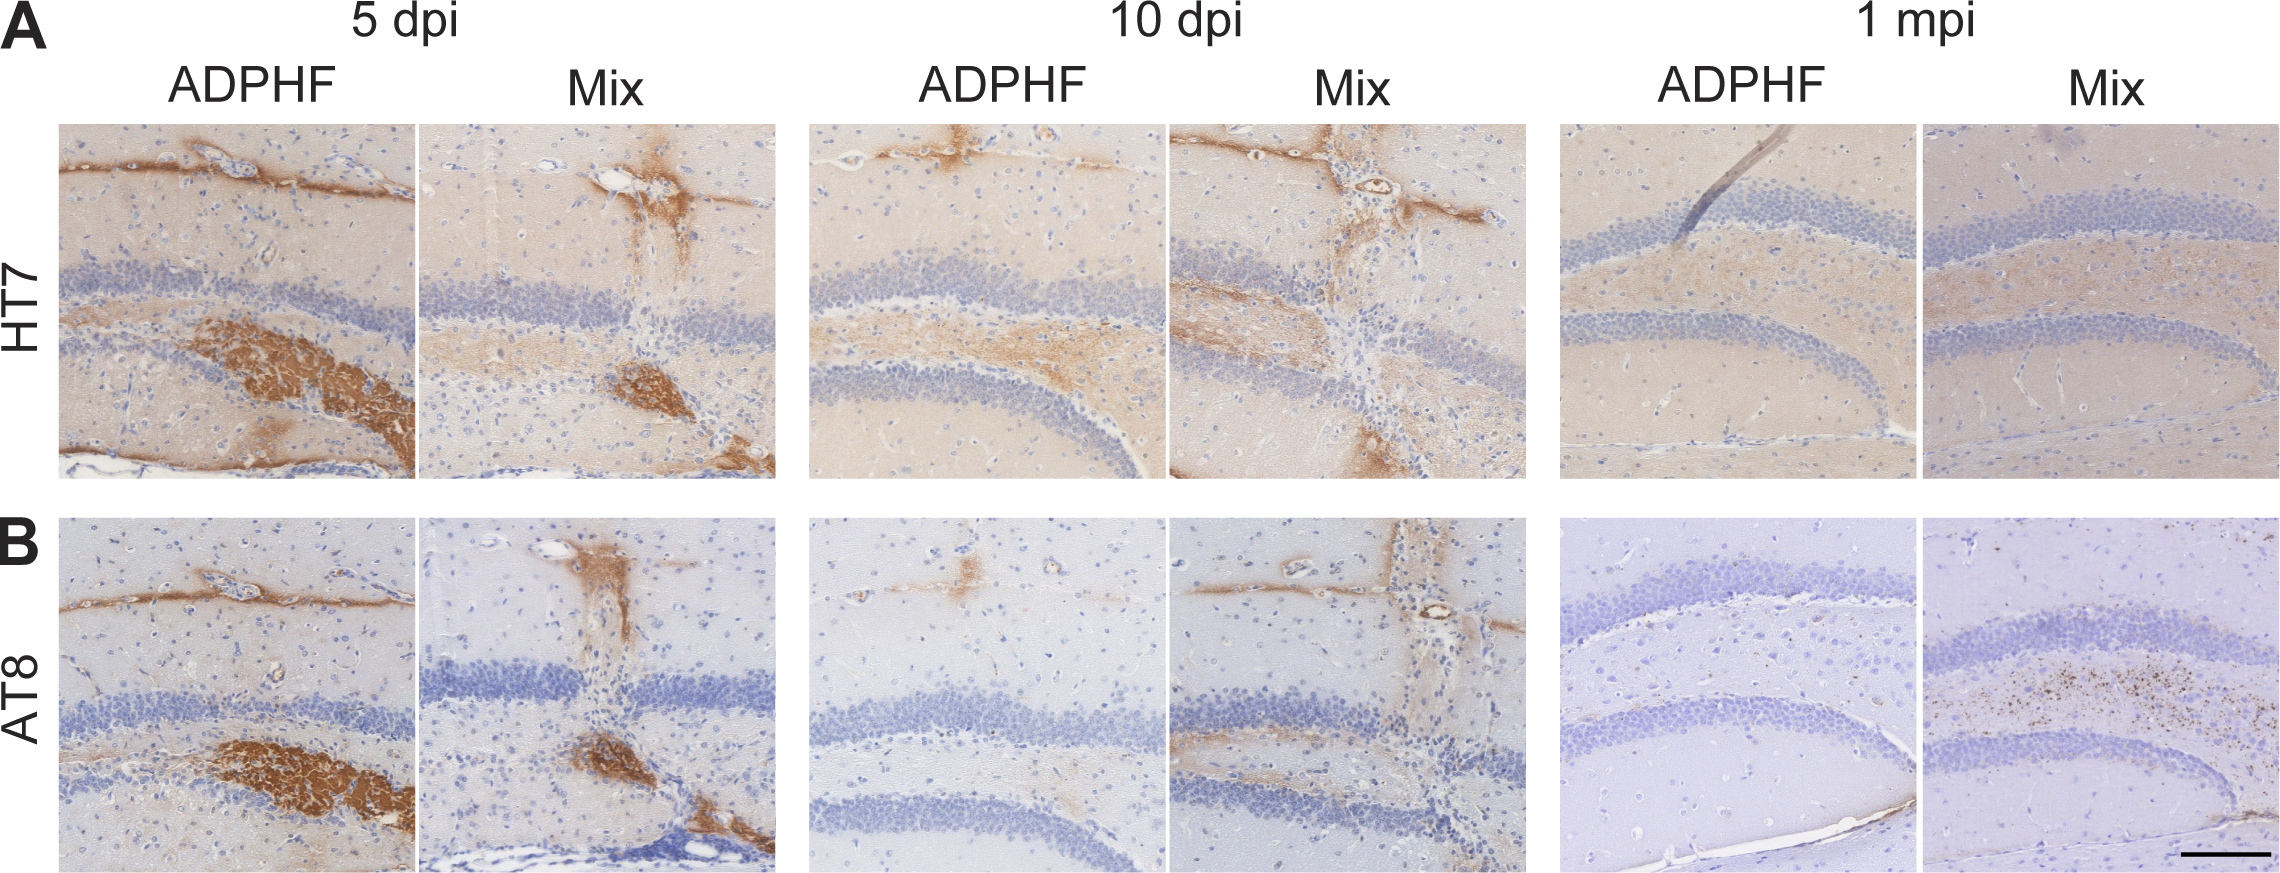
Clearance of injected AD p-tau from the brain is not affected by the presence of α-syn mpffs.
(A and B) Hippocampal sections of WT mice injected with either human AD-tau–enriched extracts alone or combined with α-syn mpffs stained for either human total tau (A) or AD brain-derived p-tau (B) 5, 10, or 30 d after injection. Scale bar, 100 µm. All experimental data were verified in at least two independent experiments.
To provide additional reasons to explain the overall increase in p-tau found in AD-tau/α-syn mpff–injected mice, we quantified the different forms of p-tau pathology present in the mouse brain. Increased p-tau pathology in α-syn/tau–injected mice was primarily due to an increase in p-tau–positive neurons, which was observed in the hippocampus and entorhinal cortex across the different time points (Fig. 3, Q–T). However, neuritic p-tau pathology was also significantly increased in α-syn/tau–injected mice compared with AD-tau–injected WT mice (Fig. 3, F–O). The robust increase in neuritic p-tau was primarily due to the presence of α-syn pathology, as AD-tau injections alone did not induce significant neuritic p-tau pathology until later time points (Fig. 3 and Fig. S2 A). Our control experiments showed that knocking out α-syn (α-synKO) reduced the appearance of neuritic p-tau pathology in the α-syn/tau–injected mice as well as the number of p-tau–positive neurons (Fig. S2 B). Injecting a mix of AD-tau with α-syn monomer in the WT mice did not recapitulate the neuritic and neuronal α-syn or neuritic tau pathology observed in the α-syn/tau copathology group, pointing to the importance of the α-syn pathology in inducing the p-tau pathology observed (Fig. S2 C). Finally, sonication alone is not key to the induction of the neuritic pathology as the analysis of mice coinjected with AD-tau and α-syn sonicated separately recapitulated the presence of neuritic tau pathology (Fig. S2 D). Increasing the concentration of α-syn mpffs injected with AD-tau resulted in a significant increase in neuritic p-tau pathology alongside the neuronal pathology (Fig. S2 E). Thus, these findings show that α-syn pathology is a strong driver and modulator of tau pathology in WT mice.
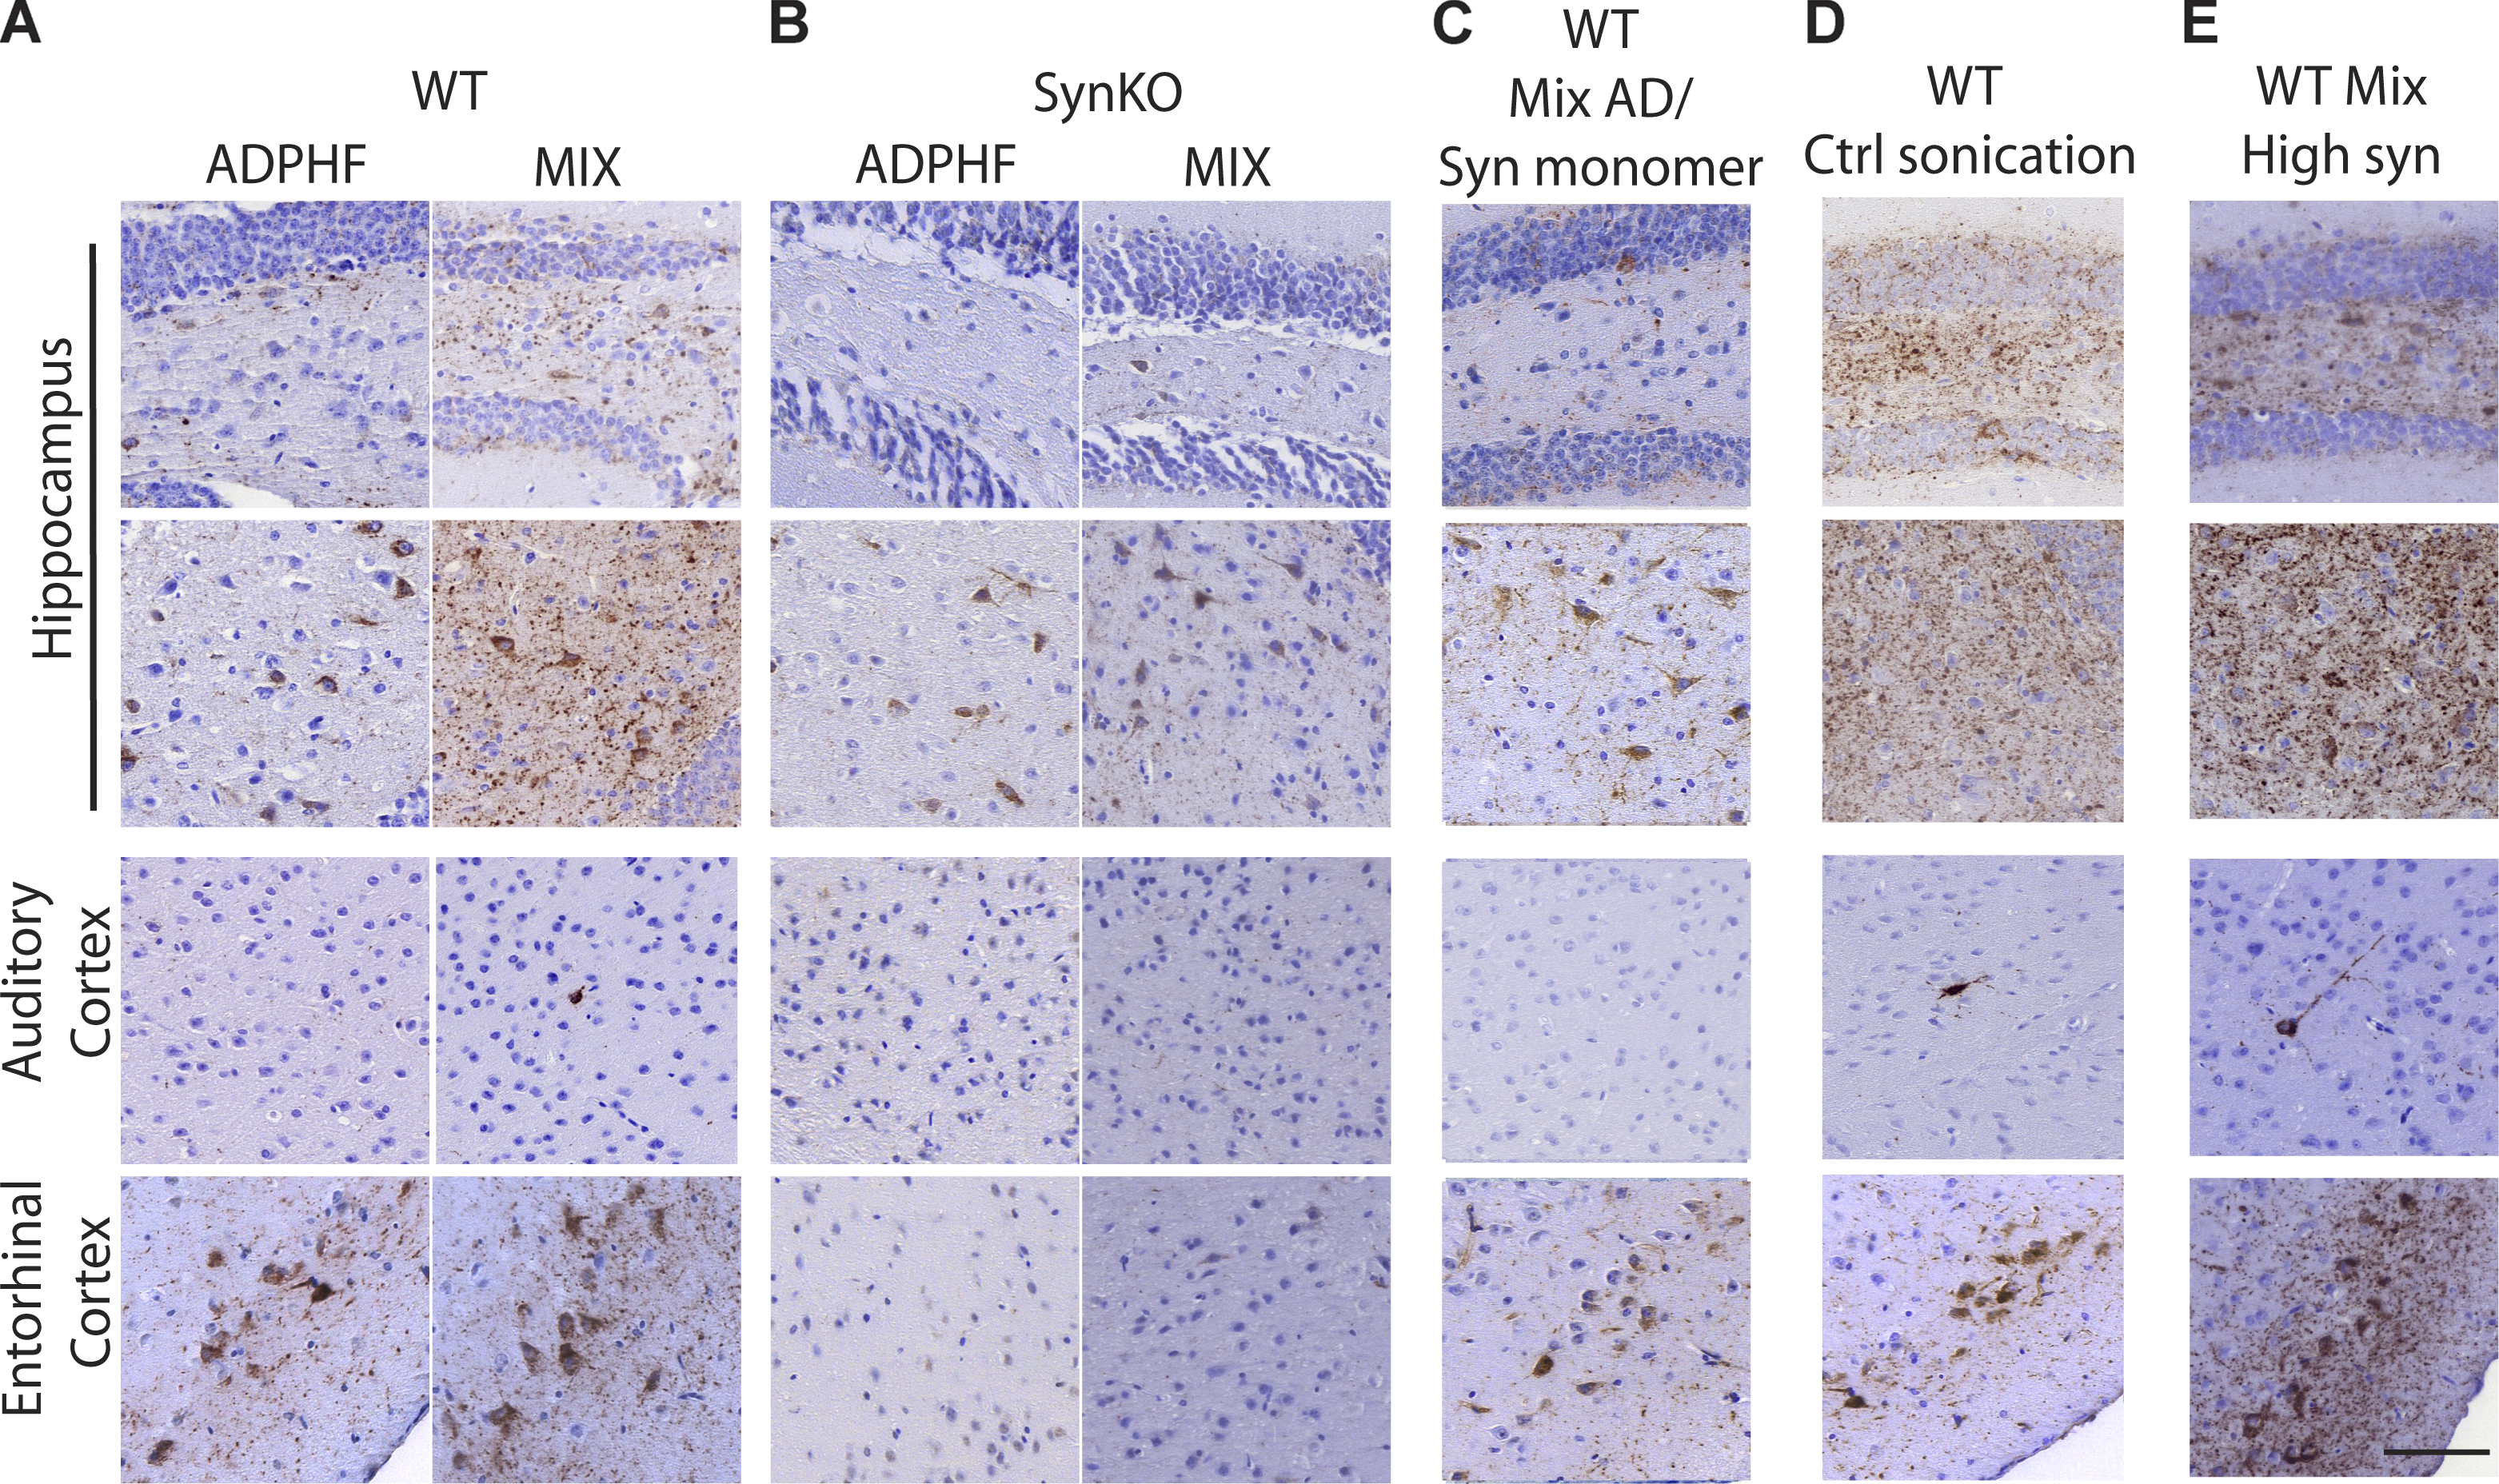
Neuritic p-tau pathology is modulated by the presence of α-syn.
(A–E) P-tau staining 3 mpi in the hippocampus, auditory cortex, and entorhinal cortex (A) injected with either human AD-tau–enriched extracts alone or combined with α-syn mpffs (0.4 mg/ml) in WT and α-synKO mice, (B) mice injected with either human AD-tau–enriched extracts alone or combined with α-syn mpffs (0.4 mg/ml) as well as WT mice injected with human AD-tau–enriched extracts plus α-syn monomers (C), human AD-tau–enriched extracts, and α-syn mpffs injected after separate sonication (D), or human AD-tau–enriched extracts and a higher concentration of α-syn mpffs (2 mg/ml; E). Scale bar, 100 µm. All experimental data were verified in at least two independent experiments.
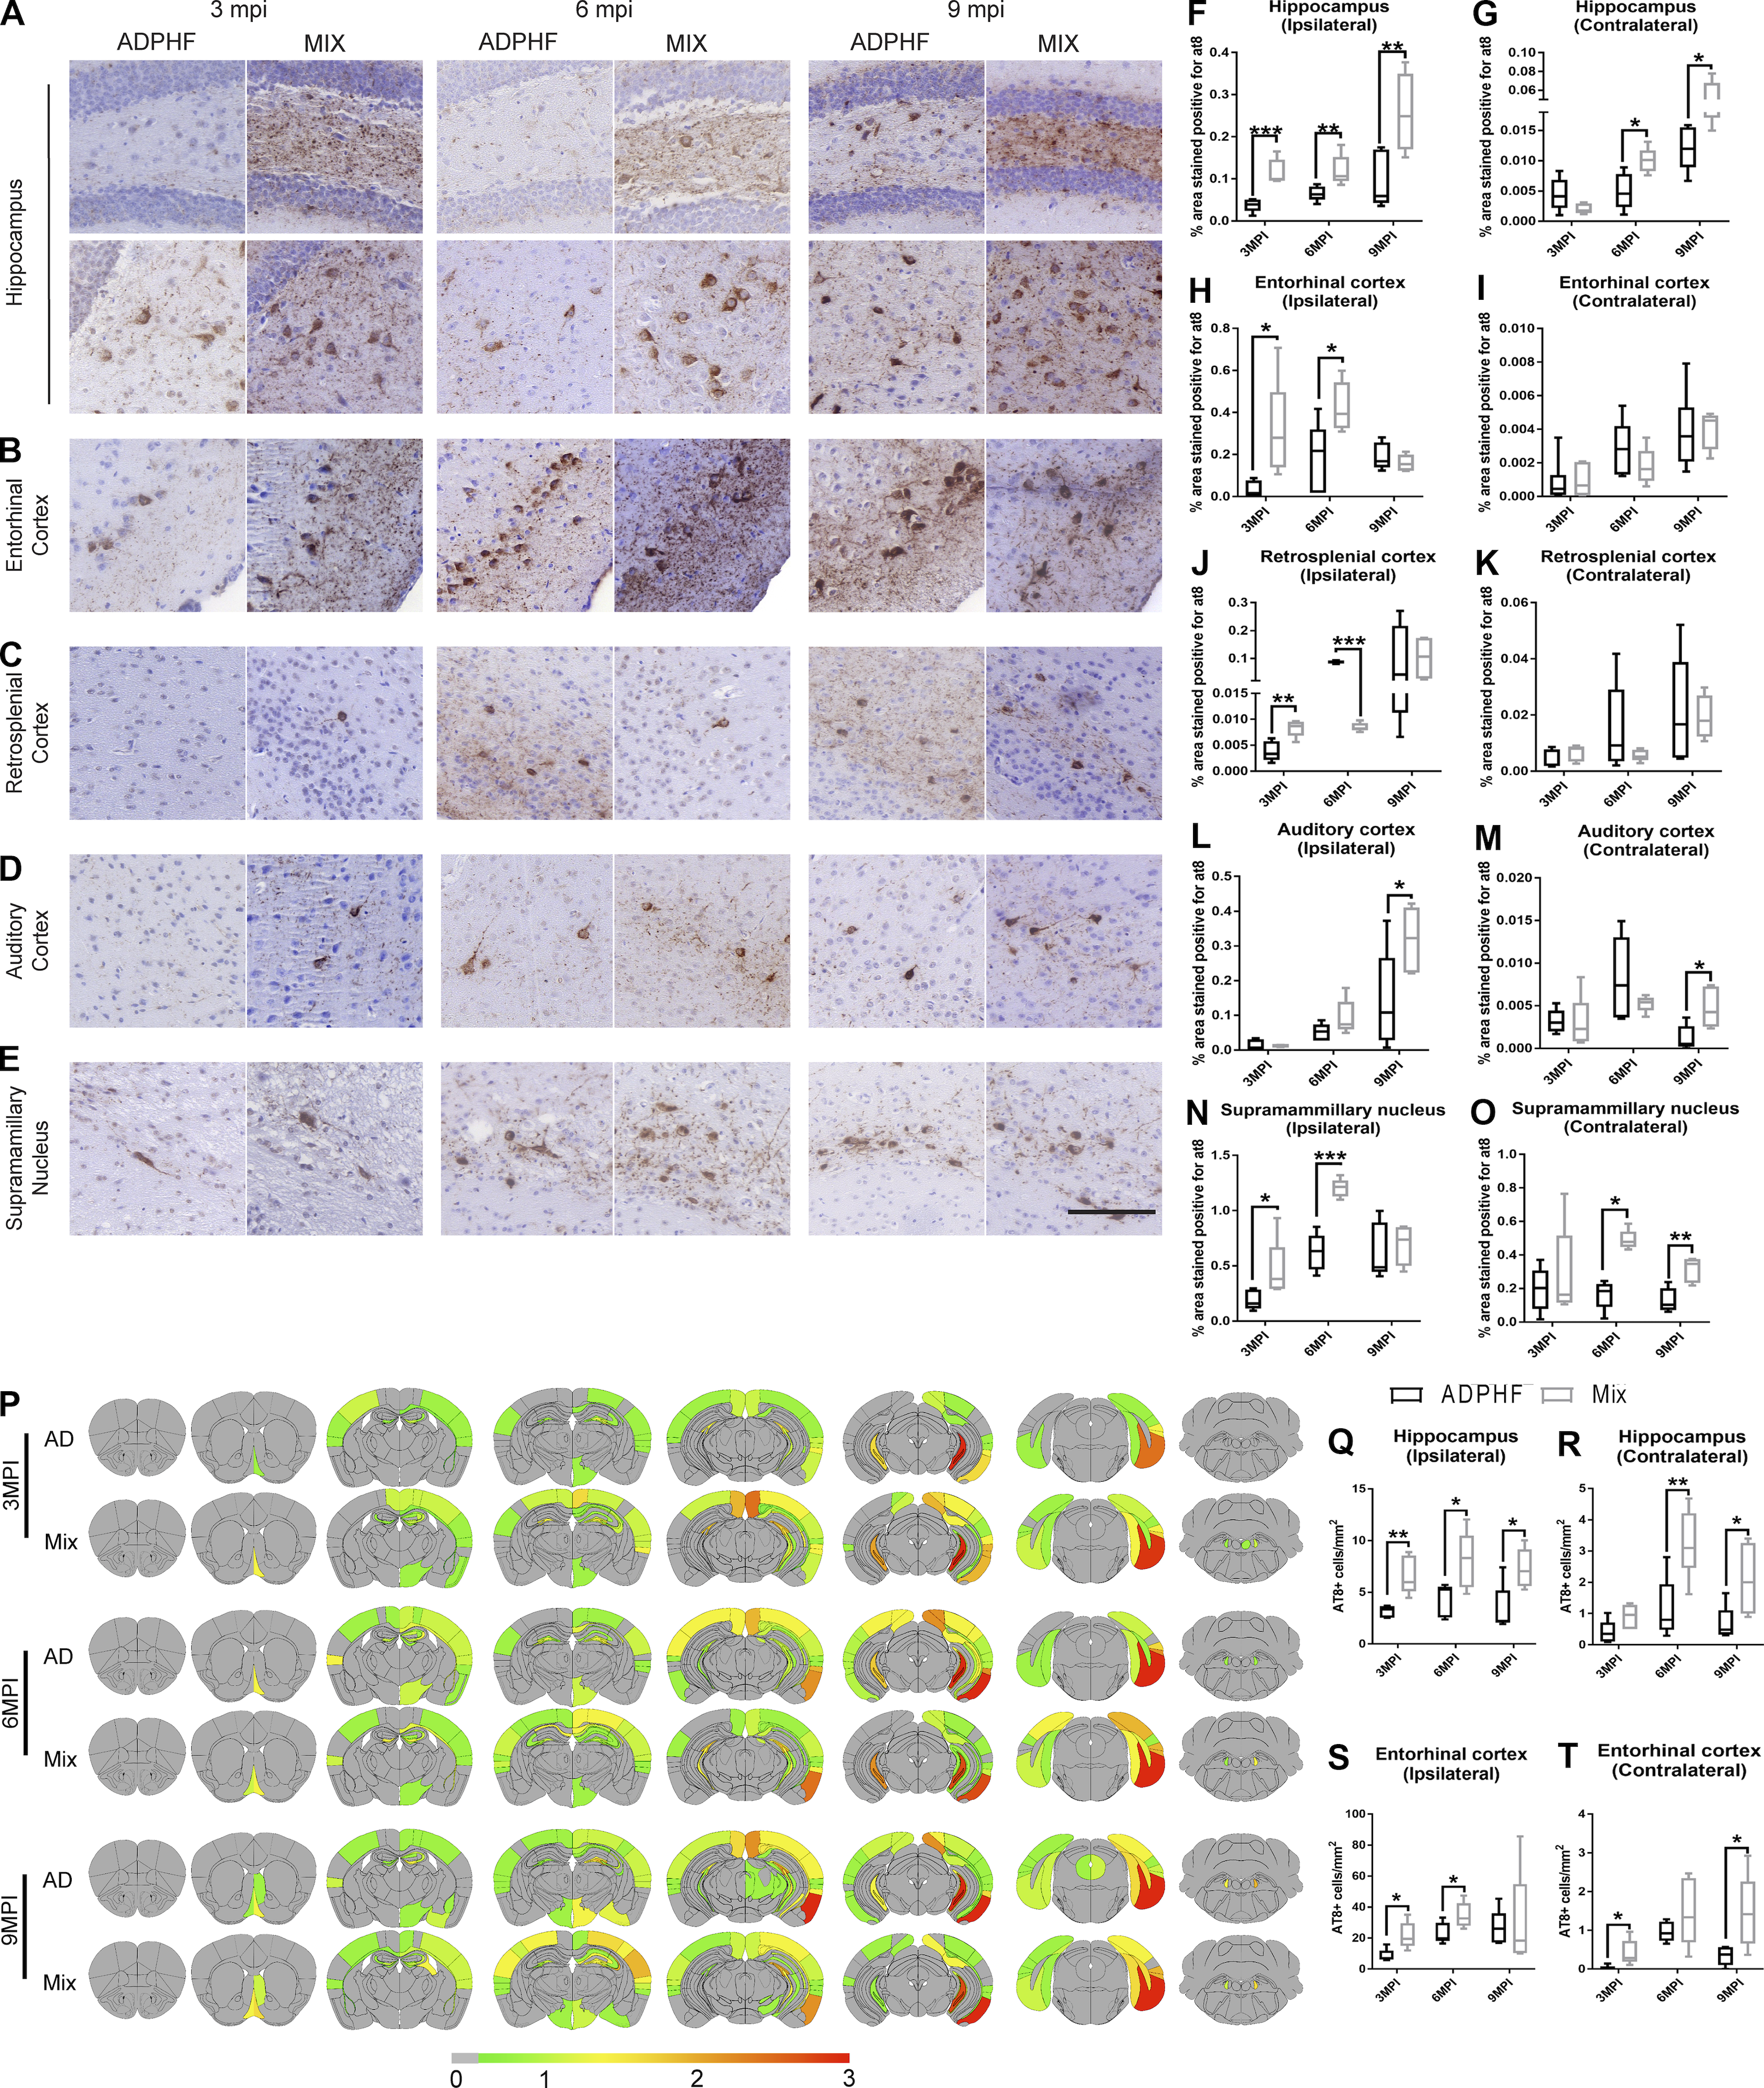
P-tau pathology is enhanced under copathology conditions after injection of AD-tau–enriched extracts combined with α-syn mpffs compared with AD-tau extracts alone.
(A–E)Representative images for AT8 p-tau pathology in tissue sections from the rostral and caudal hippocampus (A), entorhinal cortex (B), retrosplenial cortex (C), auditory cortex (D), and supramammillary nucleus (E) of WT mice 3, 6, or 9 mpi of either AD-tau–enriched extracts alone or combined with α-syn mpffs. (F–O) Quantification of p-tau seen in A–E in the ipsilateral (F) and contralateral (G) hippocampus, ipsilateral (H) and contralateral (I) entorhinal cortex, ipsilateral (J) and contralateral (K) retrosplenial cortex, ipsilateral (L) and contralateral (M) auditory cortex, and ipsilateral (N) and contralateral (O) supramammillary nucleus. (P) Semiquantitative heat mapping of p-tau pathology in WT mice injected with either human AD-tau extract alone or combined with α-syn mpffs. (Q–T) Quantification of p-tau–positive neurons in the ipsilateral hippocampus (Q), contralateral hippocampus (R), ipsilateral entorhinal cortex (S), and contralateral entorhinal cortex (T) of mice injected with either human AD-tau–enriched extracts alone or combined with α-syn mpffs 3, 6, or 9 mpi. A two-tailed t test was performed to calculate the difference between groups; *, P < 0.05; **, P < 0.01; ***, P < 0.001. Data are presented as mean ± SEM (n = 5–6 mouse brains per group). Scale bar, 100 µm. All experimental data were verified in at least two independent experiments.
α-Syn and tau pathology manifestation
Based on the results obtained above from PD and non-PD patients in the Center for Neurodegenerative Disease Research (CNDR) brain bank, we thought to characterize the α-syn and tau pathology generated under copathology conditions compared with single injections in WT mice. The spread of α-syn and tau did not differ between single-pathology compared with copathology conditions (Fig. 2 and Fig. 3). However, even though the spreading of tau and α-syn was not altered, we noted a shift in the spreading of tau pathology accompanied by an increase in the spreading rate to the connected regions under copathology (Fig. 3). We then assessed the distribution of p-α-syn and that of p-tau immunostaining under single-pathology conditions. P-α-syn pathology was observed in the dentate gyrus and the cornu ammonis region of the hippocampus, as well as the auditory cortex, retrosplenial cortex, and entorhinal cortex (Fig. 2). AD-tau injections led to p-tau–positive neurons in the mossy cells of the hippocampus in addition to the supramammillary nucleus, auditory cortex, retrosplenial cortex, and entorhinal cortex (Fig. 3). Under copathology conditions, both p-α-syn and p-tau pathology manifested in the same way as single-pathology groups (Fig. S3). Similar to our findings in the hippocampus and cortex in the human brain (Fig. 1), α-syn and tau were occasionally found in the same cell in the same neuronal population. Importantly, both p-α-syn and p-tau that aggregated in the same neuron were found in different cell compartments in the brain of AD-tau/α-syn mpff–injected WT mice (Fig. S3).
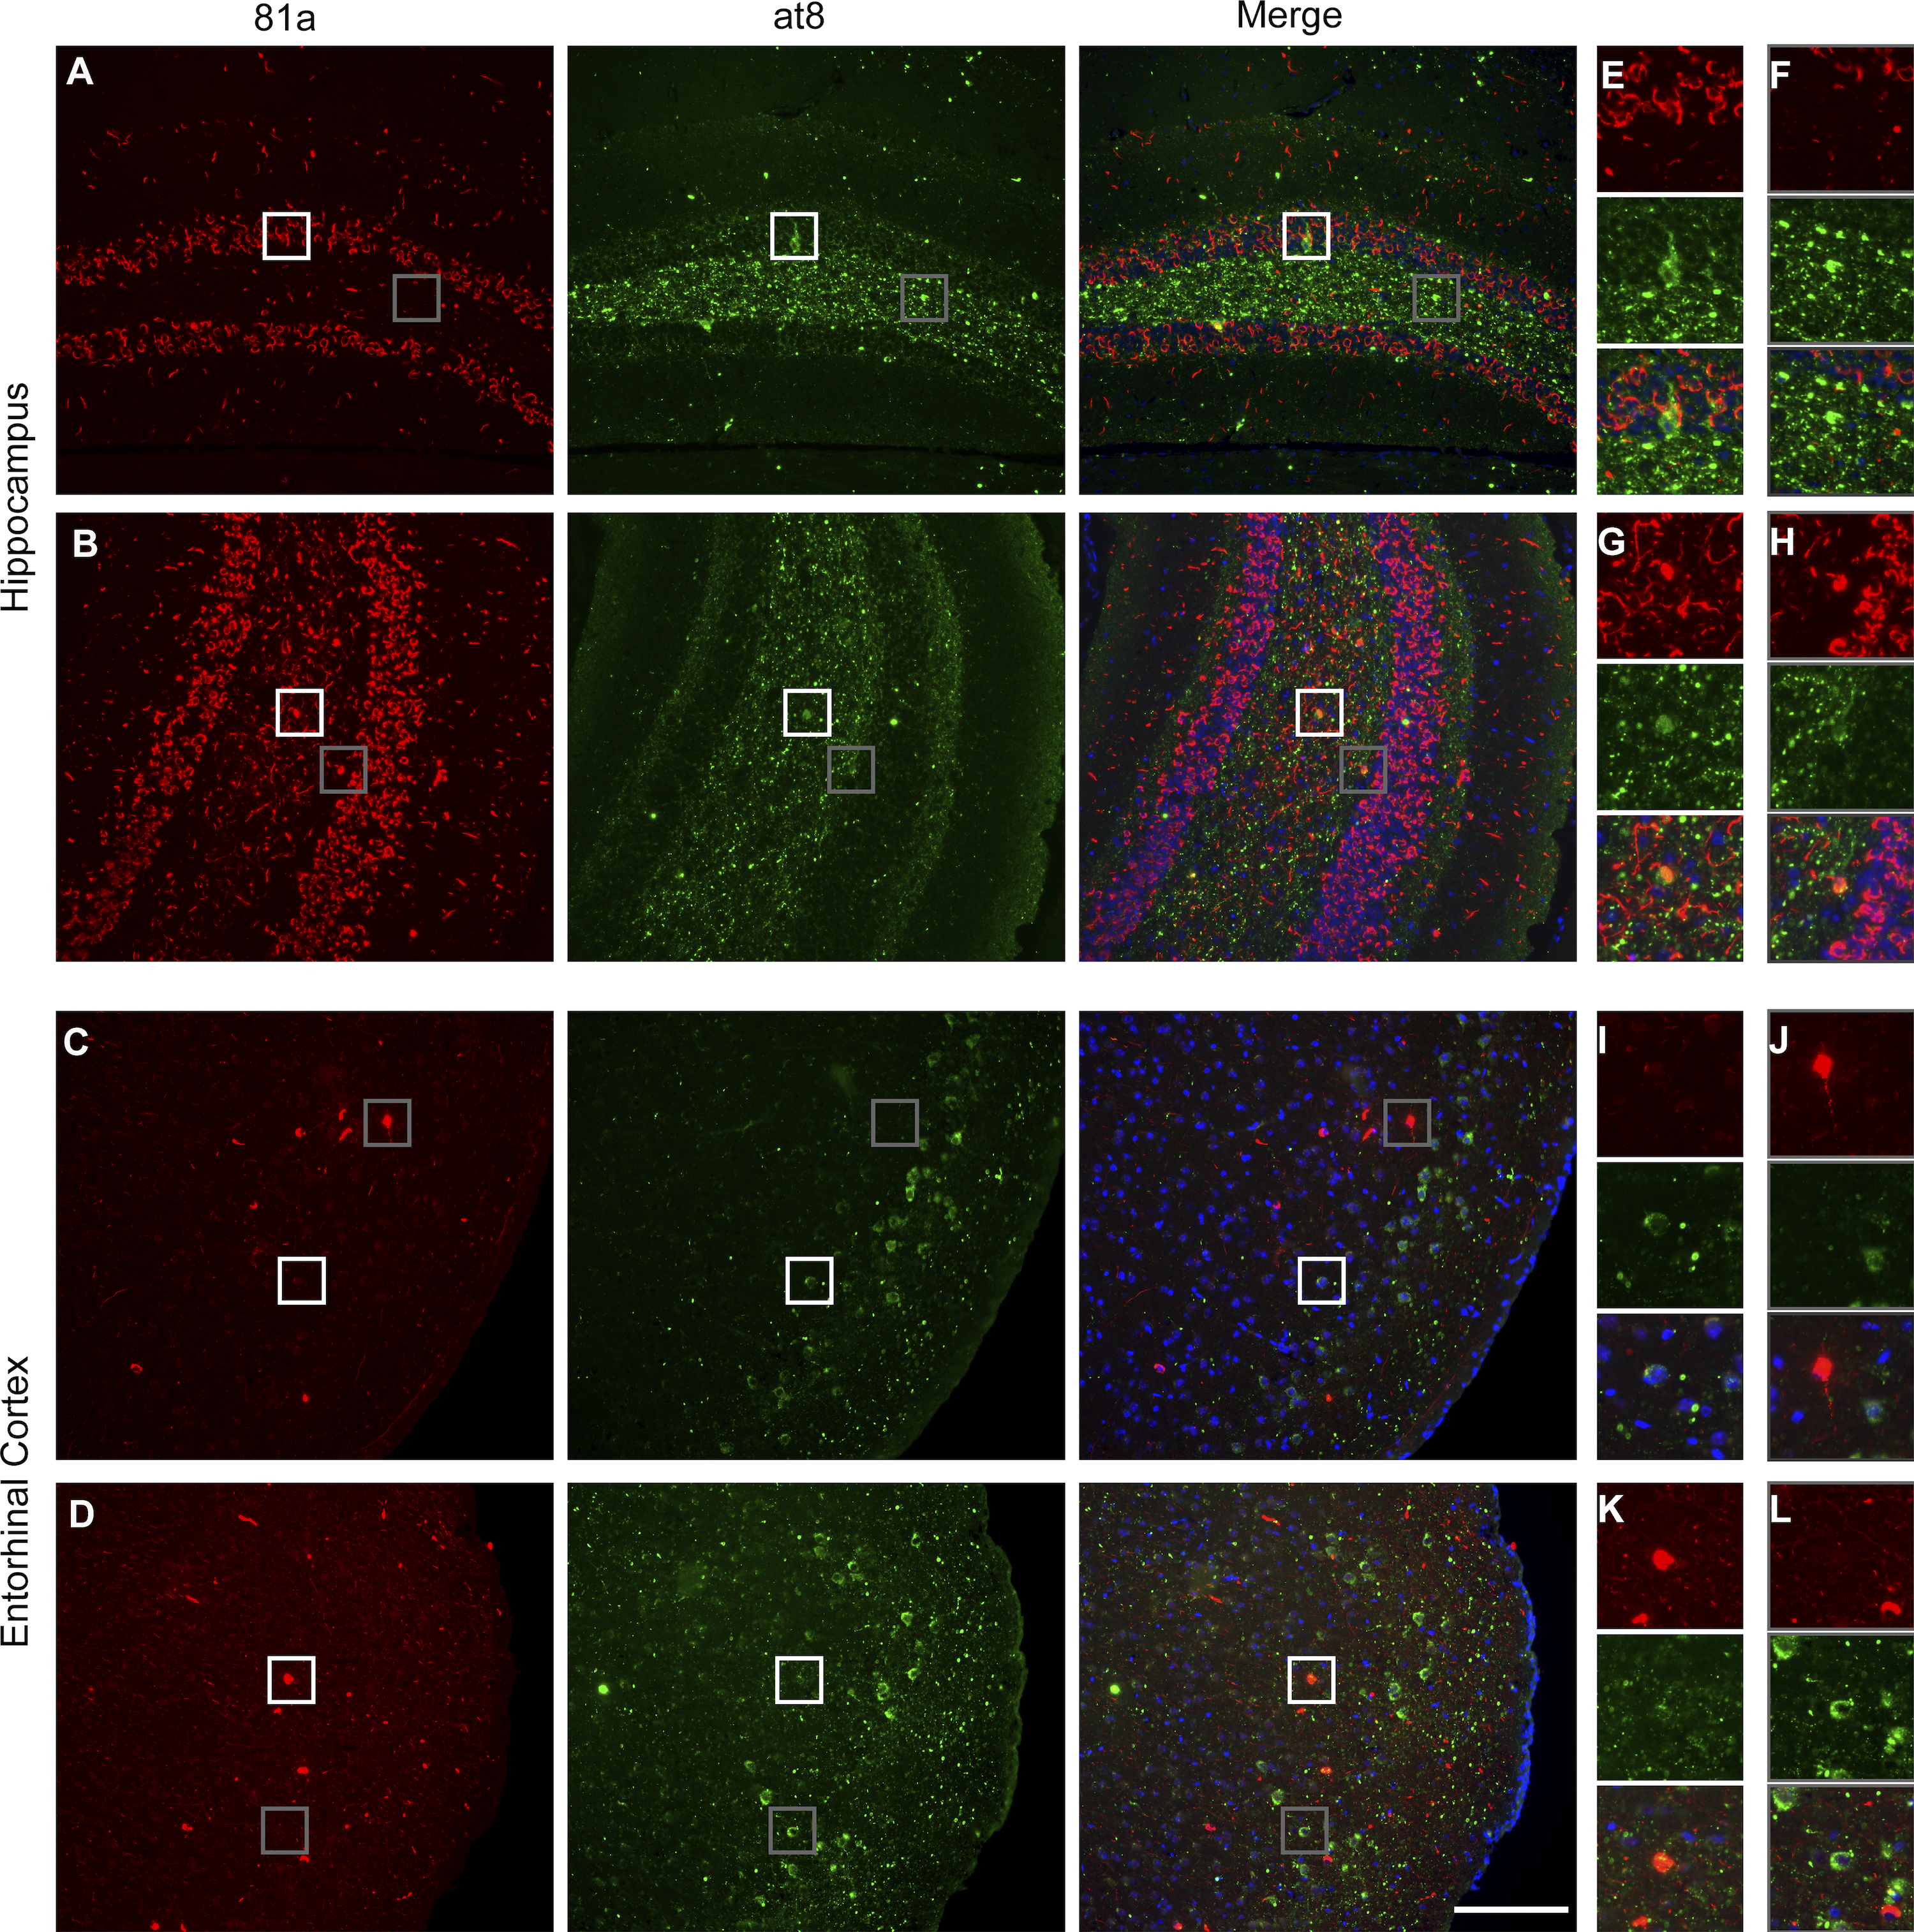
α-Syn and tau pathology are rarely localized in the same neuron.
(A–D) Immunofluorescence staining showing rare colocalization of p-α-syn (red) and p-tau (green) in the hippocampus (A and B) and entorhinal cortex (C and D). (E–L) Representative images of select magnified areas from the hippocampus (E–H) and entorhinal cortex (I–L) showing α-syn and tau localization in different compartments of the same cell (see boxed portions of the images) and enlargements ofthese boxed images along the righthand margin of the main figures. Scale bar, 100 µm. All experimental data were verified in at least two independent experiments.
In vitro modeling of α-syn and tau copathology
To further confirm the previous in vivo findings, we transduced WT mouse hippocampal neurons with AD-tau, α-syn mpffs, or combined AD-tau/α-syn mpffs (Fig. 4). α-Syn mpff transduction resulted in abundant p-α-syn pathology in WT neurons, while AD-tau transduction did not lead to p-α-syn pathology (Fig. 4, A, B, and F). Similar to our in vivo findings, transduction of AD-tau and α-syn mpffs together did not influence α-syn pathology burden, as p-α-syn levels were comparable to neurons transduced with α-syn mpffs alone (Fig. 4, A, C, and F), but AD-tau transduction resulted in a significant increase in insoluble neuritic tau pathology (Fig. 4, A, B, and E). Unlike the inability of AD-tau to induce p-α-syn pathology, transduction with α-syn mpffs resulted in an increase in insoluble tau pathology in neuronal cell body (Fig. 4, A–D). However, the transduction with mixed AD-tau/α-syn mpffs resulted in a significant increase in pathological tau in neuronal perikarya when both groups are compared (Fig. 4, A–E). We therefore went on to further assess the ability of tau pathology to be induced by α-syn mpff transduction in vitro (Fig. 4, G–I). Transduction with α-syn mpffs resulted in the appearance of tau inclusions in neurons that also were p-α-syn positive (Fig. 4 G). Importantly, immunoelectron microscopy of tau and α-syn showed that both proteins were found in close proximity raising the possibility that tau and α-syn may directly interact with each other (Fig. 4 J). AD-tau/α-syn mpff transduction induced a significant increase in tau-positive neurons in vitro that was found either in the same neuron that is positive for p-α-syn or in neurons that were devoid of p-α-syn pathology (Fig. 4, H and I). These findings also point to possible routes through which α-syn can influence tau pathogenesis indirectly.
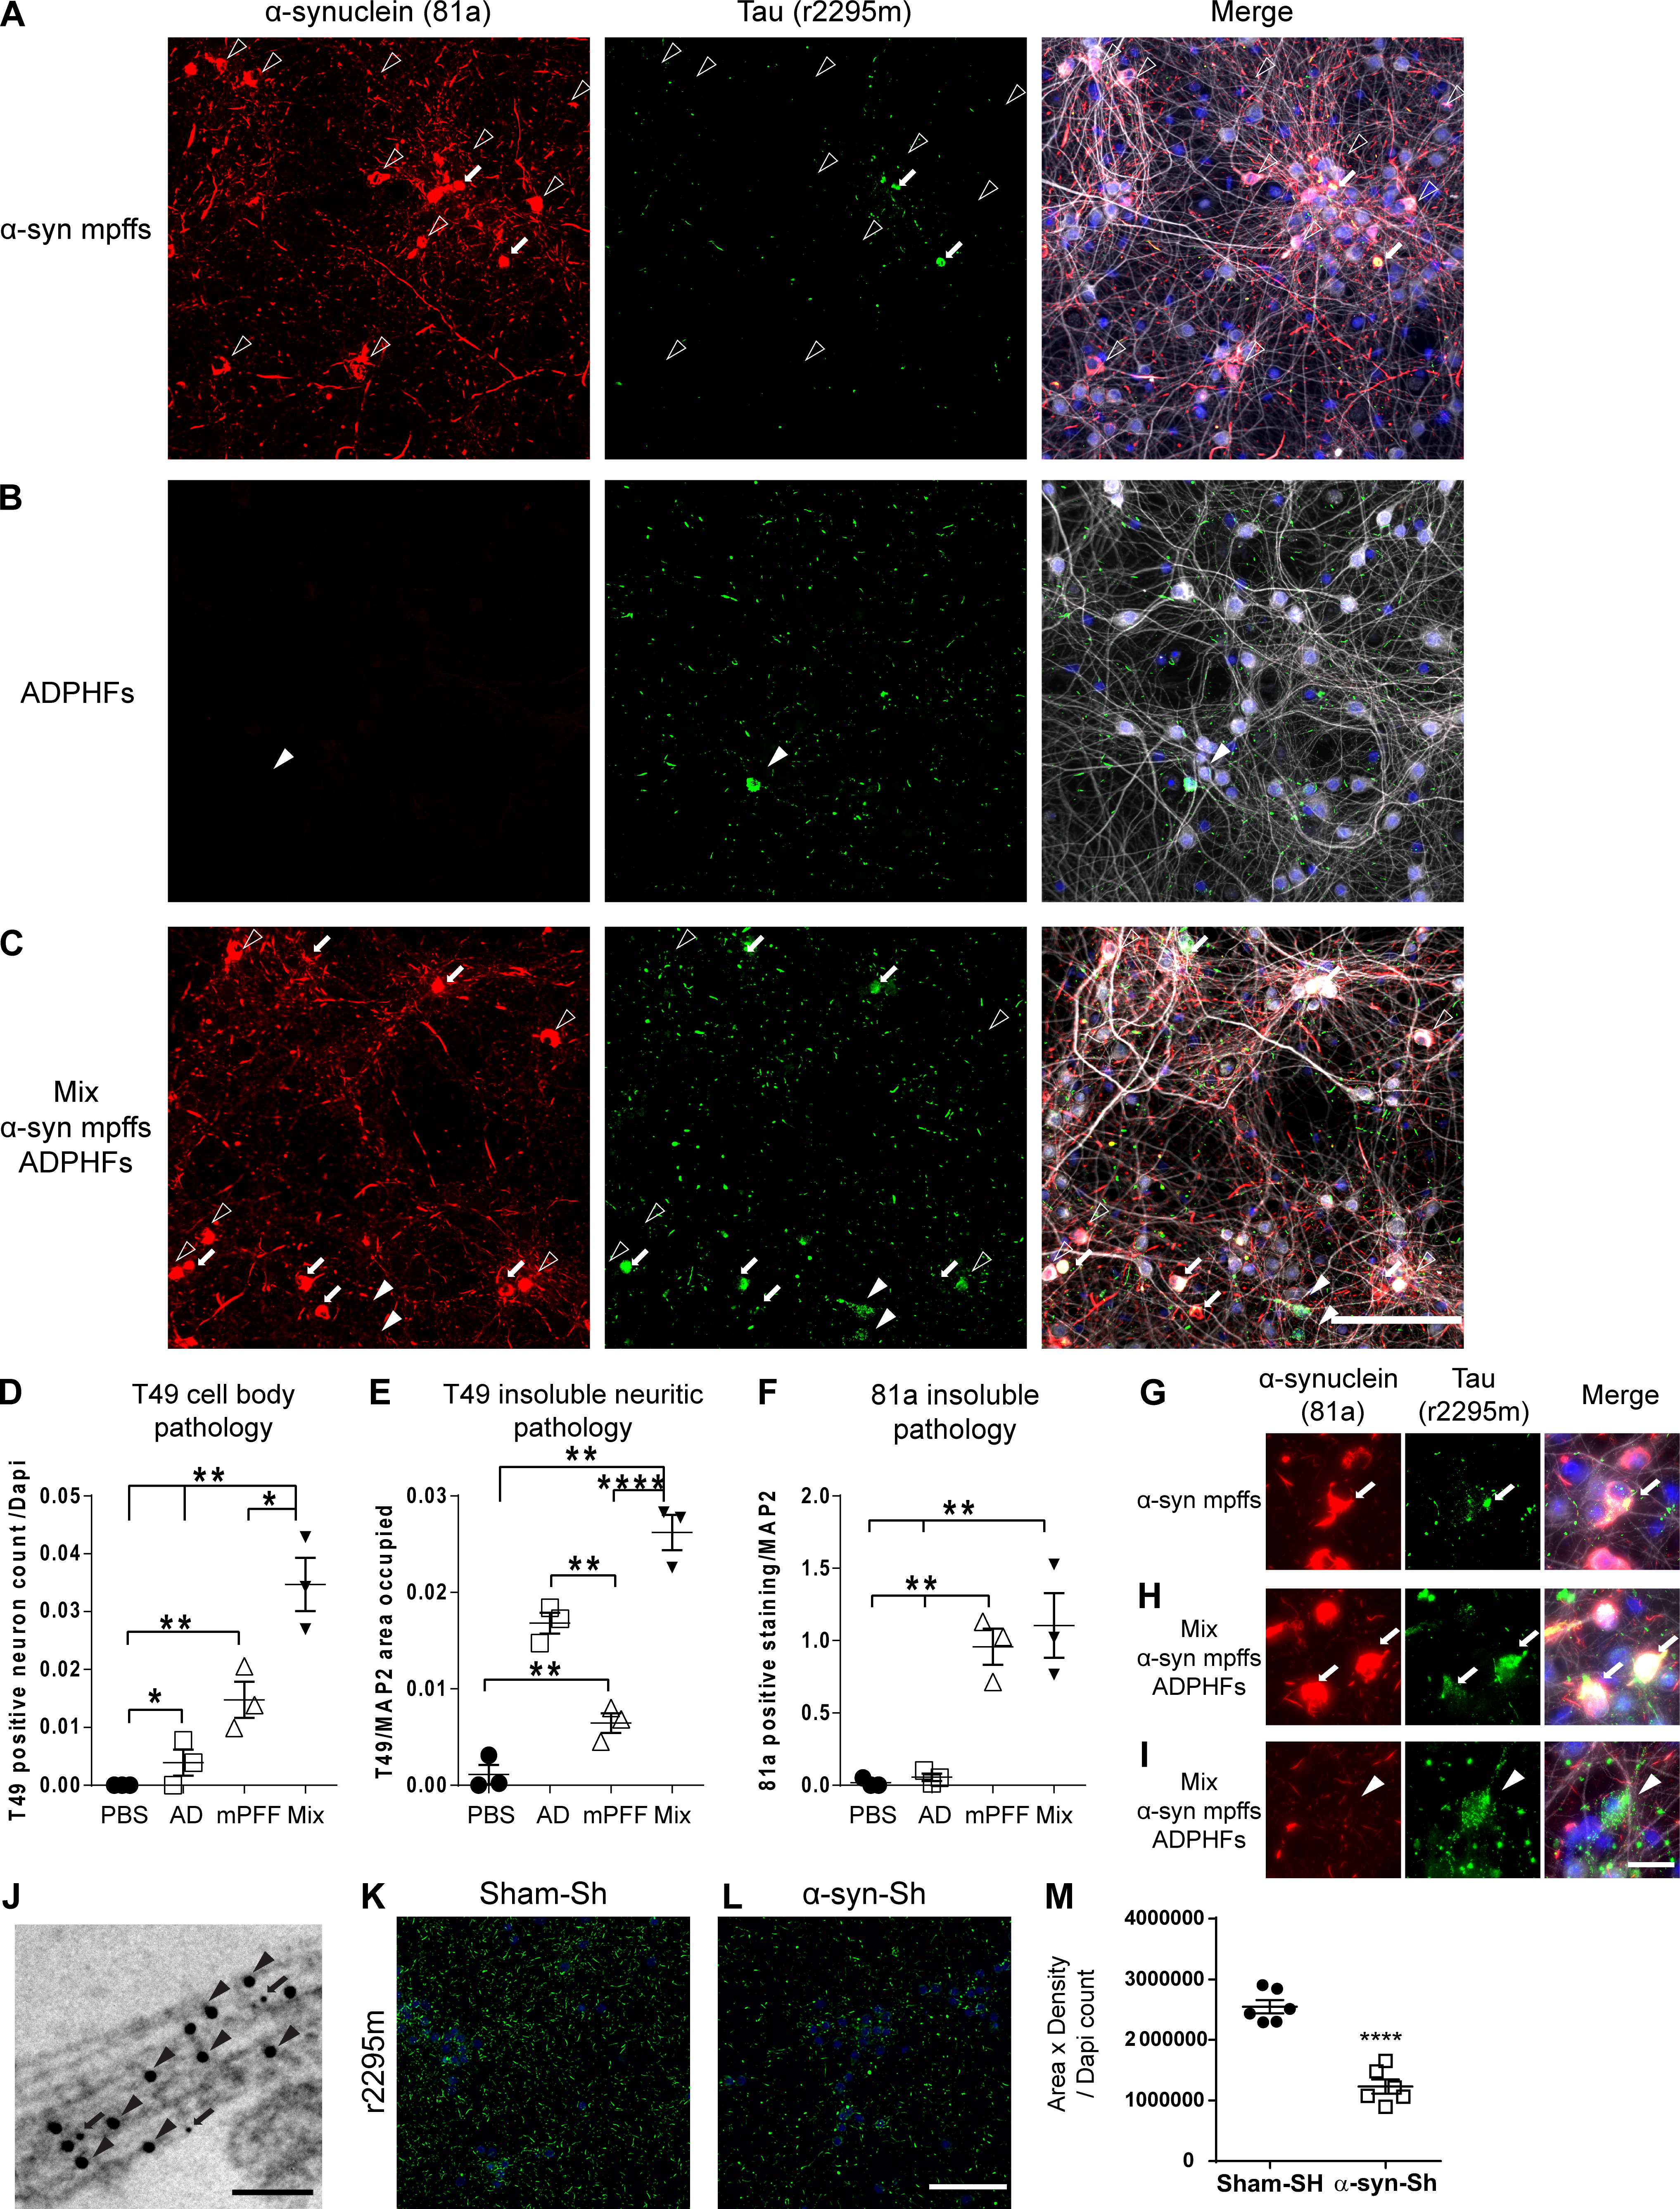
In vitro modeling of p-α-syn and p-tau copathology recapitulates in vivo data. (A–I) IF double labeling shows p-α-syn pathology (red) and increased p-tau pathology (green) in neurons transduced with AD-tau–enriched extracts and α-syn mpffs combined (C, H, and I) compared with α-syn mpffs (A and G) or AD-tau–enriched extracts (B) alone. Scale bar, 50 µm. P-tau pathology is seen in both α-syn mpff–transduced neurons (G) and after combined treatment with α-syn mpffs/AD-tau–enriched extracts (H and I); in combined treatment, p-tau pathology can be seen in cells where p-α-syn pathology is present (H) or absent (I). (G–I) Arrows point to colocalized α-syn and tau pathology in primary neurons while arrowheads point to the presence of tau pathology in the absence of α-syn pathology. Quantification of cell body tau (D), insoluble neuritic tau (E), and p-α-syn (F) pathology seen in A–C. One-way ANOVA followed by Tukey’s post-hoc analysis was used to analyze the data (three repeats). (J) Immunoelectron microscopy shows tau (arrows) and α-syn (arrow heads) in proximity. Scale bar, 100 nm. (K and L) IF for insoluble tau (green) of WT mouse neurons treated with human AD-tau–enriched extracts and either sham shRNA (K) or α-syn shRNA (L). (M) Quantification of p-tau pathology showing a significant reduction in insoluble tau pathology in α-syn shRNA-treated neurons. A two-tailed t test was performed to calculate the difference between groups; *, P < 0.05; **, P < 0.01; ****, P < 0.0001. Data are presented as mean ± SEM (n = 6–7 replicates). All experimental data were verified in at least two independent experiments.
α-Syn as a modulator of tau spreading
Prior studies have shown that α-syn can cross-seed tau, leading to its fibrilization and aggregation (Giasson et al., 2003; Guo et al., 2013; Castillo-Carranza et al., 2018; Bassil et al., 2020). To further understand how α-syn influences tau pathogenesis, we injected AD-tau into the brain of α-synKO mice and compared them to WT littermates.
Consistent with data described above (Fig. 3 and Fig. S2 B), we observed an overall decrease in p-tau staining in the α-synKO mice compared with WT littermates (Fig. 5). Quantification of p-tau in the ipsilateral hippocampus showed no differences between groups (Fig. 5, A and F). However, the spread of p-tau to the contralateral hippocampus was significantly reduced in α-synKO mice (Fig. 5, A and G). To compare the differences in p-tau transmission and spreading in WT and α-synKO mice, we quantified p-tau in regions with known hippocampal connections using a semiquantitative analysis of pathological p-tau levels in the whole brain (Oh et al., 2014; Fig. 5). A dramatic decrease in p-tau spreading was observed in α-synKO mice compared with WT littermates in cortical regions connected to the injection site (Fig. 5). Comparison of p-tau in the entorhinal cortex in α-synKO versus WT mice showed that in α-synKO mice, there was a significant decrease in p-tau pathology at 3 mpi and 6 mpi in the ipsilateral hemisphere in addition to a decrease in p-tau pathology levels at 6 mpi and 9 mpi in the contralateral hemisphere (Fig. 5, B, H, and I). The general reduction in p-tau levels in the entorhinal cortex of the α-synKO mice was mirrored by a significant reduction of p-tau–positive neurons and subsequently neurites in α-synKO mice compared with WT littermates (Fig. 5, Q–T). Similarly, p-tau levels were significantly reduced in the retrosplenial cortex of the α-synKO mice compared with WT littermates at 9 mpi in the ipsilateral hemisphere and 3 mpi and 6 mpi in the contralateral hemisphere (Fig. 5, C, J, and K). Neuritic tau pathology in α-synKO mice was significantly reduced, and the appearance of such pathology was delayed until 9 mpi. Similar to our in vivo findings, knockdown of α-syn in WT neurons resulted in a significant reduction in tau pathology compared with sham-treated neurons (Fig. 4 K). Quantification of p-tau in the auditory cortex in α-synKO mice revealed a significant decrease in p-tau pathology levels in the ipsilateral hemisphere at 3, 6, and 9 mpi (Fig. 5, D and L). Similarly, the contralateral hemisphere of α-synKO mice showed reduced p-tau levels compared with WT littermates (Fig. 5, D and M). Finally, p-tau levels in the ipsilateral supramammillary nucleus of α-synKO mice were significantly reduced at 3 and 6 mpi compared with WT mice (Fig. 5, E and N). Moreover, p-tau levels were also decreased in the contralateral hemisphere of the supramammillary nucleus in α-synKO mice at 3 mpi compared with their WT littermates (Fig. 5, E and O). While p-tau levels were significantly reduced in α-synKO compared with WT mice injected with AD-tau, both groups showed a similar transmission pattern of tau pathology in the brain (Fig. 5 P). Our analysis of tau spreading is summarized in a semiquantitative heat map shown in Fig. 5 P. Hippocampal injections resulted in bilateral spreading of tau pathology in WT mice as early as 3 mpi while the absence of α-syn in the α-synKO mice resulted in a delayed appearance of the pathology to 6 mpi. Importantly, the reduction in tau spreading in the brain was not due to an overall decrease in vesicular trafficking or alteration to the neuronal connectivity as control experiments showed that these two aspects are intact in α-synKO mice (Fig. S4). Thus, the above findings show that in the absence of α-syn, there is a reduction in the extent of tau pathology burden, as well as spreading rate.
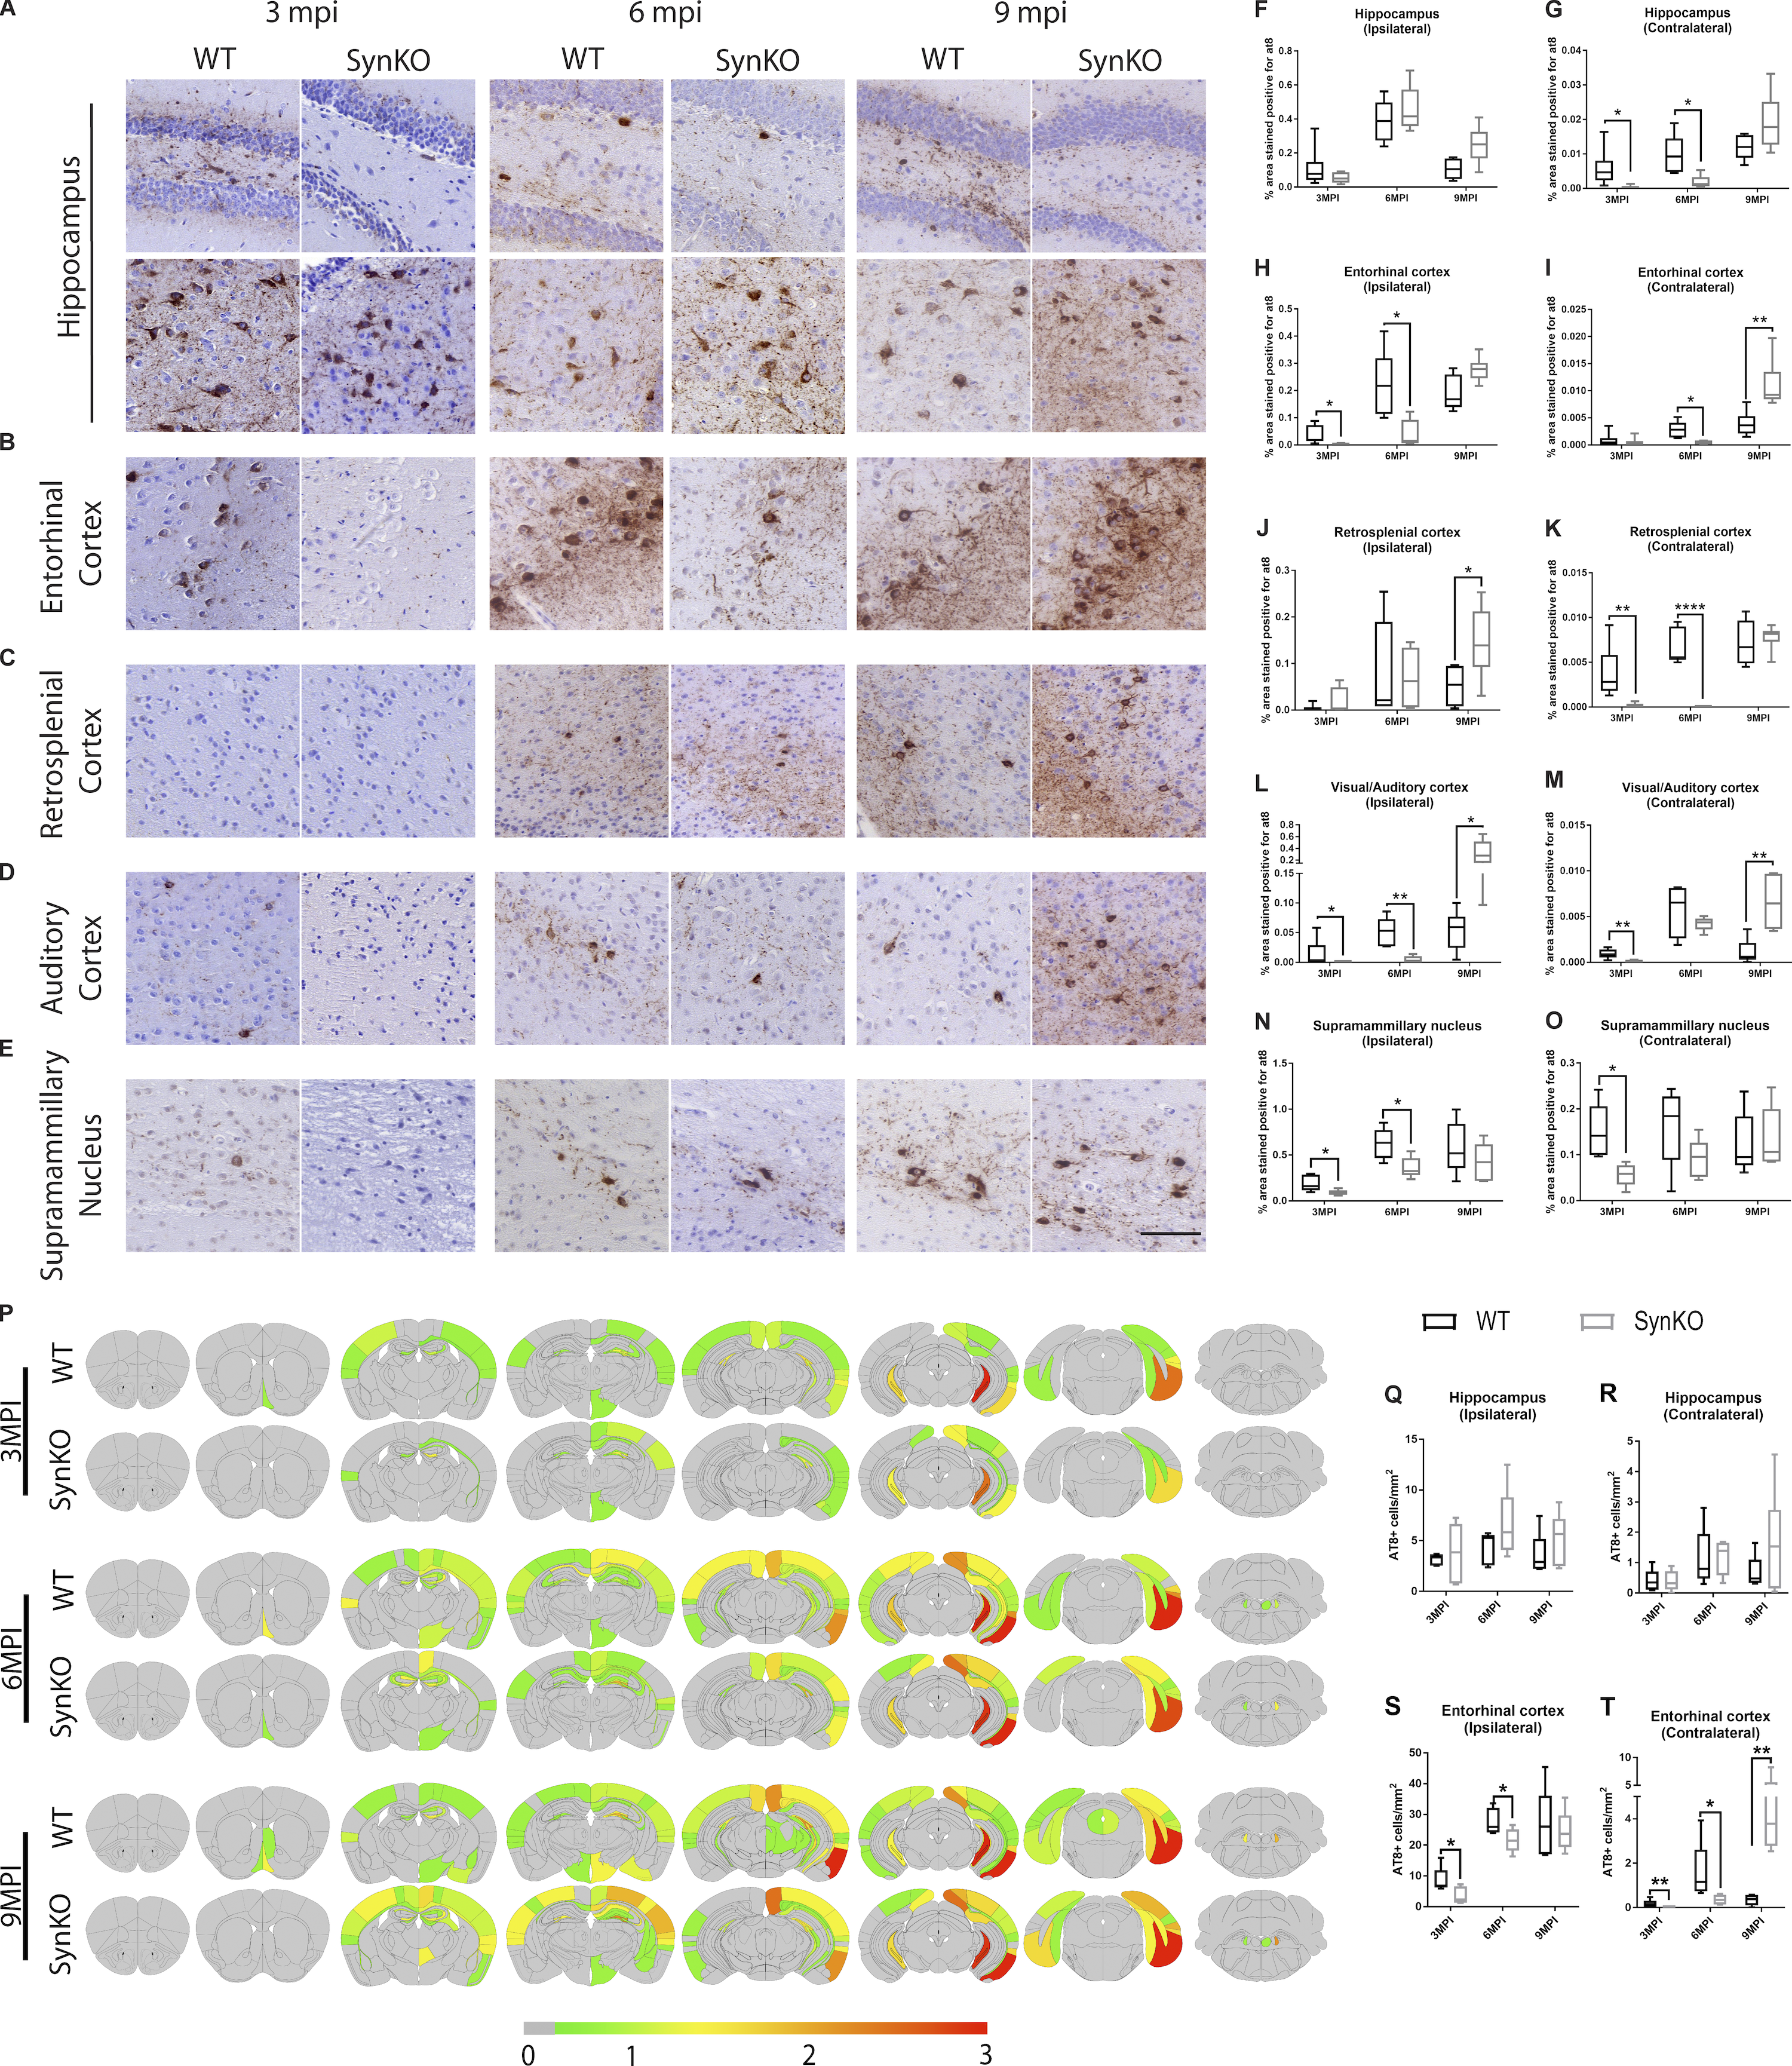
α-Syn expression modulates pathology spread after AD-tau extract injection.
(A–E) Representative images for AT8 p-tau pathology in tissue sections from the rostral and caudal hippocampus (A), entorhinal cortex (B), retrosplenial cortex (C), auditory cortex (D), and supramammillary nucleus (E) of WT and α-synKO mice 3, 6, or 9 mpi of AD-tau–enriched extracts. Scale bar, 100 µm. (F–O) Quantification of p-tau seen in A–E in the ipsilateral (F) and contralateral (G) hippocampus, ipsilateral (H) and contralateral (I) entorhinal cortex, ipsilateral (J) and contralateral (K) retrosplenial cortex, ipsilateral (L) and contralateral (M) auditory cortex, and ipsilateral (N) and contralateral (O) supramammillary nucleus. A two-tailed t test was performed to calculate the difference between groups; *, P < 0.05; **, P < 0.01; ****, P < 0.0001. Data are presented as mean ± SEM (n = 5–9 mice per group). (P) Semiquantitative heat mapping of p-tau pathology in WT and α-synKO mice injected with human AD-tau–enriched extracts. (Q–T) Quantification of p-tau–positive neurons in the ipsilateral hippocampus (Q), contralateral hippocampus (R), ipsilateral entorhinal cortex (S), and contralateral entorhinal cortex (T) of WT and α-synKO mice injected with human AD-tau extract 3, 6, or 9 mpi. A two-tailed t test was performed to calculate the difference between groups; *, P < 0.05; **, P < 0.01. Data are presented as mean ± SEM (n = 5–6 mice per group). All experimental data were verified in at least two independent experiments.
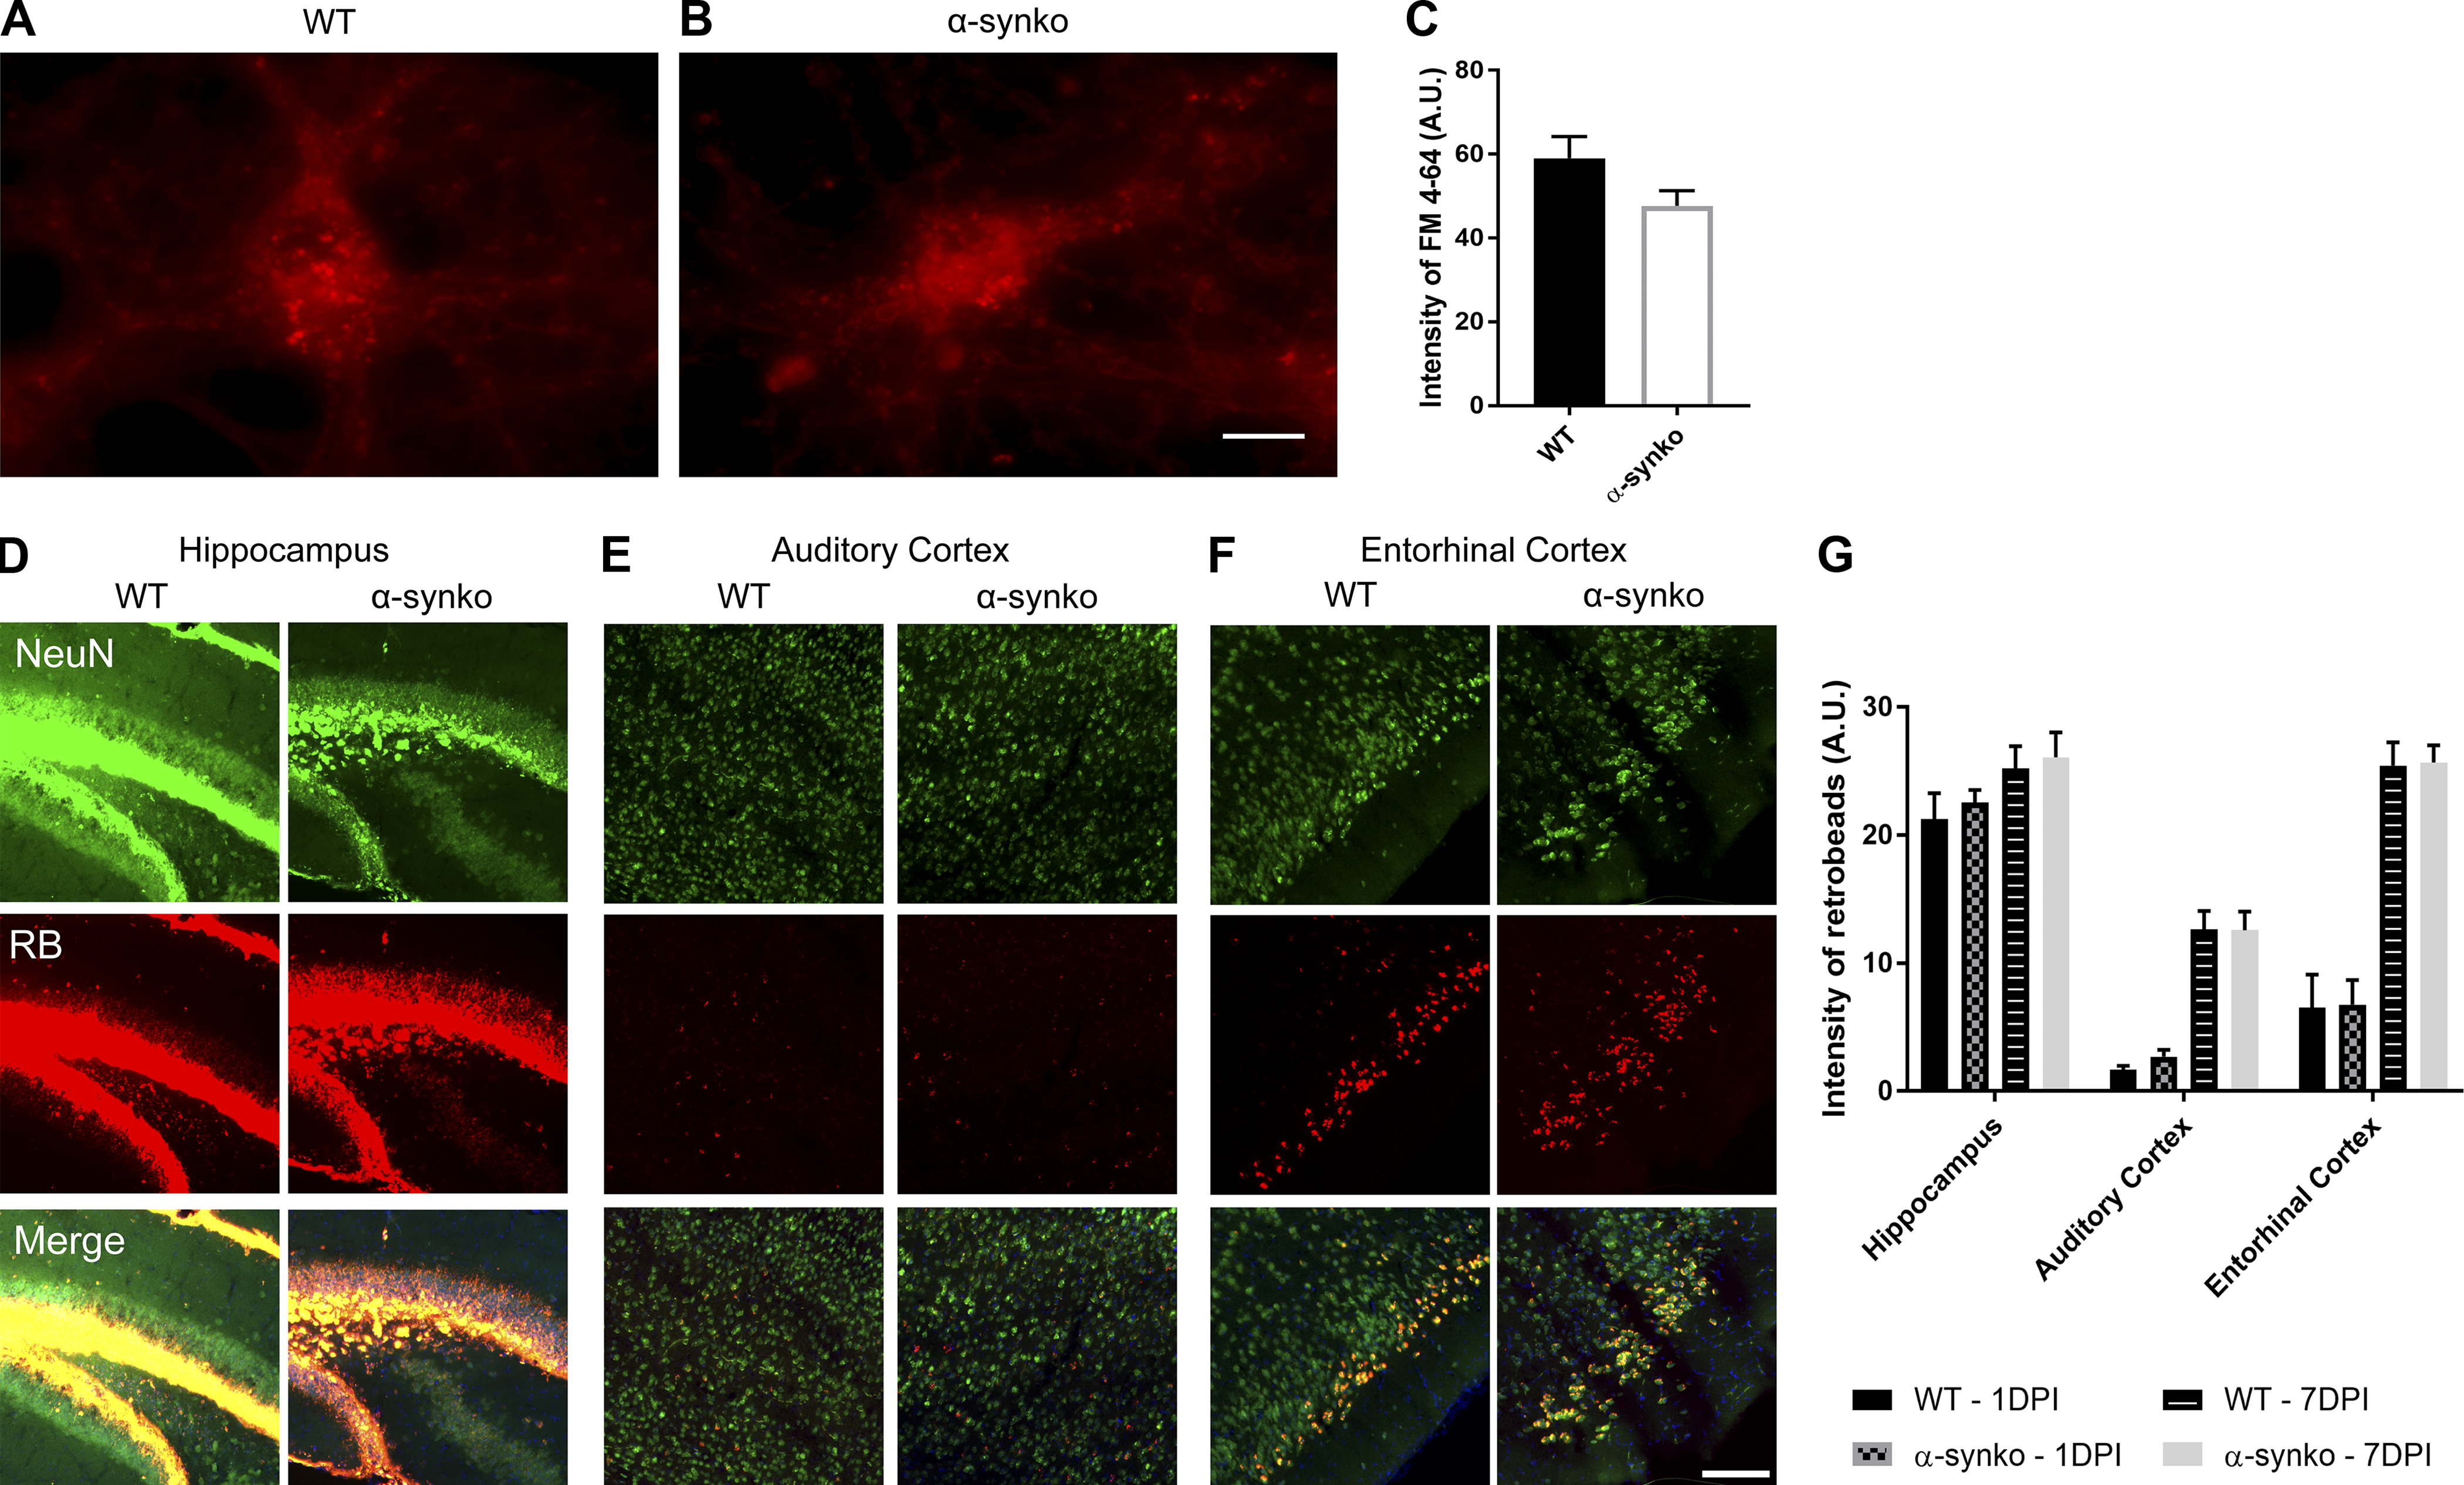
α-Syn knockout does not affect vesicular trafficking, neuronal uptake, or connectivity.
(A and B) WT (A) and α-synKO (B) mouse neurons treated with FM 4–64 (red dye). Scale bar, 20 µm. (C) Quantification of FM 4–64 uptake. A two-tailed t test was performed to calculate the difference between groups. (D–F) Hippocampus (D), auditory cortex (E), and entorhinal cortex (F) of WT and α-synKO mice injected with retrobeads (RB). Scale bar, 100 µm. (G) Quantification of retrobeads 1 and 7 d after injection. A two-tailed t test was performed to calculate the difference between groups. All experimental data were verified in at least two independent experiments. A.U., arbitrary units.
Tau is not essential for α-syn seeding and spreading
While our data showed that α-syn can modulate tau spreading in the brain, we asked whether this interaction is mutual and if tau can modulate α-syn spreading. To address this question, we injected α-syn mpffs into the brain of mice without tau (tauKO) and analyzed α-syn spreading compared with WT littermates (Fig. 6). Analysis of p-α-syn pathology burden revealed no significant differences between WT mice and tauKO mice at the injection site (Fig. 6, B and C). Similarly, no significant differences were found in p-α-syn burden in the connected regions at the different time points analyzed (Fig. 6, D–I). Moreover, the spreading pattern of α-syn was similar in tauKO mice compared with WT mice (Fig. 6 J). Finally, p-α-syn staining morphology was not altered in the absence of tau (Fig. 6 A).
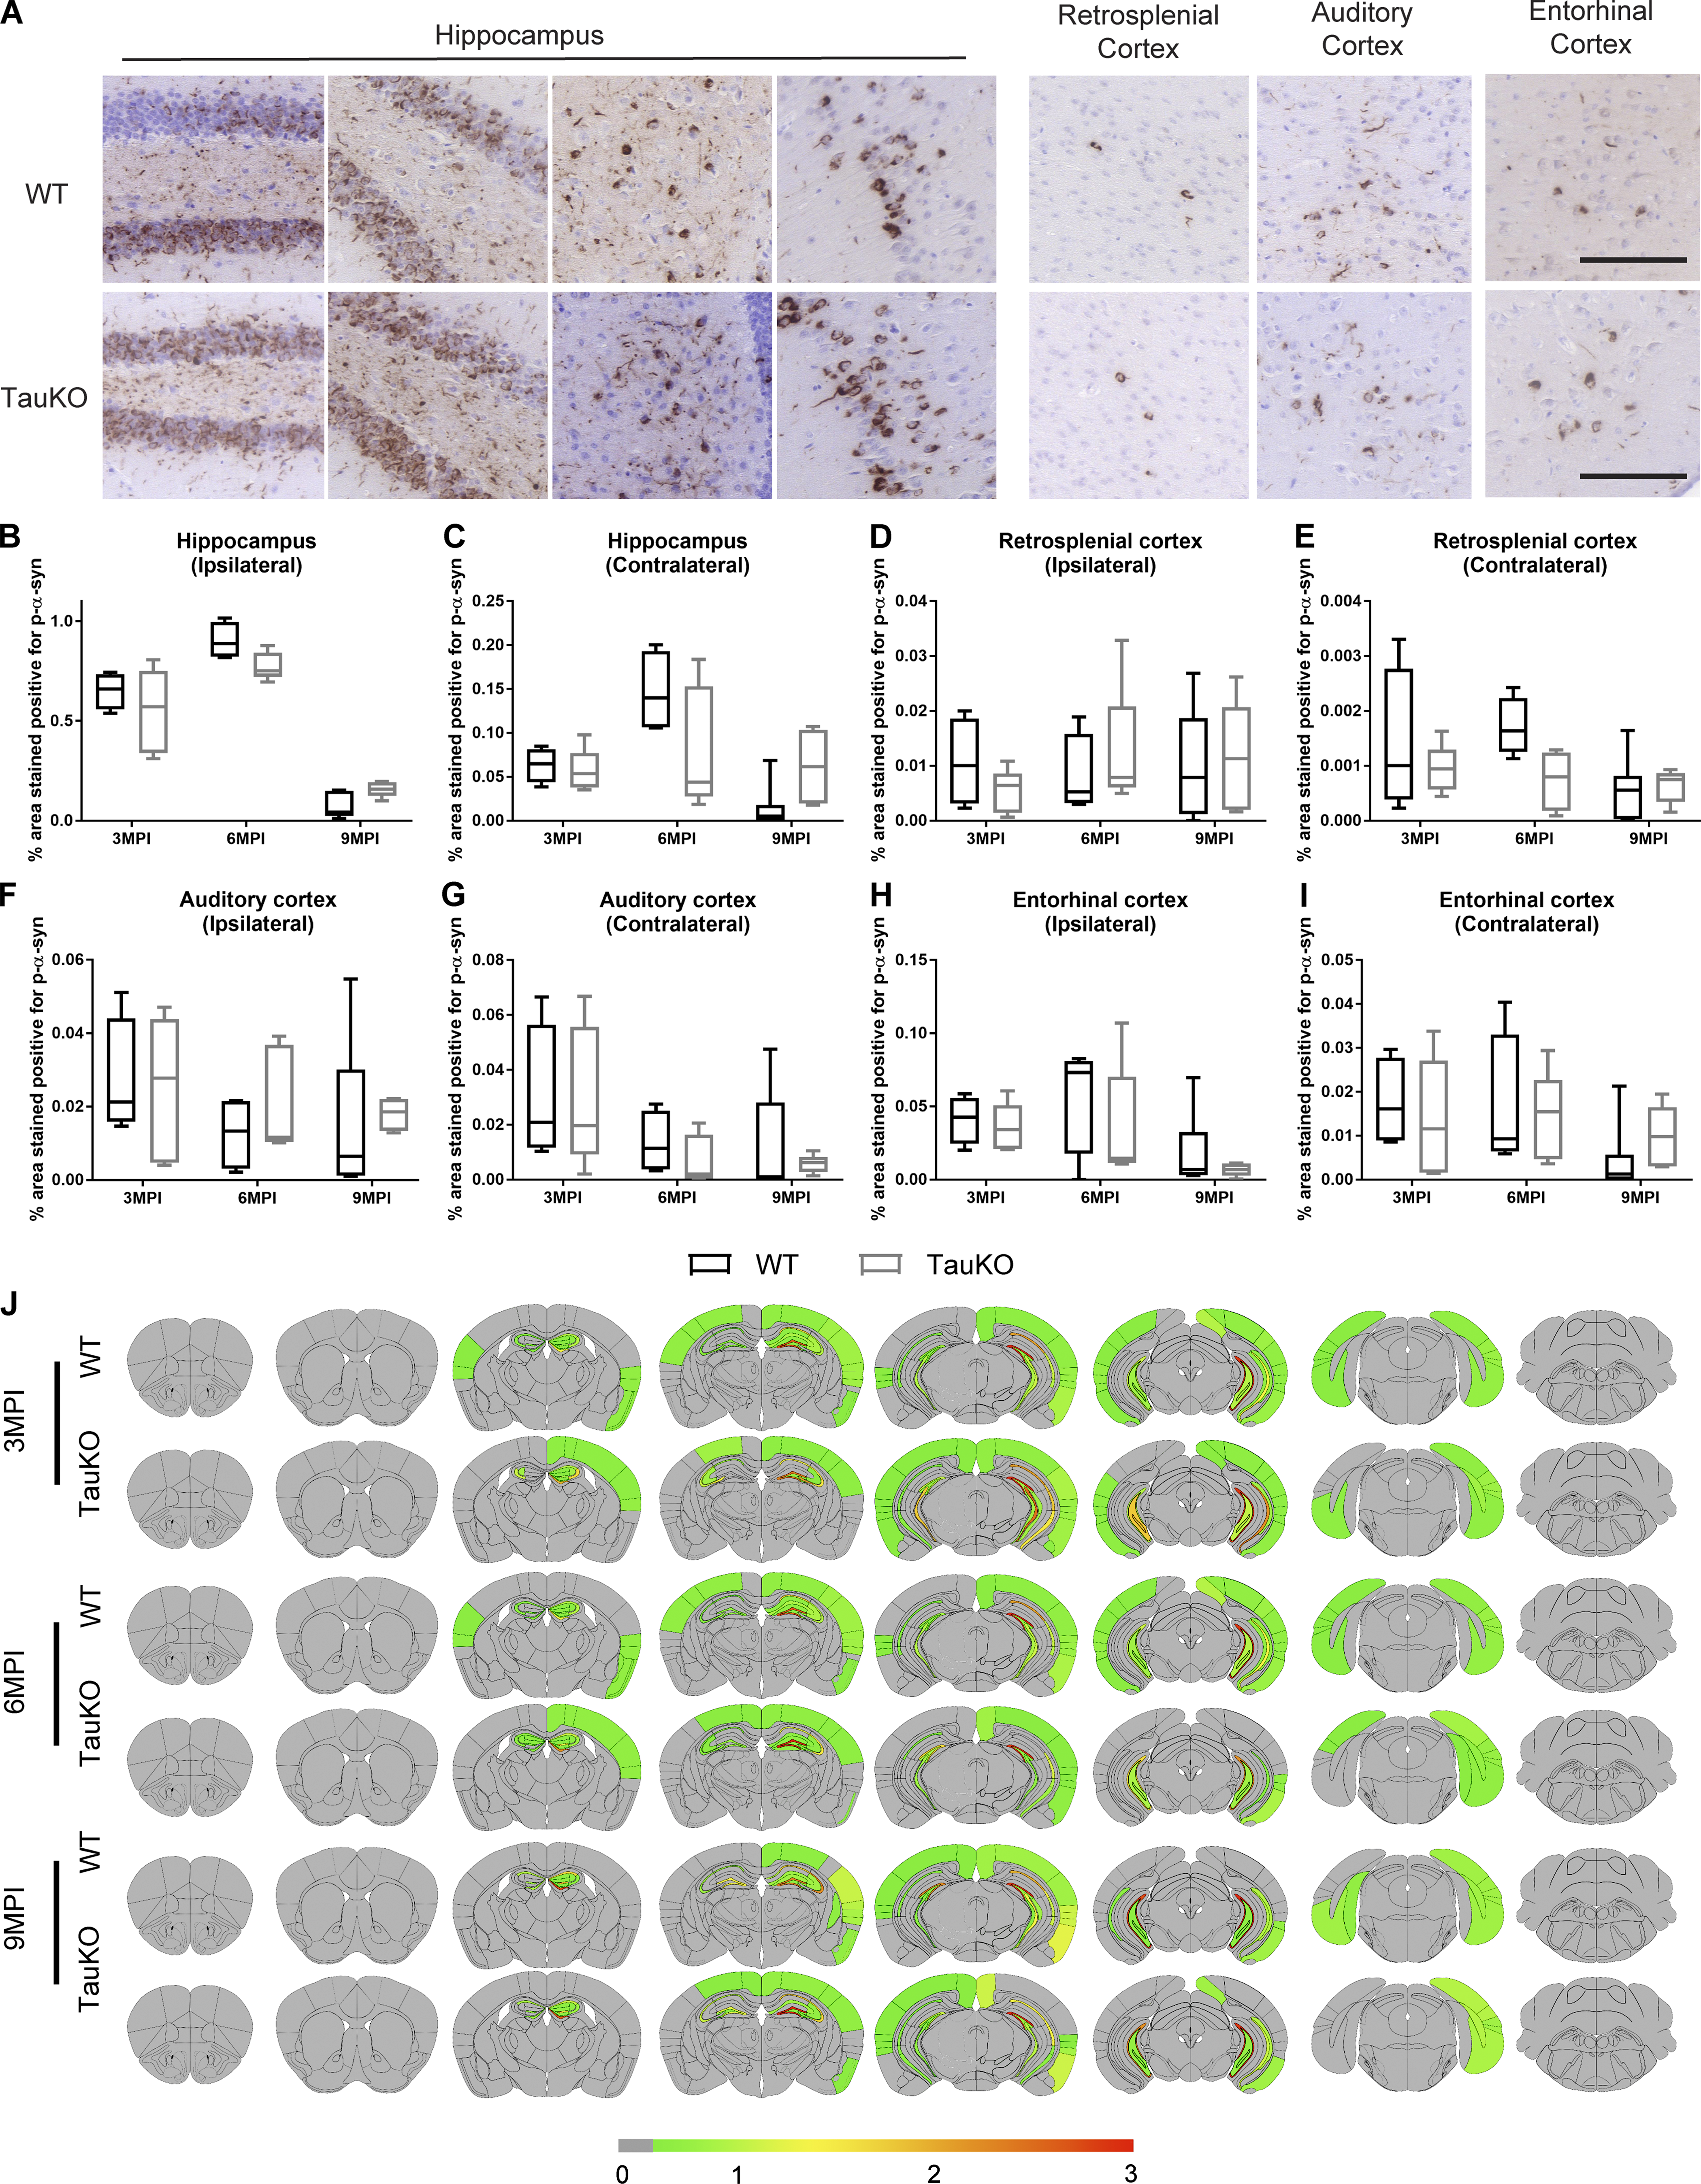
Tau expression is not required for α-syn pathology spread after mpff brain injections.
(A) Representative images for p-α-syn pathology in tissue sections from the rostral, caudal, and CA1 region of the hippocampus, entorhinal cortex, retrosplenial cortex, and auditory cortex of WT and tauKO mice at 3, 6, or 9 mpi of α-syn mpffs. Scale bars, 100 µm. (B–I) Quantification of p-α-syn seen in A in the ipsilateral (B) and contralateral (C) hippocampus, ipsilateral (D) and contralateral (E) retrosplenial cortex, ipsilateral (F) and contralateral (G) auditory cortex, and ipsilateral (H) and contralateral (I) entorhinal cortex. A two-tailed t test was performed to calculate the difference between groups. Data are presented as mean ± SEM. (J)Semiquantitative heat mapping of p-α-syn pathology in WT and tauKO mice injected with α-syn mpffs (n = 4–7 mice per group). All experimental data verified in at least two independent experiments.
The effect of α-syn, tau, and comorbid pathology on modulators of phosphorylation
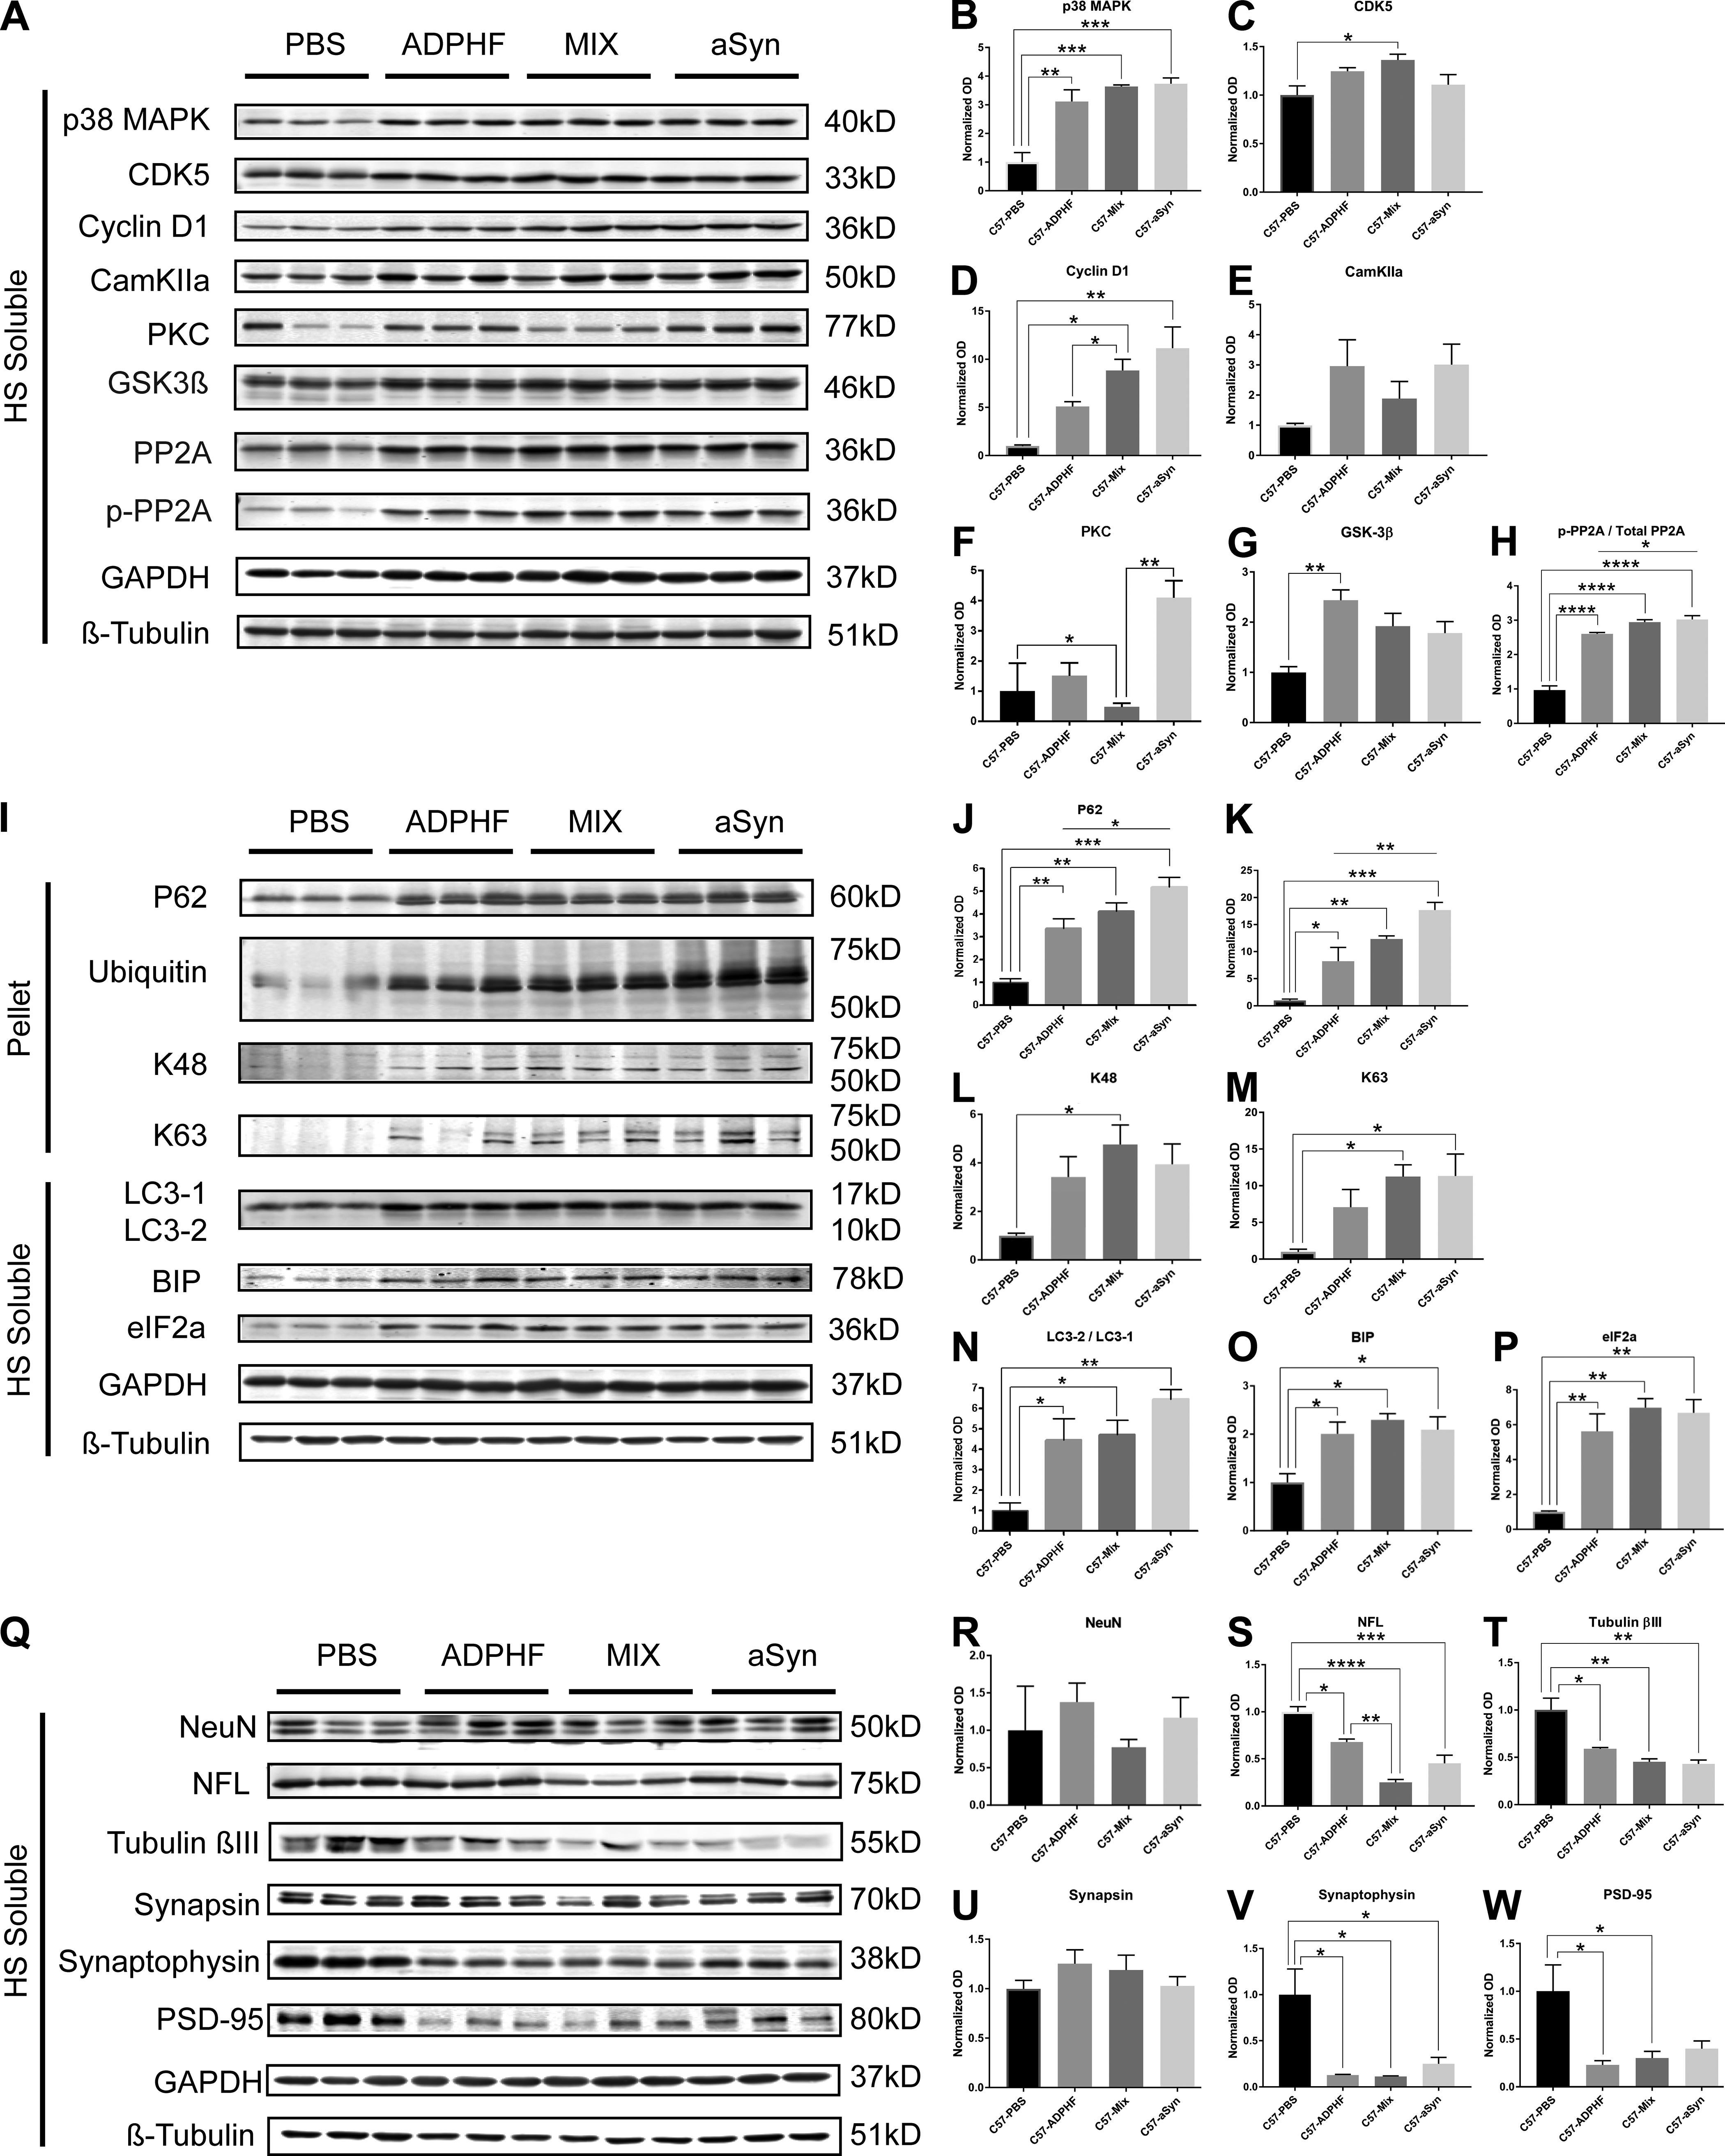
Based on the results obtained, we assessed markers of tau phosphorylation in the brain of WT mice injected with α-syn mpffs, AD-tau, or a mixture of AD-tau/α-syn mpffs (Fig. S5 A). Western blot analysis showed a significant increase in two tau kinases, p38 MAPK and Cyclin D1, in all three groups compared with PBS-injected WT mice (Fig. S5, A, B, and D). Interestingly, CDK5 levels were significantly increased in the AD-tau/α-syn mpff group compared with PBS-injected WT mice, while CDK5 levels in AD-tau or α-syn mpff–injected mice were similar to PBS-injected WT mice (Fig. S5, A and C). CamKIIa levels were increased in AD-tau, α-syn mpff, and AD-tau/α-syn mpff groups, albeit the increase was not significant (Fig. S5, A and E). Interestingly, α-syn mpff–injected mice showed a significant increase in protein kinase C (PKC) levels compared with the other groups, while PKC levels were decreased in combined AD-tau/α-syn mpff–injected mice (Fig. S5, A and F). GSK-3β levels were significantly increased in the AD-tau–injected WT mice compared with PBS-injected mice (Fig. S5, A and G). Finally, we measured levels of PP2α, a tau dephosphorylating enzyme. PP2α is inhibited when phosphorylated on Tyr307. We thus used anti-p307-PP2α to measure the activity levels of the dephosphorylating enzyme. Importantly, p-PP2α levels were significantly increased in all three injected groups compared with the PBS-injected group, indicating that tau dephosphorylation is decreased after AD-tau, α-syn mpffs, or the combination of AD-tau/α-syn mpffs (Fig. S5, A and H).
The effect of α-syn, tau, and combined pathology on modulators of phosphorylation, protein clearance, and cell viability markers.
(A–W) Immunoblot analysis probing for modulators of phosphorylation (A–H), protein clearance mechanisms (I–P), and neuronal and synaptic markers (Q–W) were conducted on protein samples from the hippocampus of 4.5 and 6 mpi WT mice injected with PBS, AD-tau–enriched extracts alone, AD-tau combined with α-syn mpffs, or α-syn mpffs alone. (B and C) Statistical analysis shows a significant increase in p38MAPK in all three injected groups compared with PBS-injected WT mice (B), while a significant increase in CDK5 was observed in mice injected with AD-tau combined with α-syn mpffs compared with PBS-injected WT mice (C). (D and E) A significant increase in Cyclin D1 was observed in all three injected groups compared with PBS-injected WT mice (D), while CamKIIa levels were increased in all three injected groups compared with PBS-injected mice, though the results were not significant (E). (F and G) Statistical analysis showed a significant reduction of PKC levels in mice injected with AD-tau combined with α-syn mpffs (F), while a significant increase in GSK-3β levels was found in AD-tau–injected mice compared with PBS-injected mice (G). (H) Statistical analysis showed a significant increase in the inhibition of tau dephosphorylation enzyme p-PP2A in all three groups compared with PBS-injected mice. (I–P) Immunoblot probing for modulators of protein clearance mechanisms (I) showed a significant increase in p62 (J), ubiquitin (K), K63 (M), LC3-1/2 (N), BIP (O), and eiF2α (P) in all injected groups compared with PBS-injected control mice. An increase in K48 levels was reported in all groups compared with PBS-injected mice, albeit only significant in AD-tau combined with α-syn mpff–injected mice (L). (Q–U) Immunoblot probing for neuronal and synaptic markers (Q) showed no significant difference in NeuN (R) and a significant decrease in NFL levels in the AD-tau combined with α-syn mpff–injected mice compared with the PBS-injected group (S); a significant decrease in tubulin βIII (T), synaptophysin (V), and PSD-95 (W) was observed in all three injected groups compared with PBS-injected mice; (U) AD-tau, α-syn mpffs, and combined AD-tau and α-syn mpffs did not lead to a significant decrease in synapsin levels. Normalized OD was calculated from each corresponding sample and statistical analysis was performed to analyze target protein levels in the four injection groups. One-way ANOVA followed by Tukey’s post-hoc analysis was used to analyze the data; *, P < 0.05; **, P < 0.01; ***, P < 0.001; ****, P < 0.0001. Data are presented as mean ± SEM. All experimental data were verified in at least two independent experiments.
The effect of α-syn, tau, and comorbid pathology on protein clearance
We then set to assess protein clearance mechanism to further explain the observed results under copathology conditions. Using Western blot, we assessed the functionality of autophagic processing, the unfolded protein response (UPR), and the ubiquitin proteasome system in the presence of tau and/or α-syn pathology (Fig. S5 I). Compared with PBS-injected WT mice, all three injected groups showed a significant increase in P62 in the insoluble fraction, indicating the impairment of proteostasis (Fig. S5, I and J). Ubiquitin levels were also increased in the insoluble fraction of all three injected groups compared with PBS-injected WT mice (Fig. S5, I and K). We thus measured K48- and K63-linked polyubiquitin chains level to assess proteasomal degradation under α-syn/tau copathology conditions (Fig. S5, I, L, and M). K48-linked polyubiquitin levels were significantly increased under α-syn/tau copathology conditions compared with PBS-injected WT mice (Fig. S5, I and L). Moreover, K63-linked polyubiquitin levels were significantly increased in the presence of α-syn pathology or combined α-syn/tau copathology conditions, indicating that proteostasis is impaired in the presence of α-syn pathology and exacerbated under copathology conditions (Fig. S5, I and M). Impaired autophagy was also confirmed by measuring protein clearance, as LC3-2 levels were significantly increased in the presence of tau, α-syn, or α-syn/tau copathology (Fig. S5, I and N). The endoplasmic reticulum stress markers binding Ig protein (BIP) and eIF2a were significantly increased in all groups compared with PBS-injected WT mice (Fig. S5, I, O, and P).
The effect of α-syn, tau, and comorbid pathology on cell viability markers
To further dissect the mechanism by which α-syn and tau pathology affect the brain, we measured cell viability markers in our seeding model (Fig. S5 Q). No significant neuronal loss was observed between all groups by measuring NeuN-positive cells (Fig. S5, Q and R). Interestingly, neurofilament light chain (NFL) was significantly reduced in mice injected with AD-tau/α-syn mpffs compared with PBS-injected WT mice (Fig. S5, Q and S), while tubulin βIII levels were significantly decreased in all three injected groups compared with the PBS-injected group (Fig. S5, Q and T). We then measured the synaptic markers synapsin, synaptophysin, and PSD-95 and found a significant reduction in synaptophysin and PSD-95 levels in the brain of WT mice injected with AD-tau, α-syn mpffs, or AD-tau/α-syn mpffs compared with PBS-injected WT mice (Fig. S5, Q and U–W). Synapsin levels were not affected by injection of AD-tau, α-syn mpffs, or AD-tau/α-syn mpffs (Fig. S5, Q and V).
Discussion
Studies assessing copathology in NDDs have primarily focused on postmortem human brain characterization pointing to the importance of understanding how copathology affects the pathogenesis of amyloidogenic proteins (Colom-Cadena et al., 2013; Coughlin et al., 2019; Irwin et al., 2017; Lashley et al., 2008; Robinson et al., 2018; Toledo et al., 2016). To that end, the in vitro and in vivo studies described here have aimed at modeling copathology to further our understanding of the effect of amyloidogenic proteins on each other in NDDs (Bachhuber et al., 2015; Badiola et al., 2011; Castillo-Carranza et al., 2018; Clinton et al., 2010; Giasson et al., 2003; Guo et al., 2013; Haggerty et al., 2011; He et al., 2018; Lee et al., 2004; Masliah et al., 2001; Morris et al., 2011; Ono et al., 2012; Roberts et al., 2017; Sengupta et al., 2015; Tsigelny et al., 2008; Wills et al., 2011). In this study, we sought to characterize α-syn/tau copathology conditions in the human brain and then to model the interaction of α-syn and tau using in vivo injection as well as in vitro transduction models.
Neuropathological data obtained from PD and non-PD donors in the CNDR brain bank showed a strong association between α-syn and tau pathology burden in the human neurodegenerative disease brain. Briefly, patients with Braak stage 1–2 neurofibrillary tau pathology were selected in this study and then subdivided into primary Lewy body PD versus non-PD groups. We excluded AD brains and brains with Aβ deposits as a confounding factor by selecting patients with no Aβ plaque staining in the brain. Our analyses showed that the primary sites of α-syn pathology such as the midbrain also had p-tau in PD patients, while p-tau–rich sites in non-PD patients such as the cortex did not show any α-syn pathology. Importantly, we also demonstrate that α-syn– and tau-positive inclusions in the midbrain were almost always found in the same cells, while in the cortex, they were found in different neurons.
To model α-syn and tau copathology in vivo, we injected α-syn mpffs, AD-tau, or the mixture of α-syn mpffs and AD-tau into the brains of WT mice and followed them for 3, 6, and 9 mpi. We then extended these studies by injecting α-syn mpffs into the brains of tauKO mice and AD-tau into the brains of α-synKO mice, thereby assessing the effect of each protein on the spreading of the other. First, we assessed α-syn pathology in the brains of WT mice injected with α-syn mpffs and mice injected with α-syn mpffs combined with AD-tau by quantifying the surface area occupied by p-α-syn in different brain regions. The p-α-syn load was similar in the hippocampus of both groups across the different time points. As expected, we observed α-syn pathology in brain areas known to be directly connected with the hippocampus in WT mice (Oh et al., 2014). At 3 mpi, a significant increase in p-α-syn was observed in the entorhinal cortex of mice injected with AD-tau/α-syn mpffs compared with α-syn mpff–injected WT mice. The p-α-syn burden was similar between groups at 6 and 9 mpi in the entorhinal cortex and across time points in all connected structures. Importantly, under tau/α-syn copathology conditions, the p-α-syn spreading rate and pattern was not different from α-syn mpff–injected WT mice. Consistent with the in vivo results, combined transduction of AD-tau/α-syn mpffs or α-syn mpffs alone in WT hippocampal neurons showed similar amounts of p-α-syn–positive neuronal and neuritic pathology. To further assess the relationship between α-syn and tau, we compared p-α-syn burden and spreading in tauKO mice and WT littermates. P-α-syn burden was similar in the hippocampus and the connected regions in tauKO and WT mice. Finally, α-syn pathology manifested as neuritic and neuronal inclusions in the presence of p-tau pathology and in the absence of tau, indicating that tau is not essential or required for the formation of α-syn pathology in the brain. Thus, based on the data presented above, we conclude that pathological α-syn is capable of seeding and recruiting endogenous α-syn to form aggregates in the brain independently of tau. Our results are in agreement with previous published work pointing to the ineffectiveness of tau in inducing α-syn pathology (Badiola et al., 2011; Nonaka et al., 2010). Interestingly, knocking out tau in a α-syn Tg mice did not reverse or rescue α-syn–related motor deficits and toxicity, indicating that α-syn acts independently to confer its toxicity (Morris et al., 2011).
Contrary to α-syn, p-tau burden was significantly increased in the hippocampus of WT mice injected with combined AD-tau/α-syn mpffs compared with AD-tau–injected WT mice. Increased p-tau was also observed in brain regions connected to the hippocampus, including the entorhinal cortex, contralateral hippocampus, auditory cortex, and supramammillary nucleus. Our findings strongly corroborate the previously reported interactions between tau and α-syn pathologies (Badiola et al., 2011; Clinton et al., 2010; Gerson et al., 2018; Giasson et al., 2003; Guo et al., 2013; Kaul et al., 2011; Sengupta et al., 2015). Differences in tau burden in connected structures were significant at early time points. At later time points, tau burden was similar between groups, possibly due to the slower rate of p-tau pathology formation in AD-tau–injected mice (Guo et al., 2016; Narasimhan et al., 2017), the clearance of tau or other proteins, or cell loss. Our results point to the ability of α-syn to modulate tau burden by influencing the rate of tau spreading.
To further assess the modulatory effects of α-syn on tau pathology, we injected AD-tau into the brains of α-synKO and WT mice and showed that tau pathology in α-synKO mice was significantly decreased in several brain regions. However, at the injection site, p-tau levels were similar between α-synKO and WT mice, pointing to the ability of AD-tau to seed pathology in the absence of α-syn. Importantly, in vitro data show that α-syn knockdown in WT neurons efficiently reduces insoluble tau accumulation by limiting either seeding or spreading. In vivo, p-tau burden was significantly decreased in α-synKO mice in the entorhinal cortex, retrosplenial cortex, auditory cortex, and supramammillary nucleus. At 3 and 6 mpi, the p-tau burden was lower in α-synKO mice which showed a relative increase in p-tau staining at 9 mpi. Interestingly, when comparing p-tau levels between time points, we noticed a delay in the time when the p-tau burden peaked in the hippocampal connected structures of α-synKO mice compared with WT littermates. To control for possible confounds from the knockout of α-syn in mice, our experiments showed that neuronal vesicular trafficking, activity, and connectivity are intact in the absence α-syn in mice.
In vivo seeding studies have previously identified neuronal populations that are susceptible to tau and α-syn accumulation in the brain (Guo et al., 2016; Narasimhan et al., 2017; He et al., 2018; Luna et al., 2018; Robinson et al., 2018; Bassil et al., 2020). Under copathology conditions, neither the appearance nor cellular localization of α-syn and tau neuronal pathology was influenced by the presence of each other. However, neuritic tau pathology was modulated by the presence α-syn pathology, as it was increased in the presence of p-α-syn pathology and significantly reduced in α-synKO mice.
Proteinaceous hallmarks of NDDs commonly adopt β-pleated sheet conformations that have been shown to cross-seed, template, and promote the fibrilization of one another (Giasson et al., 2003; Guo et al., 2013; Mandal et al., 2006; Ono et al., 2012; Tsigelny et al., 2008). Indirect interaction of α-syn and tau has also been described in the literature through destabilization of microtubules or kinase-dependent mechanisms (Carnwath et al., 2018; Li et al., 2016; Moussaud et al., 2014). Indeed, α-syn can induce tau pathology through the destabilization of tubulin and its interaction with tau, which results in both tau aggregation and cytoskeleton disorganization (Esposito et al., 2007; Wersinger and Sidhu, 2005). Unbound, destabilized tau is then phosphorylated and aggregated due to the increase in kinase activity in response to α-syn pathology and increase concentration of unbound tau in the cytosol (Moussaud et al., 2014).
Tau hyperphosphorylation induced by α-syn aggregates has been demonstrated in several studies and could be a mechanism that explains how α-syn triggers tauopathy. Tau has been found to be hyperphosphorylated in α-syn–overexpressing Tg mice. Interestingly, tau hyperphosphorylation was coupled to an increase in both ERK and JNK, known tau kinases that phosphorylate tau at S396 and S404 (Frasier et al., 2005; Kaul et al., 2011; Oaks et al., 2013). In vitro, α-syn promotes tau phosphorylation at S262 and S356 residues via protein kinase A (Jensen et al., 1999). Another tau kinase, GSK3β, is known to be activated in an α-syn–dependent manner, leading to tau hyperphosphorylation at T181, S396, and S404 (Duka et al., 2006, 2009; Kawakami et al., 2011). GSK3β inhibition was able to rescue cell death and decrease α-syn and tau phosphorylation (Duka et al., 2009). Moreover, our in vivodata are in line with the literature, as α-syn mpff–injected WT mice showed an increase in several tau phosphorylating kinases in addition to a reduction in tau dephosphorylation, leading to a significant increase in tau pathology in the brain. Moreover, our in vitro data are also in line with the literature, as α-syn mpff–transduced hippocampal neurons induced insoluble tau aggregates, which were localized in p-α-syn–positive neurons. Indeed, immunoelectron microscopy showed that insoluble α-syn and tau are in proximity, suggesting the possibility of cross-seeding. Interestingly, other studies have shown that the 14–3-3 cochaperone protein, known to bind to tau, shares a region of homology with α-syn. It is thus proposed that α-syn may be able to substitute 14–3-3 cochaperone activity on tau (Chen et al., 2019; Ostrerova et al., 1999).
Other potential routes through which α-syn and tau can influence each other would be through the autophagy–lysosomal pathway, proteostasis, or the UPR, systems that are known to mediate the clearance of these proteins in the brain (Bassil et al., 2020; Deleidi and Maetzler, 2012; Liu et al., 2016; Tan et al., 2008; Tanik et al., 2013; Yu et al., 2019). We have previously shown that the ubiquitin–proteasome system, autophagy, and the UPR are altered in the presence of α-syn/Aβ plaque copathology (Bassil et al., 2020). Our data point to an alteration of the ubiquitin–proteasome system marked by the increase of ubiquitin, K48, and K63 polyubiquitin chains under α-syn/tau copathology. Interestingly, autophagy was impaired in the presence of tau, α-syn, and α-syn/tau copathology marked by the increase in LC3 -2 and P62. The observation that AD-tau pathology is accelerated and amplified in the presence of α-syn pathology might be due to the ability of α-syn to compromise protein clearance, resulting in the enhancement of tau seeding and spreading. While the results in Fig. S5 point to a potential indirect interaction between α-syn and tau, we remain cautious about interpreting it, as some variability was found in some of the groups. The data reported were underpowered due to the unforeseen COVID-19 shutdown of our laboratory. Future studies should focus on dissecting the interaction of α-syn and tau in the brain by further characterizing the pathways we show in this study.
Moreover, combined AD-tau/α-syn transduction resulted in the appearance of insoluble tau aggregates in p-α-syn–positive and negative neurons compared with AD-tau that rarely induced tau pathology in cell bodies and primarily showed staining in neurites. The results summarized above provide evidence of both direct and indirect routes through which α-syn and tau can interact in the brain. Importantly, our results support the view that α-syn facilitates and promotes tau aggregation as well as modulates the spreading of pathological tau in the brain. The models described here will not only provide novel systems for developing further understanding of the mechanisms through which tau pathogenesis occurs in synucleinopathies, but also help clarify the role of α-syn as a potentiator of tau pathology spreading in NDDs.